Clustering Properties of restframe UV selected galaxies II:
Migration of star formation sites with cosmic time from GALEX and
CFHTLS
Abstract
We analyze the clustering properties of ultraviolet selected galaxies by using GALEX - SDSS data at and CFHTLS deep imaging at . These datasets provide a unique basis at which can be directly compared with high redshift samples built with similar selection criteria. We discuss the dependence of the correlation function parameters (, ) on the ultraviolet luminosity as well as the linear bias evolution. We find that the bias parameter shows a gradual decline from high () to low redshift (). When accounting for the fraction of the star formation activity enclosed in the different samples, our results suggest that the bulk of star formation migrated from high mass dark matter halos at (, located in high density regions), to less massive halos at low redshift (, located in low density regions). This result extends the “downsizing” picture (shift of the star formation activity from high stellar mass systems at high to low stellar mass at low ) to the dark matter distribution.
1 Introduction
Accumulated evidence shows that the cosmic Star Formation Rate (SFR) has been decreasing from by a dramatic factor of about (Hopkins 2004; Lilly et al. 1996; Madau et al. 1996; Schiminovich et al. 2005; Sullivan et al. 2000; Wilson et al. 2002). This is linked to the decrease of the contribution of the faint galaxies that dominate the star formation density, and to the strong decline of the most ultraviolet-luminous galaxies with time, given the redshift evolution of the 1500 Å luminosity function (Arnouts et al. 2005). Another aspect of this evolution, known as “downsizing” (Cowie et al. 1996), is the observation that star formation activity shifts with time from high to low stellar mass systems (Bundy et al. 2005; Jimenez et al. 2005; Juneau et al. 2005; Heavens et al. 2004, and references therein).
The star formation history results from the interplay between the physical processes driving the star formation fueling (gas cooling) and regulation (feedback), both closely related to galaxy environment. Recent simulations show that about half of the galaxy gas is accreted through a cold mode, which dominates at high redshift in high density environments, and shifts to low density environments in the local Universe (Kereš et al. 2005). The type of the dominant feedback process is expected to depend on galaxy host halo mass: supernovae explosions (e.g. Benson et al. 2003) at low mass, and AGN (e.g. Croton et al. 2006) at high mass. Cattaneo et al. (2006) show that the introduction of a critical halo mass above which there is a complete shutdown of cooling and star formation is efficient to reproduce the bimodality in galaxy properties observed in the local Universe (e.g. Baldry et al. 2004).
In this paper, we propose to set constraints on the roles of these different processes through cosmic time by assessing the spatial distribution of star formation in the Universe from high to low redshifts. A convenient method is to study the clustering properties of restframe ultraviolet (UV) selected galaxies. This has already been performed at high redshifts using Lyman Break Galaxies (LBGs) samples to show that, at these epochs, star formation is highly clustered and concentrated in overdense regions (Adelberger et al. 2005; Allen et al. 2005; Arnouts et al. 2002; Foucaud et al. 2003; Giavalisco & Dickinson 2001). The study of the redshift evolution of the clustering properties of actively star forming galaxies has now been made possible in a homogeneous way with the combination of restframe UV data collected from to . To extend high- studies, we use GALEX observations in the recent Universe and CFHTLS deep imaging at . We compute the angular correlation function (ACF) of star forming galaxies and derive their bias and its evolution.
In a companion paper, Milliard et al. (2007, hereafter Paper I), we describe in detail the methodology and the first results of the angular correlation function measurements of UV selected galaxies using a GALEX sample at . Section 2 summarizes the sample properties and presents a new restframe UV-selected sample from the band deep CFHTLS imaging survey that we use to extend the analysis to higher redshift (). We then investigate the dependence on redshift and UV luminosity of the clustering properties: , in sect. 3, bias in sect. 4. In the last section we discuss the evolution of the preferred sites of star formation over the last 90% of the age of the Universe.
2 Samples description
2.1 GALEX
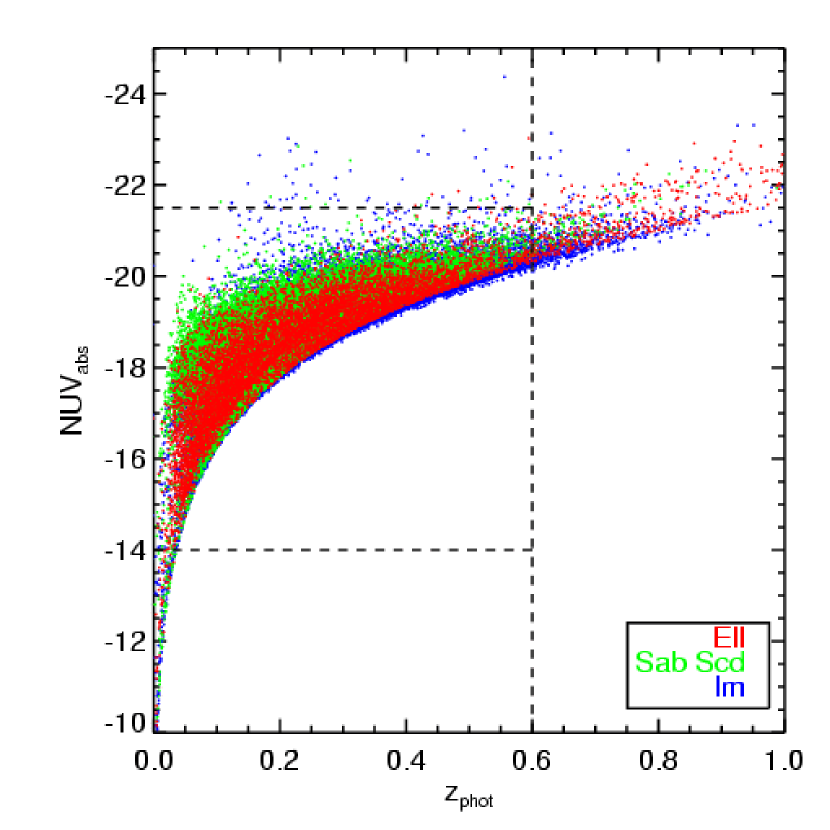
In this work, we use the same subsample of GALEX Release 2 (GR2) Medium Imaging Survey (MIS) fields cross-matched with SDSS DR5 presented in Paper I, and we refer to this paper for a full description. We recall here the main characteristics of the selection. We only keep GALEX objects with SDSS counterparts within a search radius of 4″and use the closest SDSS match. We select galaxies as objects with SDSS type equal to 3. We use the half of the MIS fields from the GR2 dataset with the lowest Galactic extinction . Photometric redshifts are computed using an empirical method (Connolly et al. 1995) trained on SDSS spectroscopic counterparts. The standard deviation estimated from the SDSS spectroscopic redshifts is . We then use a template fitting procedure (Arnouts & Ilbert, in preparation) to derive UV luminosities. Our starting samples include objects with FUV or NUV .
The NUV absolute magnitude vs photometric redshift relation is shown in figure 1. The colors code the galaxy type determined using a SED template fitting procedure: red represent elliptical types, green spiral and blue irregular. We restricted hereafter the samples to and (dashed lines on fig 1). The same cuts have been applied to the FUV sample.
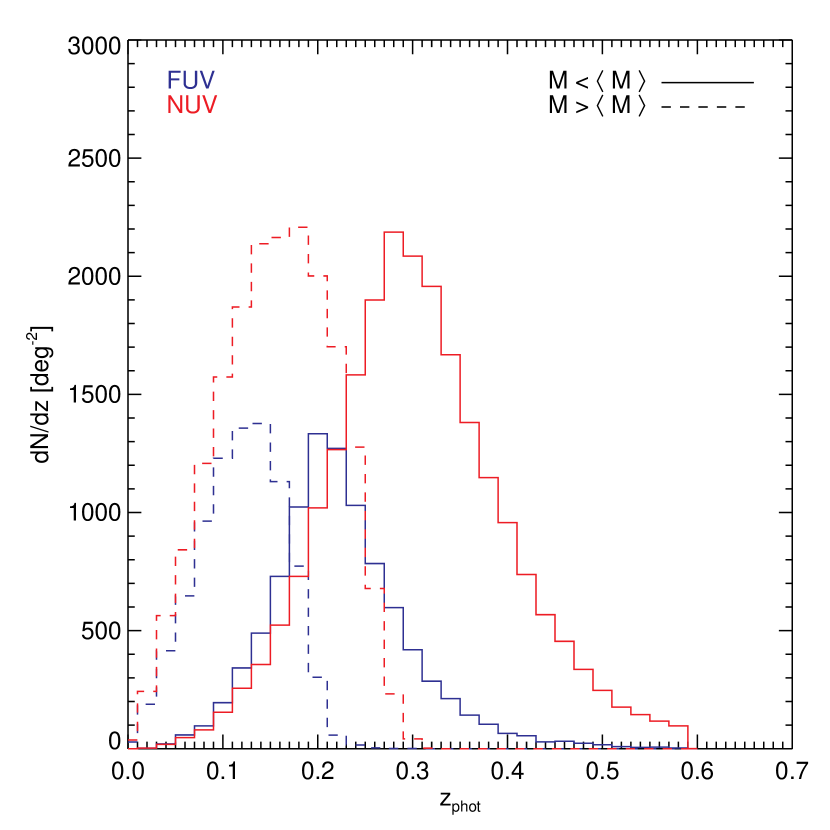
In the following, we consider both FUV and NUV bands and we divide the samples in two bins according to the mean absolute magnitude. The figure 2 shows the photometric redshift distributions of the GALEX samples; the table 1 summarizes the properties of the samples.
2.2 CFHTLS
The CFHTLS-Deep survey consists of deep multi-colour images collected
through the filters over four independent areas of 1
each and reaching the limiting magnitude of .
In this work, we use the official CFHTLS data release T0003. For a
full presentation of the CFHTLS-Deep survey, we refer to
Schultheis et al. (2006)111see also
http://www.cfht.hawaii.edu/Science/CFHLS/ and
http://www.ast.obs-mip.fr/article204.html. We built specific
masks from the -band images to mask out stars, chips edges’ and
artifacts. The total solid angle of the four fields used after masking
is 3.1 . The star/galaxy separation is based on the same method
as McCracken et al. (2003) with the half-light radius versus
magnitude plot. This selection has been applied down to . Beyond this limit, we combine the photometric criterion with the
star/galaxy classification derived from the photometric redshift code
Le Phare, (Arnouts & Ilbert, in preparation).
To construct the sample of UV selected galaxies at , we adopt
a magnitude limit of , which ensures a genuine
-selected sample as the effective wavelength (3587 Å)
corresponds to 1848 Å at our mean redshift . The fraction of objects lost (without any redshift selection)
with a cut is on average 0.07% over the four fields at
. The redshift selection of the sample is based first on a
color-color selection and then on the photometric redshift
selection. We do not adopt a single selection based on the photometric
redshifts because of the variable accuracy of the method due to
inhomogeneous exposure times in the five bands for the different
fields.
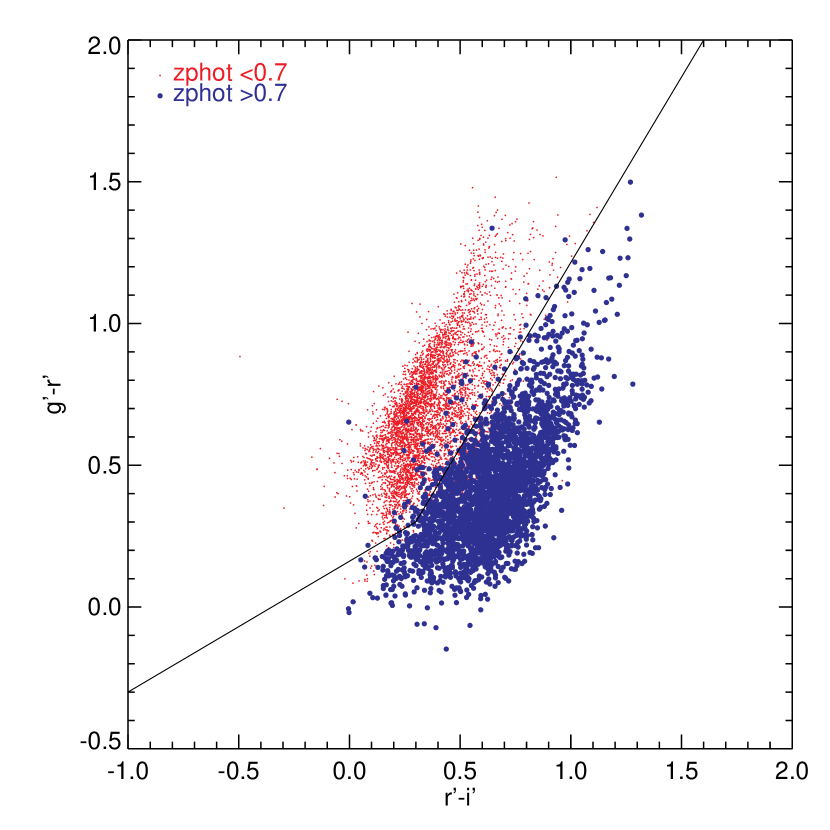
First, we use a color-color selection to isolate galaxies with , based on VVDS photometric redshifts estimation, relying
on multi-color data (Ilbert et al. 2006). As shown in
figure 3, the versus selection
criterion is efficient to separate galaxies at (big dots)
from the lower redshift population (small dots). The line shows our
separation criterion. 96% of galaxies with are
located below the line while less than 10% of low objects
() fall in the same region.
The photometric redshifts are computed by using Le Phare code and by adopting the method described by Ilbert et al. (2006). The comparison with the spectroscopic redshifts, obtained by the VVDS in the best photometric field (CFHTLS-D1, Le Fèvre et al. (2005)), for our selected sample shows an accuracy of with 4% of outliers (defined as ).
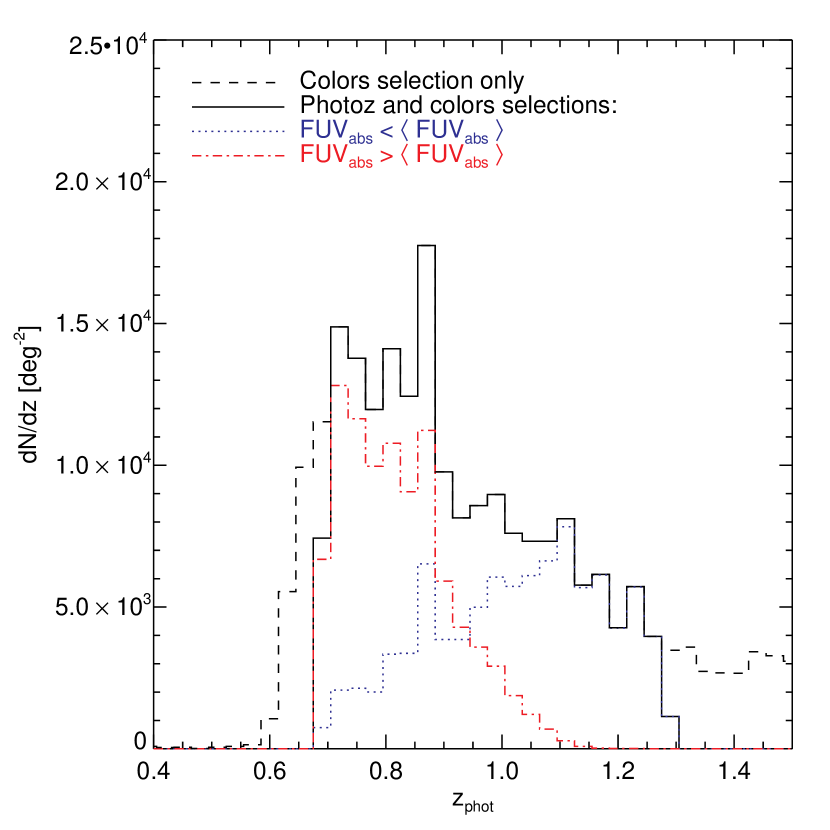
In figure 4 we show the photometric redshift distribution
of the galaxies selected with the color criterion (dashed
histogram). The final sample is obtained by further selecting objects
with (solid histogram). The absolute magnitudes in
the GALEX bands are derived from the best fitting SEDs whose NUV-rest
flux are well constrained by the , , and bands in the
redshifts range (). Note that as the filter
shifts to FUV wavelengths at , absolute magnitudes depend
very weakly on k-correction and best-fit fitting SEDs. As for GALEX samples, we divide the CFHTLS sample in two bins according to the mean
FUV absolute magnitude and the resulting redshift distributions are
shown in Fig 4.
The global properties of the CFHTLS UV samples are given in table
2.
3 Redshift evolution of the correlation function of UV-selected galaxies
We compute the ACF using the Landy & Szalay (1993) estimator. We assume that the ACF is well approximated by a power-law: ; we use a variable Integral Constraint (IC) with as free parameter during the power-law fitting process, and estimate the IC with the same method used by Roche & Eales (1999). We derive correlation lengths () for each sample from the Limber equation (Peebles 1980), using the corresponding redshift distribution. These quantities, as well as the bias parameter222See Paper I for details on the computations., are summarized in table 1 and table 2. The effects of the dust internal to galaxies have again been neglected.
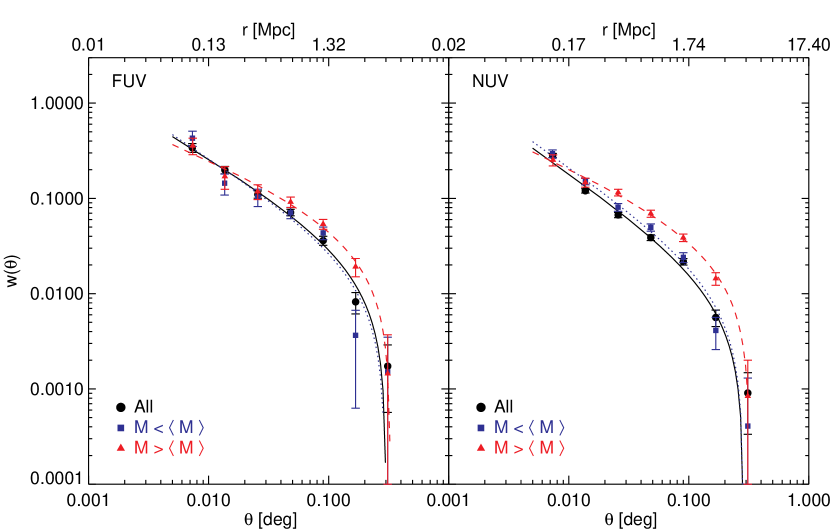
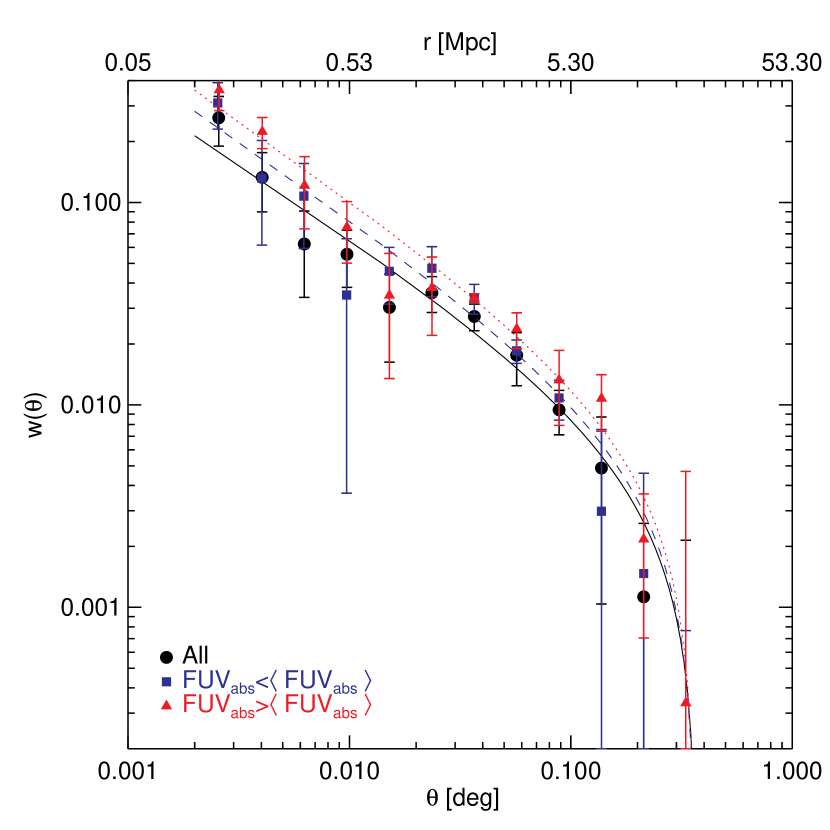
In figures 5 and 6, we show the ACFs of the GALEX and CFHTLS samples respectively. The ACFs are derived for the global samples and for two sub-samples with UV absolute luminosity brighter and fainter than the mean of each sample. The angular scales probed for the GALEX samples are to (corresponding respectively to comoving distances Mpc and Mpc at ), while to for the CFHTLS samples (resp. Mpc and Mpc at ). These ACFs are fairly well fitted by power-laws, even if a small dip appears at small scales in the FUV GALEX samples and also in the CFHTLS bright one (see sec. 3.2.2). The higher surface density of UV-selected galaxies at allows a less noisy estimation of the ACF at these epochs than at .
| FUV samples | NUV samples | ||||||
|---|---|---|---|---|---|---|---|
| All | All | ||||||
| **Number of galaxies in the samples | 42065 | 22082 | 19983 | 97038 | 52567 | 44471 | |
| -18.3 | -18.96 | -17.57 | -18.23 | -18.76 | -17.61 | ||
| 0.91 | 0.52 | 0.67 | 0.96 | 0.72 | 0.82 | ||
| -18.58 | -19.15 | -17.95 | -18.8 | -19.43 | -18.05 | ||
| 0.84 | 0.52 | 0.67 | 0.91 | 0.44 | 0.69 | ||
| ††according to photometric redshifts | 0.18 | 0.23 | 0.13 | 0.25 | 0.32 | 0.17 | |
| ††according to photometric redshifts | 0.08 | 0.07 | 0.05 | 0.11 | 0.09 | 0.06 | |
| [Mpc-3] | 2.781.03 | 0.150.03 | 2.540.95 | 2.161.19 | 0.14 0.03 | 1.95 1.06 | |
| 9.4 | 7.3 | 33.9 | 3.6 | 4.1 | 22.4 | ||
| 0.740.05 | 0.79 | 0.48 | 0.86 | 0.87 | 0.52 | ||
| [Mpc] | 4.6 | 4.6 | 5.4 | 4.1 | 4.9 | 5.5 | |
| 0.74 | 0.76 | 0.83 | 0.69 | 0.83 | 0.86 | ||
Note. — The amplitude and slope of best fit power laws to the angular correlation function, and hence the comoving correlation length account for the Integral Constraint correction, as described in Paper I.
| All | |||
|---|---|---|---|
| **Number of galaxies in the samples | 17098 | 8507 | 8591 |
| -19.41 | -19.89 | -18.94 | |
| 0.6 | 0.34 | 0.36 | |
| -19.81 | -20.19 | -19.43 | |
| 0.53 | 0.4 | 0.33 | |
| ††according to photometric redshifts | 0.94 | 1.04 | 0.84 |
| ††according to photometric redshifts | 0.16 | 0.15 | 0.09 |
| [Mpc-3] | 3.272.90 | 0.620.41 | 2.662.58 |
| [Mpc] | |||
| 1.24 | 1.38 | 1.16 |
Note. — Same note as in table 1
3.1 Clustering segregation with FUV luminosity
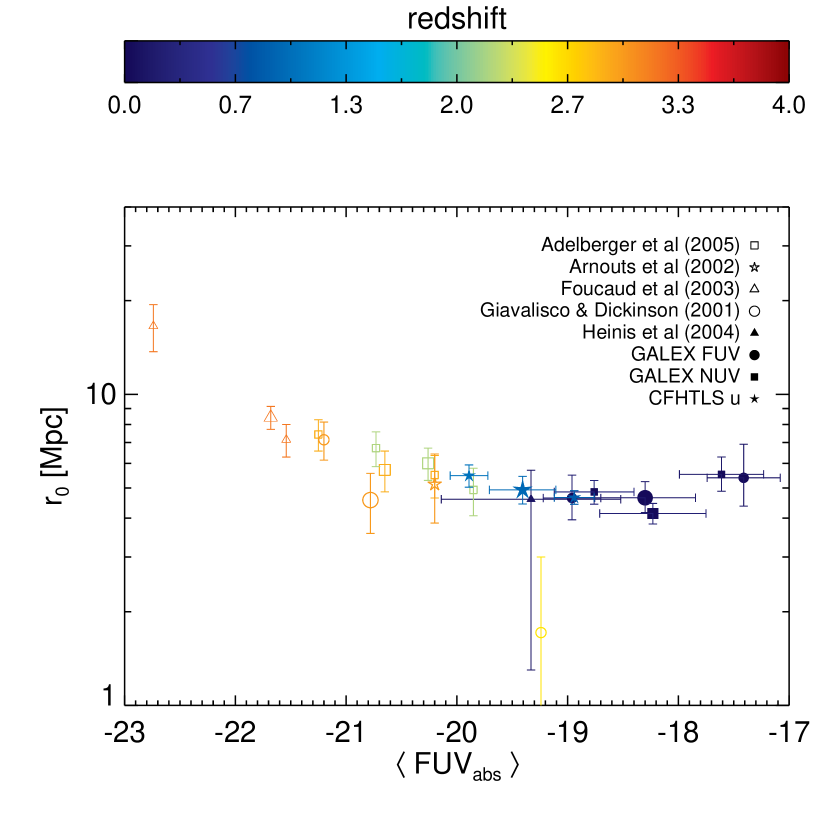
The dependence of on FUV luminosity in GALEX and CFHTLS
samples is shown in fig. 7, along with results from higher
redshift studies ()333We choose the absolute
magnitude for the comparison as most of high redshift samples are
restframe selected, and GALEX results are not strongly
dependent of the UV band.
The mean absolute magnitudes of the LBG
samples have been obtained by deriving an average apparent magnitude
from the galaxy counts, and assuming a k-correction of
. Ouchi et al. (2005) do not provide their counts, so we
computed the expected mean absolute magnitude given their limiting
absolute magnitude and the luminosity function of
Sawicki & Thompson (2006).. As the different surveys probe different parts
of the UV luminosity function with little overlap, it is difficult to
draw firm conclusions. Nevertheless, significant differences between
the samples are apparent:
-
•
We use as reference the correlation function results from Adelberger et al. (2005), Allen et al. (2005), Foucaud et al. (2003), Giavalisco & Dickinson (2001), Lee et al. (2006) and Ouchi et al. (2001) at . At these redshifts, all studies conclude a significant segregation of with UV luminosity (the more luminous the more clustered) in the range .
-
•
At , a positive correlation of with FUV is still observed for . Notably, our value of at is very close to that of Adelberger et al. (2005) obtained from samples.
-
•
At , we probe a fainter luminosity range (), and a weak anti-correlation of with FUV is apparent, though given the error bars, it is compatible with no FUV luminosity segregation of .
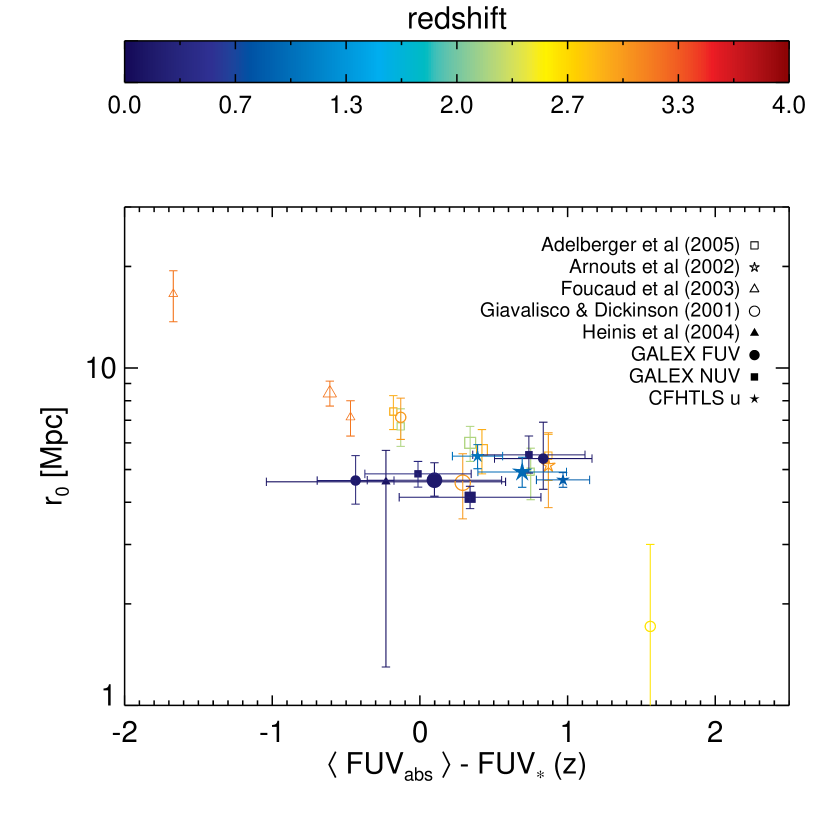
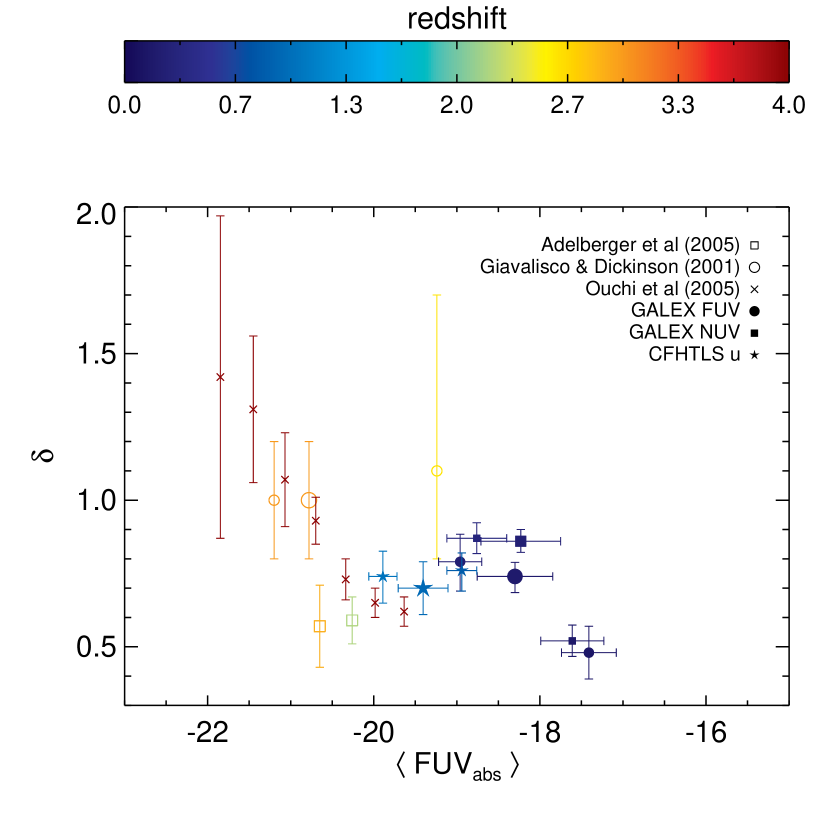
The values of as a function of FUV luminosity for FUV selected samples at different redshifts follow a unique smooth curve, with a significant slope at the bright end and a flat or slightly negative slope at the faint end. A similar segregation is observed with luminosity at low redshift, with optical selection criteria (Benoist et al. 1996; Guzzo et al. 2000; Norberg et al. 2002; Willmer et al. 1998; Zehavi et al. 2005). In particular, Norberg et al. (2001) showed that for blue-selected galaxies increases only slowly for galaxies fainter than , while it varies strongly for galaxies brighter than . Indeed, using -body simulations Benson et al. (2001) showed that could be a natural boundary in the distribution of the halos hosting galaxies, galaxies fainter than being hosted by a mix of low and high mass halos, while galaxies brighter than hosted by more and more massive haloes. To check if could play a similar role in UV samples, we show in figure 8 as a function of , where the evolution of with is taken from Arnouts et al. (2005) (for ) and Sawicki & Thompson (2006) (for ). The luminosity dependence of changes noticeably when expressed as a function of , as two different trends are observed according to the redshift range:
-
•
At , for the high samples and our CFHTLS sample, the behavior of with is qualitatively compatible with the monotonic trend described above, the brighter galaxies being more clustered.
-
•
At (GALEX samples) a radically different behavior of vs is seen. An anti-correlation or no correlation (given the errorbars) is observed, with brighter samples showing slightly lower than fainter ones.
This suggests that the luminosity segregation mechanisms of the clustering at low redshifts work in a different regime, or that is not the relevant variable.
3.2 ACF slope segregation with FUV luminosity
3.2.1 ACF slope
The slope of the ACF (), which describes the balance between
small and large scale separations, is an important indicator on the
nature of the spatial distribution of a given population. In paper I,
we found that the estimates of the slope inferred from the global
GALEX samples () are steeper than those
derived from optically selected blue galaxies in the local Universe:
(Budavári et al. 2003; Madgwick et al. 2002; Zehavi et al. 2002, 2005).
In figure 9, we now analyse the dependence of
on UV luminosity for the different samples (GALEX samples:
filled circles for FUV and filled squares for NUV; CFHTLS samples:
filled triangles; high samples: empty squares, open circles and
crosses; all points color-coded with redshift).
At , the compilation of measurements showed here, and especially those at at , from Ouchi et al. (2005) indicate that the ACF slope steepens at higher UV luminosities.
Ouchi et al. (2005) claimed that this trend, well modeled in the Halo
Occupation Distribution (HOD) framework, is not an actual slope
variation but it is related to the halo occupancy. Based on HOD
models, they show that the contribution of satellite galaxies (’one
halo term’, see e.g. Zehavi et al. (2004)) increases when selecting
brighter galaxies, by enhancing the small scale signal of the ACF ( Mpc). This effect produces an apparent steepening of
the observed slope .
Our GALEX sample at seems to
produce a similar although less pronounced effect. Our current low
GALEX data do not allow to perform detailed comparison between
observations and HOD models, but we have investigated if the observed
steepening with luminosity can be partially due to the small scale
component. We fitted the GALEX ACF only at scales Mpc (see
sec. 3.2.2) or Mpc in order not to include the one
halo term component. We do not observe any significant change with
respect to our initial slopes. However doing so we face at large
scales the problems of lower signal-to-noise ratio and more important
contribution of the Integral Constraint bias that prevent us to make
firm statements. This test thus relies on the efficiency of our power
law fitting process in recovering the true ACF (see Paper I).
In
other words, at low redshift, we do not see evidence that the one halo
term plays a major role in the slope of the ACF, as observed at high
redshift, which is expected from simulations
(Kravtsov et al. 2004). Hence this indicates that our clustering
parameters (, and bias, ) reflect the large scale
clustering of star forming galaxies, which enables us to make
comparisons with analytical predictions for the clustering of Dark
Matter Haloes.
3.2.2 Dip in the ACF ?
The ACFs derived for the various GALEX and CFHTLS samples are globally well described by a power-law, but some of our ACFs show a little dip around 0.35 Mpc, the GALEX FUV ones for instance, and also the brightest CFHTLS sample at (at a slightly larger scale Mpc). This recalls the departure to the power-law observed in other surveys and interpreted as the transition between the one and two halo terms in the HOD framework. Zehavi et al. (2004) showed that this transition occurs at Mpc for -band selected galaxies. It is expected that this scale should be shorter for bluer galaxies, residing in less massive halos, as showed by Magliocchetti & Porciani (2003) in observations and Berlind et al. (2003, see their fig. 22) in simulations, with a transition scale for late-types galaxies at Mpc, close to what we observe. Finally and very interestingly Ouchi et al. (2005) observe this transition for LBGs at at 0.35 Mpc, the same comoving scale as we get.
Comparing measurements with predictions from HOD models is a natural perspective of this work, to probe the redshift evolution of the halo occupancy of star-forming galaxies. This will be addressed in details in a forthcoming paper with enlarged datasets.
4 Bias of star-forming galaxies from to
The link between the properties of the galaxy distribution and the underlying Dark Matter density field can be accessed via the bias formalism. The bias parameter is indicative of the masses of the dark matter halos that preferentially host the observed galaxy population (e.g. Giavalisco & Dickinson 2001; Mo & White 2002; Ouchi et al. 2004), i.e. in our case, actively star forming galaxies. The DM halo bias is a direct output of Mo & White (2002) models. For galaxies, we assume a linear bias to convert in , a common, though questionable, assumption (see e.g. Marinoni et al. 2005).
4.1 Redshift evolution of the bias
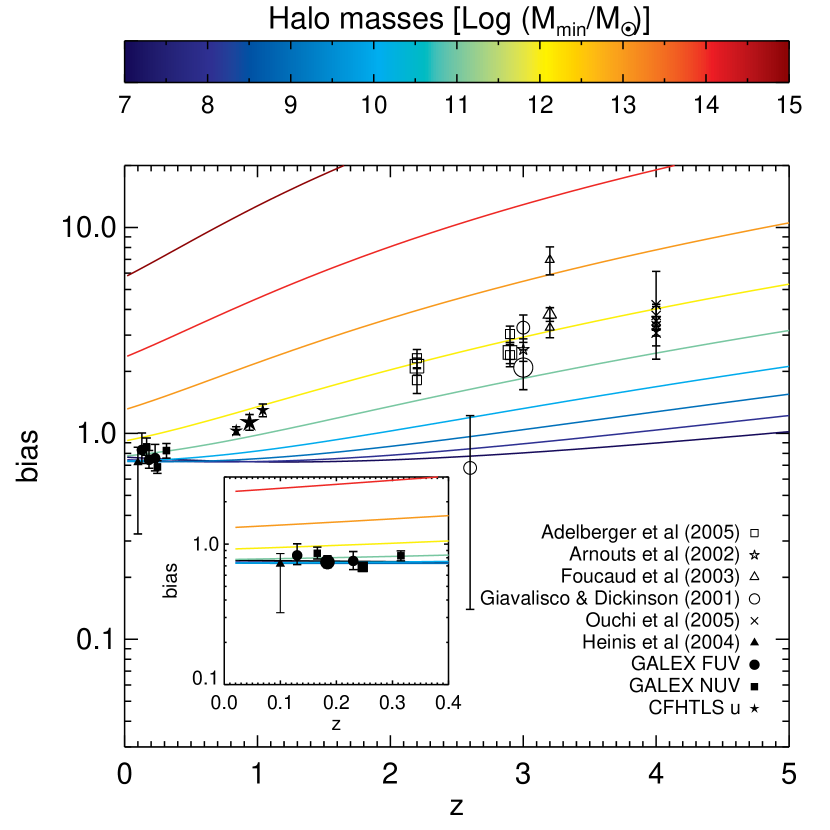
Figure 10 shows as symbols the redshift evolution of the
bias parameter measured at 8 Mpc defined as (see e.g. Magliocchetti et al. 2000)
for the different samples discussed above.444For
Adelberger et al. (2005) subsamples, values are not available;
we assumed that the slopes are the same than those of their global
samples. The expected relative error on the inferred bias is lower
than 10% if . The bias values for our GALEX and CFHTLS
samples are reported in tables 1 and
2 respectively.
The observed bias of star-forming galaxies shows a gradual increase
with look back time:
at , UV galaxies are strongly biased (Giavalisco & Dickinson 2001; Foucaud et al. 2003), with , and at a given redshift the bias
increases with FUV luminosity (FUV luminosity segregation).
At , the mean bias is ,
indicating that star-forming galaxies are closer tracers of the
underlying mass distribution at that time.
At , given the error bars, the mean bias is consistent with
0.8 for all GALEX samples (), a slight anti-bias independent of the UV
luminosity.
In figure 10, we also show the effective bias evolution
derived from the Mo & White (2002) formalism for different minimum Dark
Matter Halo (DMH) mass thresholds. A comparison can be made to the
bias of star forming galaxies, if one assumes that most haloes do not
host more than one star-forming galaxy. This coarse assumption is
likely inaccurate for star-forming galaxies selected at high redshifts
in FUV with a well developed one-halo term (Kashikawa et al. 2006; Lee et al. 2006), but is acceptable at low redshifts in the FUV since the
one-halo term does not seem to play a major role as discussed
sect. 3.2.
The mimimum masses of the DMH that produce the bias derived for galaxies are at , at and at . There is an obvious degeneracy of the models at low redshifts, but the locally observed bias is definitely in the region of low cutoff masses. This is a hint that observed star-forming galaxies at low redshift reside preferentially in less massive halos than high star-forming galaxies.
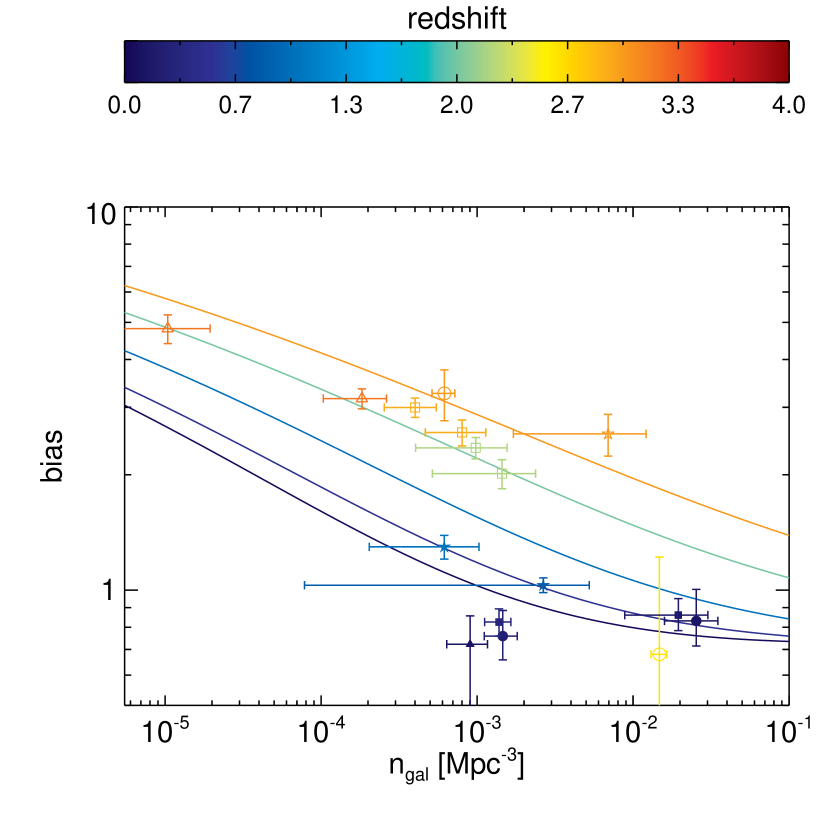
4.2 Bias and galaxy number density
In fig. 11 we show the bias a function of the galaxy number density for UV-selected samples and the predicted relation between the effective bias and the number density of DMHs at (curves from bottom to top). At high redshift (), we observe the well known luminosity segregation effect, brighter galaxies (less abundant) having a larger bias, in good agreement with DMH models predictions (the less abundant, the more clustered). In contrast at low (), a significant departure to this relation is observed. At , the CFHTLS data show a bias slightly lower than the expected one according to the observed density with approximately 3 times lower than expected. This seems even worse for our brightest samples at , as these galaxies are about 10 times less numerous than expected according to their bias values. In the model discussed here, we implicitly assume that one DMH hosts one galaxy, which provides a fairly reasonable description of the observations at high , to the level of precision allowed here (see e.g. Adelberger et al. 2005; Ouchi et al. 2004, for more detailed discussions on this point). At , this assumption may be not valid anymore and our results suggest that star forming galaxies (especially the brightest) are not hosted by a significant fraction of the DMHs with similar clustering properties. This implies that the DMH occupation fraction, that is roughly at high redshift (), drops to 0.3 and 0.1 at and respectively.
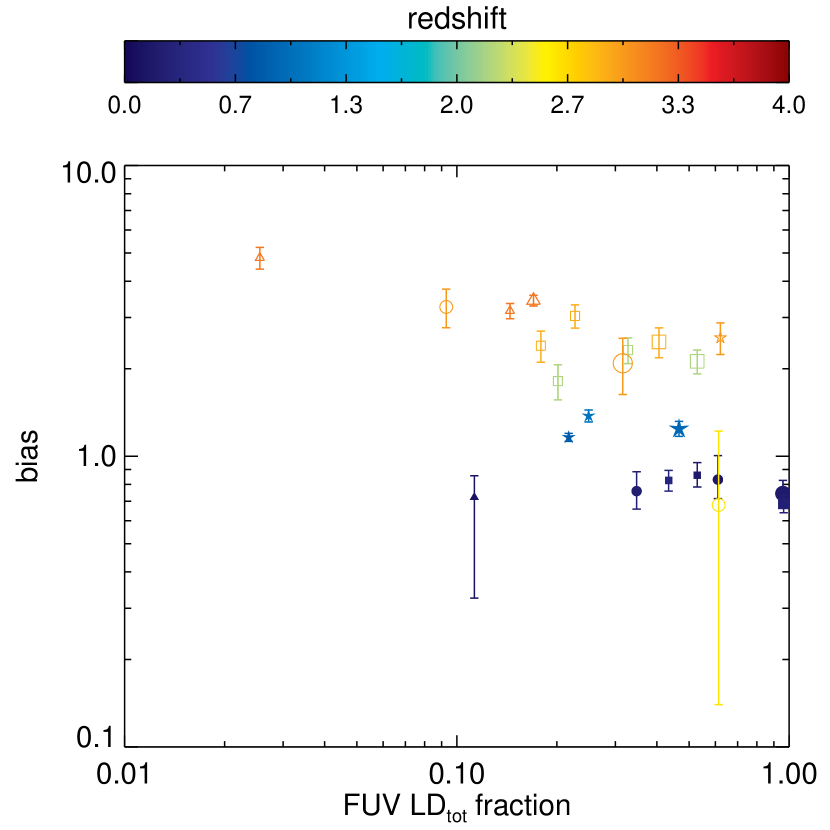
4.3 Bias and FUV LD fraction
The very limited overlap in FUV luminosities of the data at different redshifts does not allow a derivation of the bias evolution with redshift at fixed FUV luminosity. However, despite the fact that low samples reach fainter luminosities than high ones, they happen to probe the same fraction of total FUV luminosity densities, owing to the strong evolution of the FUV luminosity function with (Arnouts et al. 2005). In particular at all redshifts the samples are able to probe the bulk of star formation, i.e. they encompass a fraction of the FUV luminosity density (LD) greater than 0.5. This can be seen in fig. 12 where we show the bias as a function of the fraction of the total FUV LD enclosed by the different samples. This favorable situation allows us to track the evolution with redshift of the clustering at a fixed fraction of the FUV LD, an essentially constant fraction of the star formation rate.
The fraction of the LD for each sample is computed by comparing the
total LD at the relevant redshift (from the FUV Luminosity function
parameters of Arnouts et al. (2005) and Sawicki & Thompson (2006)), to the
LD enclosed by each sample according to its flux limits converted to
FUV luminosity cuts555Note that while LBG samples are by
construction volume-limited, we cannot adopt this approach for the
GALEX samples due to limited statistics. This means that faintest
galaxies are underrepresented, especially in our higher redshift
GALEX samples. However, as we do not observe a strong luminosity
dependence of the bias within the GALEX samples, we expect this has
only a small impact..
Note that we do not attempt to correct for
galaxy internal dust attenuation. As brighter UV galaxies present
higher extinction in the local Universe (Buat et al. 2005), the strong
brightening of with redshift (e.g. Arnouts et al. 2005)
may introduce a small bias as a given LD fraction could not correspond
exactly to the same star formation rate fraction at the different
redshifts we explore here.
The plot confirms the result already apparent in fig. 10 of a significant decrease of the bias of UV selected galaxies from high to low redshifts, but now selected on the basis of a physically defined parameter, the fraction of the FUV luminosity density. Near an LD fraction of , the bias is divided by a factor 3, between redshifts near 3, shifting from in the redshift range down to in the local universe.
5 Discussion
In paper I we reported on the overall clustering properties of the UV-selected galaxies in GALEX samples, the largest ones available to date at low redshift and at these wavelengths. These samples allow for the first time an investigation of the clustering properties of UV-selected galaxies as a function of different parameters at , which can be compared to higher redshift samples also selected in the rest frame FUV.
The measurements from the GALEX samples confirm previous results for rest-UV selected galaxies at low redshifts indicating that they are weakly clustered (Heinis et al. 2004), with an autocorrelation function well approximated by a power law in the range Mpc.
At , the correlation length of the rest-UV selected galaxies from CFHTLS data is found comparable to those of the emission-line samples from Coil et al. (2004) in the same redshift range, but slightly higher than those obtained by Meneux et al. (2006) for late type and irregular galaxies (their types 3 and 4, selected in the visible). At those redshifts, according to our CFHTLS sample, star forming galaxies are modestly biased with , which under the linear bias hypothesis implies they are closer tracers of the mass distribution than their higher redshift counterparts. As opposed to the dependence found at redshifts above (Giavalisco & Dickinson 2001; Foucaud et al. 2003), no strong positive correlation between the bias and the FUV luminosity is observed in the local universe, but rather a slight anti-correlation or no correlation. At , given the error bars, the mean bias is consistent with 0.8 for all GALEX samples () independently of the UV luminosity.
5.1 Migration of the bulk of star formation sites from to the local universe
In this study, we find a decrease by a factor 3.1 of the bias with respect to mass, from redshifts near to the local universe in the UV flux-limited samples, and more importantly in samples selected in UV luminosity so that they encompass a constant fraction of the luminosity density at all . This decrease is slightly larger than the factor 2.7 derived from the Mo & White (2002) model for the haloes that host most star formation at redshift , an indication that star forming galaxies tend to be hosted by haloes of lower mass in the local universe. This is the main conclusion of the present study.
The “downsizing” scenario (Cowie et al. 1996; Juneau et al. 2005; Bundy et al. 2005; Heavens et al. 2004) states that the star formation shifts from high stellar mass systems at high redshift to low ones at low redshift. Our results extend this vision in the sense that the same trend is observed for the mass of the dark matter halos that host actively star forming galaxies.
The DMH mass migration of the bulk of the star formation might be associated with regions of different densities. At high redshifts, LBGs studies show that active star formation traced by the UV light resides preferentially in overdense regions (Adelberger et al. 1998; Blaizot et al. 2004; Giavalisco 2002; Steidel et al. 1998; Tasker & Bryan 2006). At low redshift, Abbas & Sheth (2005) showed that the slope of the fitted power law is steeper in underdense regions, and that the correlation length is smaller. The observed steeper ACFs for the more UV-luminous galaxies at low suggest that the most star-forming objects reside preferentially in regions where the local galaxy density is lower than for the fainter ones, a result in agreement with direct optical based studies of star formation as a function of galaxy density in the local universe (Gómez et al. 2003; Lewis et al. 2002).
References
- Abbas & Sheth (2005) Abbas, U., & Sheth, R. K. 2005, MNRAS, 364, 1327
- Adelberger et al. (1998) Adelberger, K. L., Steidel, C. C., Giavalisco, M., Dickinson, M., Pettini, M., & Kellogg, M. 1998, ApJ, 505, 18
- Adelberger et al. (2005) Adelberger, K. L., Steidel, C. C., Pettini, M., Shapley, A. E., Reddy, N. A., & Erb, D. K. 2005, ApJ, 619, 697
- Allen et al. (2005) Allen, P. D., Moustakas, L. A., Dalton, G., MacDonald, E., Blake, C., Clewley, L., Heymans, C., & Wegner, G. 2005, MNRAS, 360, 1244
- Arnouts et al. (2002) Arnouts, S., et al. 2002, MNRAS, 329, 355
- Arnouts et al. (2005) Arnouts, S., et al. 2005, ApJ, 619, L43
- Arnouts & Ilbert, (in preparation) Arnouts, S., & Ilbert, 0. in preparation
- Baldry et al. (2004) Baldry, I. K., Glazebrook, K., Brinkmann, J., Ivezić, Ž., Lupton, R. H., Nichol, R. C., & Szalay, A. S. 2004, ApJ, 600, 681
- Benoist et al. (1996) Benoist, C., Maurogordato, S., da Costa, L. N., Cappi, A., & Schaeffer, R. 1996, ApJ, 472, 452
- Benson et al. (2001) Benson, A. J., Frenk, C. S., Baugh, C. M., Cole, S., & Lacey, C. G. 2001, MNRAS, 327, 1041
- Benson et al. (2003) Benson, A. J., Bower, R. G., Frenk, C. S., Lacey, C. G., Baugh, C. M., & Cole, S. 2003, ApJ, 599, 38
- Berlind et al. (2003) Berlind, A. A., et al. 2003, ApJ, 593, 1
- Blaizot et al. (2004) Blaizot, J., Guiderdoni, B., Devriendt, J. E. G., Bouchet, F. R., Hatton, S. J., & Stoehr, F. 2004, MNRAS, 352, 571
- Buat et al. (2005) Buat, V., et al. 2005, ApJ, 619, L51
- Budavári et al. (2003) Budavári, T., et al. 2003, ApJ, 595, 59
- Bundy et al. (2005) Bundy, K., et al. 2005, ArXiv Astrophysics e-prints, arXiv:astro-ph/0512465
- Burgarella et al. (2006) Burgarella, D., et al. 2006, A&A, 450, 69
- Cardelli et al. (1989) Cardelli, J. A., Clayton, G. C., & Mathis, J. S. 1989, ApJ, 345, 245
- Cattaneo et al. (2006) Cattaneo, A., Dekel, A., Devriendt, J., Guiderdoni, B., & Blaizot, J. 2006, MNRAS, 370, 1651
- Coil et al. (2004) Coil, A. L., et al. 2004, ApJ, 609, 525
- Connolly et al. (1995) Connolly, A. J., Csabai, I., Szalay, A. S., Koo, D. C., Kron, R. G., & Munn, J. A. 1995, AJ, 110, 2655
- Cowie et al. (1996) Cowie, L. L., Songaila, A., Hu, E. M., & Cohen, J. G. 1996, AJ, 112, 839
- Cross et al. (2001) Cross, N., et al. 2001, MNRAS, 324, 825
- Croton et al. (2006) Croton, D. J., et al. 2006, MNRAS, 365, 11
- Foucaud et al. (2003) Foucaud, S., McCracken, H. J., Le Fèvre, O., Arnouts, S., Brodwin, M., Lilly, S. J., Crampton, D., & Mellier, Y. 2003, A&A, 409, 835
- Giavalisco & Dickinson (2001) Giavalisco, M., & Dickinson, M. 2001, ApJ, 550, 177
- Giavalisco (2002) Giavalisco, M. 2002, ARA&A, 40, 579
- Gómez et al. (2003) Gómez, P. L., et al. 2003, ApJ, 584, 210
- Guzzo et al. (2000) Guzzo, L., et al. 2000, A&A, 355, 1
- Heavens et al. (2004) Heavens, A., Panter, B., Jimenez, R., & Dunlop, J. 2004, Nature, 428, 625
- Heinis et al. (2004) Heinis, S., Treyer, M., Arnouts, S., Milliard, B., Donas, J., Gal, R., Martin, D. C., & Viton, M. 2004, A&A, 424, L9
- Hopkins (2004) Hopkins, A. M. 2004, ApJ, 615, 209
- Ilbert et al. (2006) Ilbert, O., et al. 2006, A&A, 457, 841
- Jimenez et al. (2005) Jimenez, R., Panter, B., Heavens, A. F., & Verde, L. 2005, MNRAS, 356, 495
- Juneau et al. (2005) Juneau, S., et al. 2005, ApJ, 619, L135
- Kashikawa et al. (2006) Kashikawa, N., et al. 2006, ApJ, 637, 631
- Kereš et al. (2005) Kereš, D., Katz, N., Weinberg, D. H., & Davé, R. 2005, MNRAS, 363, 2
- Kravtsov et al. (2004) Kravtsov, A. V., Berlind, A. A., Wechsler, R. H., Klypin, A. A., Gottlöber, S., Allgood, B., & Primack, J. R. 2004, ApJ, 609, 35
- Landy & Szalay (1993) Landy, S. D., & Szalay, A. S. 1993, ApJ, 412, 64
- Lee et al. (2006) Lee, K.-S., Giavalisco, M., Gnedin, O. Y., Somerville, R. S., Ferguson, H. C., Dickinson, M., & Ouchi, M. 2006, ApJ, 642, 63
- Le Fèvre et al. (2005) Le Fèvre, O., et al. 2005, A&A, 439, 845
- Lewis et al. (2002) Lewis, I., et al. 2002, MNRAS, 334, 673
- Lilly et al. (1996) Lilly, S. J., Le Fevre, O., Hammer, F., & Crampton, D. 1996, ApJ, 460, L1
- Madau et al. (1996) Madau, P., Ferguson, H. C., Dickinson, M. E., Giavalisco, M., Steidel, C. C., & Fruchter, A. 1996, MNRAS, 283, 1388
- Madgwick et al. (2002) Madgwick, D. S., et al. 2002, MNRAS, 333, 133
- Magliocchetti et al. (2000) Magliocchetti, M., Bagla, J. S., Maddox, S. J., & Lahav, O. 2000, MNRAS, 314, 546
- Magliocchetti & Porciani (2003) Magliocchetti, M., & Porciani, C. 2003, MNRAS, 346, 186
- Marinoni et al. (2005) Marinoni, C., et al. 2005, A&A, 442, 801
- McCracken et al. (2003) McCracken, H. J., et al. 2003, A&A, 410, 17
- Meneux et al. (2006) Meneux, B., et al. 2006, A&A, 452, 387
- Milliard et al. (2007) Milliard, B., Heinis, S., Arnouts, S., Blaizot, J., Schiminovich, D., Budavári, T., Donas, J., Treyer, M., Wyder, T. K., & GALEX Team 2006, ApJ, submitted
- Mo & White (2002) Mo, H. J., & White, S. D. M. 2002, MNRAS, 336, 112
- Norberg et al. (2001) Norberg, P., et al. 2001, MNRAS, 328, 64
- Norberg et al. (2002) Norberg, P., et al. 2002, MNRAS, 332, 827
- Ouchi et al. (2001) Ouchi, M., et al. 2001, ApJ, 558, L83
- Ouchi et al. (2004) Ouchi, M., et al. 2004, ApJ, 611, 685
- Ouchi et al. (2005) Ouchi, M., et al. 2005, ApJ, 635, L117
- Peebles (1980) Peebles, P. J. E. 1980, Princeton University Press
- Reddy et al. (2006) Reddy, N. A., Steidel, C. C., Fadda, D., Yan, L., Pettini, M., Shapley, A. E., Erb, D. K., & Adelberger, K. L. 2006, ApJ, 644, 792
- Roberts et al. (2004) Roberts, S., et al. 2004, MNRAS, 352, 478
- Roche & Eales (1999) Roche, N., & Eales, S. A. 1999, MNRAS, 307, 703
- Sawicki & Thompson (2006) Sawicki, M., & Thompson, D. 2006, ApJ, 642, 653
- Schiminovich et al. (2005) Schiminovich, D., et al. 2005, ApJ, 619, L47
- Schlegel et al. (1998) Schlegel, D. J., Finkbeiner, D. P., & Davis, M. 1998, ApJ, 500, 525
- Schultheis et al. (2006) Schultheis, M., Robin, A. C., Reylé, C., McCracken, H. J., Bertin, E., Mellier, Y., & Le Fèvre, O. 2006, A&A, 447, 185
- Steidel et al. (1998) Steidel, C. C., Adelberger, K. L., Dickinson, M., Giavalisco, M., Pettini, M., & Kellogg, M. 1998, ApJ, 492, 428
- Sullivan et al. (2000) Sullivan, M., Treyer, M. A., Ellis, R. S., Bridges, T. J., Milliard, B., & Donas, J. 2000, MNRAS, 312, 442
- Tasker & Bryan (2006) Tasker, E. J., & Bryan, G. L. 2006, ArXiv Astrophysics e-prints, arXiv:astro-ph/0603684
- Willmer et al. (1998) Willmer, C. N. A., da Costa, L. N., & Pellegrini, P. S. 1998, AJ, 115, 869
- Wilson et al. (2002) Wilson, G., Cowie, L. L., Barger, A. J., & Burke, D. J. 2002, AJ, 124, 1258
- Zehavi et al. (2002) Zehavi, I., et al. 2002, ApJ, 571, 172
- Zehavi et al. (2004) Zehavi, I., et al. 2004, ApJ, 608, 16
- Zehavi et al. (2005) Zehavi, I., et al. 2005, ApJ, 630, 1