CHANDRA OBSERVATIONS OF SN 2004et AND THE X-RAY EMISSION OF TYPE IIP SUPERNOVAE
Abstract
We report the X-ray detection of the Type II-plateau supernova SN 2004et in the spiral galaxy NGC 6946, using the Chandra X-Ray Observatory. The position of the X-ray source was found to agree with the optical position within 0.4′′. Chandra also surveyed the region before the 2004 event, finding no X-ray emission at the location of the progenitor. For the post-explosion observations, a total of 202, 151, and 158 photons were detected in three pointings, each 29 ks in length, on 2004 October 22, November 6, and December 3, respectively. The spectrum of the first observation is best fit by a thermal model with a temperature of keV and a line-of-sight absorption of cm-2. The inferred unabsorbed luminosity ( keV) is 4 erg s-1, adopting a distance of 5.5 Mpc. A comparison between hard and soft counts on the first and third epochs indicates a softening over this time, although there is an insufficient number of photons to constrain the variation of temperature and absorption by spectral fitting. We model the emission as arising from the reverse shock region in the interaction between the supernova ejecta and the progenitor wind. For a Type IIP supernova with an extended progenitor, the cool shell formed at the time of shock wave breakout from the star can affect the initial evolution of the interaction shell and the absorption of radiation from the reverse shock. The observed spectral softening might be due to decreasing shell absorption. We find a pre-supernova mass loss rate of yr-1 for a wind velocity of 10 km s-1, which is in line with expectations for a Type IIP supernova.
1 INTRODUCTION
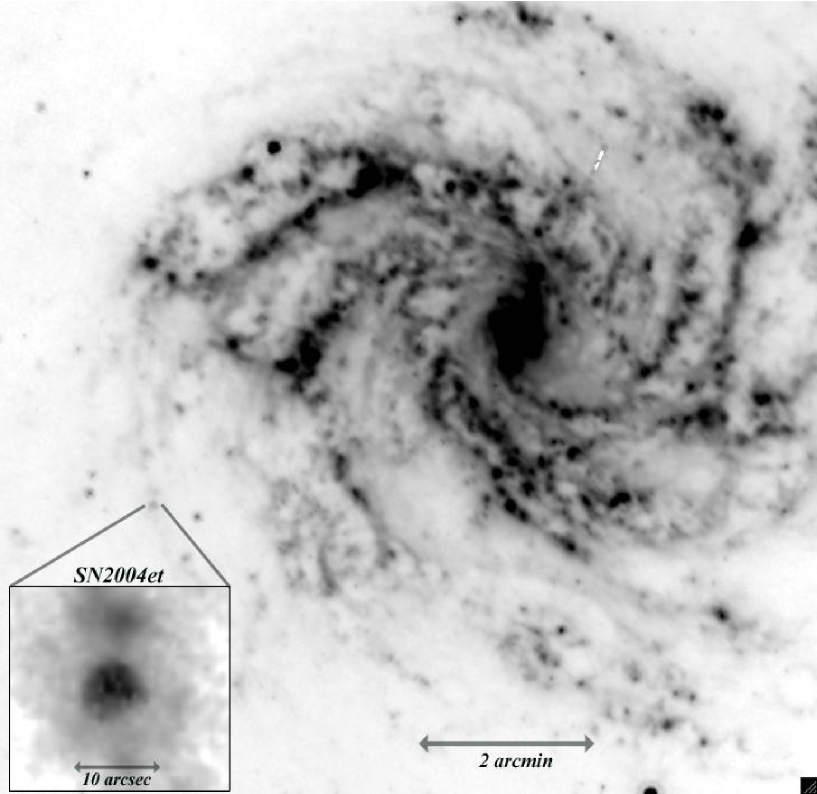
The supernova (SN) SN 2004et was optically discovered on 2004 September 27 by Zwitter et al. (2004) at the position of R.A. and Dec. 07 (J2000) in the spiral galaxy NGC 6946. Klotz et al. (2004) report detection of the SN at magnitude on September 22.983 UT, on September 25.978, and a non-detection on September 22.017 with an lower magnitude limit of . The rapid rise at the time of the first detection is indicative of the rapid luminosity rise near the time of shock breakout (Utrobin, 2007), which is expected to occur about 1 day after the central explosion for a red supergiant progenitor star. We thus agree with the estimate of Li et al. (2005) of an explosion date of September (JD2453270.5). The possible error in the date is of no consequence at the ages of interest here. NGC 6946 is a nearby spiral galaxy (5.5 Mpc, Shapley et al., 2001) that is largely veiled at optical wavelengths by the Milky Way (Galactic longitude , latitude ). As revealed by dust-penetrating near-infrared imaging, the galaxy is nearly face-on ( inclination) and its starlight extends over 12 arcmin in diameter (see Figure 1), or 19 kpc in physical size (Jarrett, 2004; Jarrett et al., 2007). The galaxy is gas-rich, actively forming stars within giant molecular cloud complexes that trace the multiple spiral-arm disk structure; the HI disk extends well beyond the starlight, doubling the size of the galaxy. NGC 6946 is a prolific factory for supernova events. Many supernova remnants (SNRs) have been identified using radio and X-ray telescopes (Lacey & Duric, 2001; Hyman et al., 2000; Schlegel et al., 2000; Blair & Fesen, 1994; Schlegel et al., 1994; Jarrett et al., 2007), and SN 2004et is the eighth historical SN found in NGC 6946. Previous SNe include SN 2002hh (Li et al., 2002) and SN 1980K (Wild, 1980).
Optical spectroscopy of SN 2004et showed it to be a Type II event (Zwitter et al., 2004; Filippenko et al., 2004), and the optical light curve was that of a Type II plateau (IIP) supernova (Li et al., 2005). Sahu et al. (2006) found that 0.06 of 56Ni and of oxygen were ejected in the explosion, implying a progenitor mass of . Li et al. (2005) identified a yellow supergiant progenitor candidate using presupernova optical images, implying a lower progenitor mass of . Radio observations were carried by Stockdale et al. (2004), Beswick et al. (2006), and Argo et al. (2006). Chevalier et al. (2006) modeled the radio light curve, comparing with synchrotron and Compton cooling models. They estimated a mass loss rate of , where is the mass loss rate in units of yr-1, is the wind velocity in units of km s-1, and is the circumstellar temperature in units of K. The Spitzer Infrared Nearby Galaxies Survey (SINGS; Kennicutt et al. 2003; see Figure 1) imaged NGC 6946 after the 2004 supernova event. Using these data, a bright infrared source was reported by Fabbri et al. (2005). Rho et al. (2007) reported the detection of X-rays from a position coincident with the infrared source, likely arising from the SN.
In this paper, we give a more detailed presentation of the X-ray emission from SN 2004et and implications of the X-ray emission for the mass loss density. We discuss the interaction model that is needed to describe the circumstellar interaction with ejecta in Type IIP supernovae.
2 OBSERVATIONS AND RESULTS
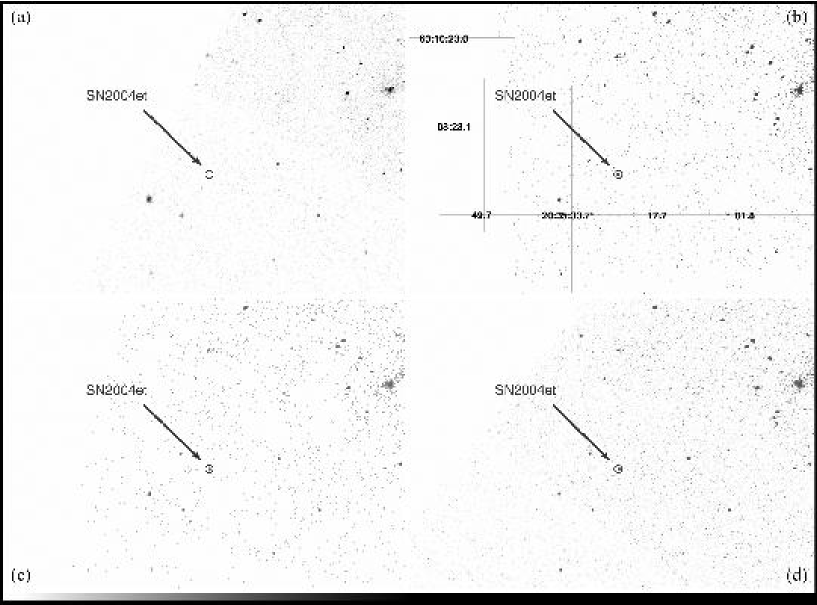
Using archival Chandra data, we serendipitously identified X-ray emission from SN 2004et. There are two Chandra observations of NGC 6946 before the SN 2004et explosion: on 2001 September 7 and 2002 November 25 (Holt et al., 2003). No X-ray source is detected at the position of SN 2004et using these two, pre-explosion observations (see Figure 2). Three Chandra observations (PI: Lewin) of NGC 6946 after the SN 2004et event were carried out using the ACIS-S detector on the Chandra X-ray Observatory. SN 2004et lies in the ACIS-S3 chip.
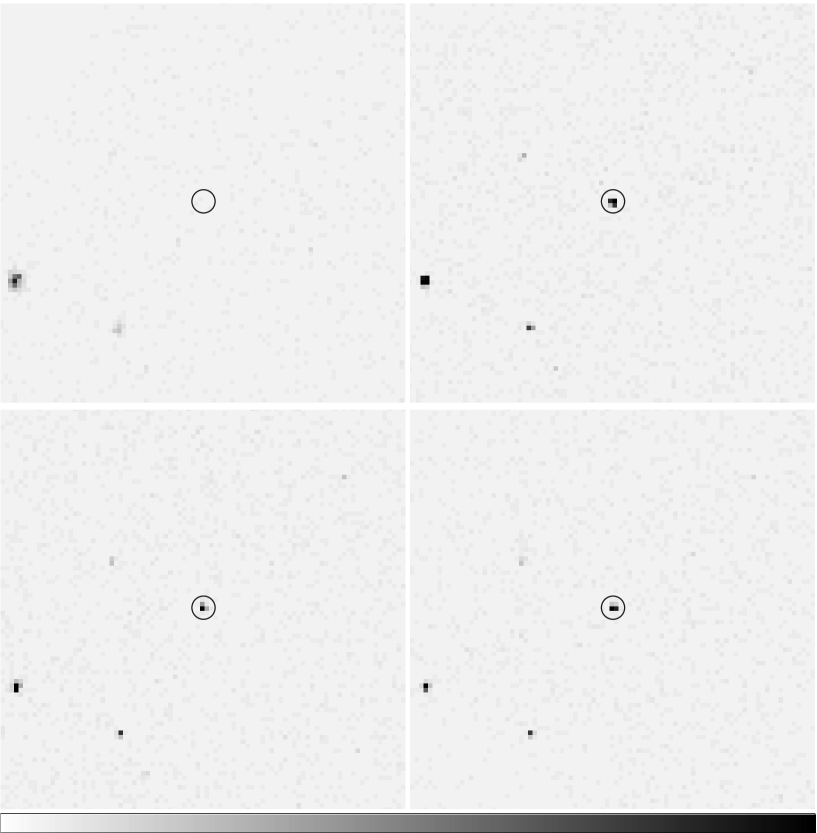
We used all five sets of Chandra observations to study the early evolution of SN 2004et. We cross-correlated the respective positions of the USNO, 2MASS, and the previously published X-ray sources (Holt et al., 2003) with the positions of our X-ray sources. There were a few USNO/2MASS sources that coincided with X-ray sources within 1′′. We found that the results of cross-correlated positions conformed to our observations. An X-ray source appeared at the position of SN 2004et for the three observations taken after the explosion. The position of the X-ray source was found to agree with the optical position to within 0.4′′, consistent within the position uncertainty (1′′) for each of the three epochs. Figure 2 shows Chandra X-ray images of NGC 6946 covering SN 2004et before and after the SN event. Figure 3, the magnified version centered on SN 2004et, shows clear X-ray detection at the position of SN 2004et after the explosion date.
For each epoch, we estimated the source counts using WAVDETECT (in the CIAO111http://cxc.harvard.edu/ciao/ package) with the reprocessed event data cube; this tool performs a Mexican hat wavelet decomposition and reconstruction of the image after accounting for the spatially varying point spread function as described by Freeman et al. (2002). We extracted the counts for SN 2004et using a 2 pixel (2′′) circular aperture, enclosing 90% of the point-spread-function, detecting 202, 151, and 158 photons for the observations on 2004 October 22, 2004 November 6, and 2004 December 3, respectively. These dates correspond to 30, 45, and 72 days after the explosion. In Table 1, we summerized the net counts, count rates and exposure times for three energy bands, keV, keV and keV. Throughout the paper, we constrain our analysis to the energy bands from 0.4 to 8 keV. The X-ray source, SN 2004et, was not resolved in the Chandra image. We estimated a hardness ratio (HR), defined as HR=(HS)/(H+S) where S is the soft band ( keV) and H is the hard band ( keV), ranging from to (see Table 1). The hardness ratios of the three observations indicate that the spectra become softer between 30 and 72 days after the explosion.
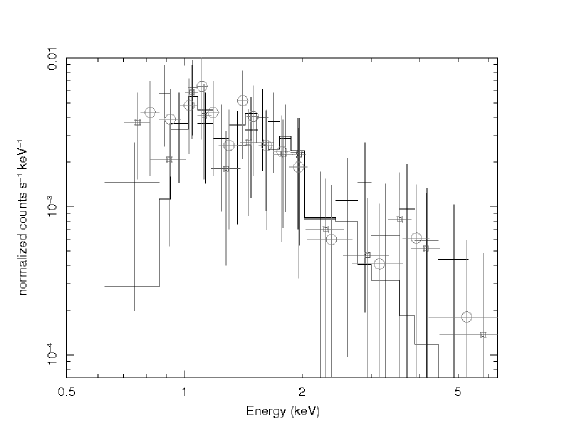
We also extracted spectra using PSEXTRACT in the CIAO package. The relatively low number counts, 200 (2004 October 22 observation), were barely sufficient to obtain a statistically meaningful spectrum. Accordingly we binned the spectra with a minimum count of 10 per bin. The resulting spectrum of the 2004 October 22 observation, in Figure 4, is best fit by a thermal model with a temperature of keV and a line-of-sight absorption of cm-2. All errors associated with the spectral fitting results are within 90% confidence. The column density and temperature confidence contours are also shown in Figure 5. The estimated extinction to the supernova, , is 0.41 mag (Zwitter et al., 2004) using optical lines, implying a foreground atomic hydrogen column density of cm-2 using NH/E(B-V) = 6.81.61021 H atoms cm-2 mag-1 (Gorenstein & Tucker 1976). This extinction is consistent with the lower envelope of our X-ray absorption measurements. The thermal model uses APEC/MEKAL/RS222http://heasarc.gsfc.nasa.gov/ models, which produced almost identical fit parameters to within 2%. The thermal model which includes Ne X (at 1 keV), Mg XII (at 1.35 keV), and Si XIII (at 1.865 keV) lines is consistent with the observed X-ray spectrum, as shown in Figure 4. The line emission indicates that the observed X-ray emission is largely dominated by reverse shock material at lower temperature than that of forward shocked material (see §3 and §4). The inferred unabsorbed X-ray luminosity ( keV) is erg s-1, using a distance of 5.5 Mpc, which falls into the luminosity range of known X-ray SNe (Schlegel et al., 2001; Immler & Lewin, 2003). Similar consistency is found by fitting a bremsstrahlung model to the 2004 October 22 spectrum, yielding an absorbing column density of 0.22 cm-2, and a temperature of 25 keV. The results of spectral fitting are summarized in Table 2.
Figure 6 shows comparisons of the spectra at the three epochs. The spectral fitting was not stable for the second and third observations, due to the diminishing number of X-ray photons, so we were unable to constrain the variation of temperature and absorption by using spectral fitting. Assuming that the spectral parameters were the same as the best-fit parameters of the first observations, and using a thermal model (NH=1.1 cm-2 and kT= 1.3 keV), we estimated fluxes and luminosities of the second and third observations. The corresponding fluxes were 3.0 and 3.4 erg cm-2 s-1, respectively, and the luminosities were 3.3 and 3.6 erg s-1, respectively; note that the errors of fluxes and luminosities were estimated using those of the count rates, and the estimated former errors had lower limits because uncertainties of spectral fitting were not taken account. The respective luminosities and fluxes of the second and third observations were consistent with being the same as those of the first observation.
3 IMPLICATIONS FOR THE WIND DENSITY
In the standard picture for the interaction of SN IIP ejecta with a smooth wind, a double-shock structure forms with the forward shock propagating in the circumstellar (CS) gas and the reverse shock in the SN ejecta (Chevalier, 1982a; Nadyozhin, 1985). For the red supergiant wind expected in a SN IIP, assuming (Chevalier et al., 2006), the reverse shock dominates the X-ray luminosity. In the case of a power law density distribution in the ejecta, , the interaction with the wind in the self-similar regime (Chevalier, 1982b) gives a luminosity of the adiabatic reverse shock at an age
| (1) |
where is assumed, for solar abundances, is Avogadro’s number, is the boundary (highest) ejecta velocity, and is the wind density parameter, while is the dimensionless wind density parameter, where is the mass loss rate in units of yr-1 and is the wind velocity in units of km s-1. The blue edge of H in SN 2004et on day 30 (Sahu et al., 2006) implies km s-1. The temperature at the reverse shock assuming equilibration is (Chevalier, 1982b) and for the assumed parameters is equal to 3.7 keV. The cooling function for this temperature is erg s-1 cm3. To produce the unabsorbed X-ray luminosity of erg s-1 on day 30, one then needs a wind density . The pre-supernova mass loss rate of yr-1 for a wind velocity of 10 km s-1. The wind density is in line with estimates for other Type IIP supernovae, such as SN 1999em (Pooley et al., 2002) and SN 2006bp (Immler et al., 2007).
The temperature of the reverse shock predicted by the self-similar model (3.7 keV) is larger than the 1.3 keV implied by the observed spectrum, although it is within the observational uncertainty. Incomplete temperature equilibration cannot be the reason for this because equilibration is expected for the physical conditions that are present. More plausible is that the velocity of the reverse shock is lower due to a deviation from self-similar evolution. The formation of a boundary shell during the shock breakout stage (Grasberg et al., 1971; Falk & Arnett, 1977; Chevalier, 1981; Utrobin, 2007) causes deviations from a power law density distribution in the outmost layers. The effect is especially important for SNe IIP because of their large progenitor radius and relatively low peak velocities.
The existence of the boundary shell and of the velocity cutoff at is implemented here in a numerical interaction model based on the thin shell approximation (Chevalier, 1982b; Chugai & Chevalier, 2006). The mass of the boundary shell is approximately equal to the mass of the outer envelope () with an extrapolated power law . We take the density distribution to be with and km s-1. The assumed ejecta mass is , which implies a main sequence mass , in general agreement with the observational estimate of the progenitor mass, (Li et al., 2005). The assumed kinetic energy is erg, in line with a model for the Type IIP SN 1999em (Utrobin, 2007).
Two expected effects related to the boundary shell are: (1) non-self-similar early evolution of the shell deceleration that affects the velocity of the reverse shock and its X-ray emission; (2) significant absorption of X-rays in the cool boundary shell at the reverse shock. This contrasts with pure self-similar evolution, in which a radiative shell does not typically form for the winds of interest, and so the absorption of reverse shock emission is small (Chevalier et al., 2006). In the presence of a boundary shell with mass the initial velocity of the reverse shock is about zero once free expansion of the ejecta has been set up because both velocities coincide and are equal to the boundary velocity . As the shell decelerates, the velocity and X-ray luminosity of the reverse shock rapidly increase from zero values (Figure 7). The shell deceleration is surprisingly fast because only a small mass of the swept up wind suffices to reduce the shell velocity by , the value of the velocity jump between ejecta and shell in the self-similar regime. For our model with wind density , km s-1, and mass of the boundary shell , the initial deceleration takes d. This does not mean that the self-similar regime is completely attained at the age . Relatively small deviations of the velocities and from the self-similar values lead to a significant deviation of from its self-similar value. It takes at least or about 50 days for the model of interest to approach the self-similar expansion regime. Computations show that in the model with a boundary shell, remains lower than the self-similar value by during about first 200 days, primarily on account of the lower ejecta velocity compared to the self-similar value.
The calculated X-ray luminosities (absorbed and unabsorbed) of the forward and reverse shocks, the electron temperatures in the shocks, and velocities of the thin shell and highest velocity ejecta are shown in Figure 7 for two values of the wind density parameter, and 2. The unabsorbed luminosity deduced from observations is lower then the unabsorbed luminosity in the interaction model because the procedure of fitting the spectrum and the column density of the absorber assumes a unique parameter . In reality the emergent luminosity is a combination of the radiation of the front and rear sides of the reverse shock and these components differ by the amount of absorption by the SN ejecta. On day 30, the optical depth at 1 keV in the SN ejecta is , while all the remaining components (cool dense shell, CS wind and Galactic absorption) provide only . Evidence for strongly absorbed radiation from the rear side of the reverse shock is seen for keV (Figure 4). The unabsorbed luminosity obtained from X-ray observations thus underestimates the real value by a factor . Considering this, and taking into account the uncertainty of the distance, we conclude that the observed X-ray emission from SN 2004et implies a wind density . The electron temperature of the reverse shock in the model with is very close to the observational estimate (Figure 7), which solves the temperature problem in the self-similar model. In our model, the temperature at the reverse shock front remains fairly constant over the time of interest (Figure 7), but the observed spectrum becomes softer with time because of the decreasing column density through the cool shell. This can be seen in the relative absorbed and unabsorbed luminosities in Figure 7, and may be the reason for the spectral softening seen in the observations.
A further test of the interaction model is provided by the evolution of the boundary velocity of the SN ejecta () and the observed blue edge velocity () of H and H absorption (Figure 7). Generally, at the late photospheric stage, the outer layers of ejecta are considered to have recombined, so one expects that should be significantly lower than . However, it was found recently that ionization and excitation of SN IIP ejecta by X-rays emitted from the reverse shock can produce significant additional excitation of hydrogen in the outer layers so the blue edge velocity in H can be very close to (Chugai et al., 2007). Using the same procedure as in Chugai et al. (2007), we computed the excitation of hydrogen for a model of SN 2004et ejecta with X-ray irradiation effects for and . In both cases, the additional high velocity absorption in H and H turns out to be strong and the blue edge of absorption is only km s-1 lower than the boundary velocity . The lower panel of Figure 7 shows that the model with successfully passes the velocity test and therefore is preferred to the model. For , the interaction model predicts somewhat larger values of . However, given the uncertainty in the choice of the initial velocity cut-off , this test should not be considered as conclusive, although it demonstrates the self-consistency of the model.
4 DISCUSSION
We detect the X-ray emission from SN 2004et using the Chandra X-Ray Observatory data and interpret it in terms of the interaction of ejecta with a presupernova wind characterized by the wind density parameter or yr-1 assuming the wind velocity of 10 km s-1. It should be kept in mind that the derived wind density is model dependent and also suffers from the error in the observed X-ray luminosity. Both result in an uncertainty in the wind density of at least 0.3 dex. Interestingly, the wind density deduced for SN 2004et is a factor of two larger than the wind density for SN 1999em and SN 2004dj with as estimated from optical effects of the ejecta-wind interaction (Chugai et al., 2007). This fact possibly reflects a real difference, because the radio luminosity of SN 2004et is among highest for SNe IIP (Chevalier et al., 2006).
The preferred wind density in SN 2004et () is consistent with the value found from free-free absorption of radio emission (Chevalier et al., 2006), if the assumed temperature of the wind is K. We computed the wind temperature irradiated by the X-rays from the reverse shock in the steady state approximation (barely applicable at the relevant age of d) and found K in the case of . This makes the radio and X-ray properties of the wind in SN 2004et consistent with a wind density parameter . The value of deduced for SN 2004et is consistent with the mass loss rate expected for a progenitor star of its mass, (Figure 1 of Chevalier et al., 2006). We have assumed that SN 2004et had a normal red supergiant progenitor, but Li et al. (2005) found that the progenitor might be a yellow supergiant, with possible similarities to the progenitors of SN 1987A or SN 1993J. However, its radio and X-ray properties are similar to those of other Type IIP supernovae (Chevalier et al., 2006, and references therein) and unlike those of SN 1987A and SN 1993J. Also, the optical light curve of SN 2004et is typical of a SN IIP (Sahu et al., 2006), which would seem to require a red supergiant progenitor. Moreover, as noted above, the wind density around SN 2004et is relatively large for a SN IIP. Yet for the same stellar mass a yellow supergiant is expected to have a similar mass loss rate but a larger wind velocity, and, therefore, a lower wind density compared to the red supergiant, in contrast with the estimated wind density in SN 2004et. This additionally argues in favor of the identification of the SN 2004et progenitor with a red supergiant. We conjecture that the ground-based observations of the progenitor combine the emission from a red supergiant with emission from an earlier type star or stars.
References
- Argo et al. (2006) Argo, M., Beswick, R., Muxlow, T., Pedlar, A., Fenech, D., & Thrall, H. 2005, Mem. Soc. Astron. Italiana, 76, 565
- Beswick et al. (2006) Beswick, R. J., Muxlow, T. W. B., Argo, M. K., Pedlar, A., Marcaide, J. M., & Wills, K. A. 2005, ApJ, 623, L21
- Blair & Fesen (1994) Blair, W. P., & Fesen, R. A. 1994, ApJ, 424, 103
- Chevalier (1981) Chevalier, R. A. 1981, Fund. of Cosmic Phys., 7, 1
- Chevalier (1982a) Chevalier, R. A. 1982a, ApJ, 258, 790
- Chevalier (1982b) Chevalier, R. A. 1982b, ApJ, 259, 302
- Chevalier et al. (2006) Chevalier, R. A., Fransson, C., & Nymark, T. K. 2006, ApJ, 641, 1029
- Chugai & Chevalier (2006) Chugai, N. N., & Chevalier, R. A. 2006, ApJ, 641, 1051
- Chugai et al. (2007) Chugai, N. N., Chevalier, R. A., & Utrobin, V.P. 2007, ApJ, in press (astro-ph/0703468)
- Fabbri et al. (2005) Fabbri, J., Sugerman, B., & Barlow, M., 2005, IAU Circ., 8489
- Falk & Arnett (1977) Falk, S. F., & Arnett, W. D. 1977, ApJS, 33, 515
- Filippenko et al. (2004) Filippenko, A. V., Foley, R. J., Treu, T., & Malkan, M.A. 2004, IAU Circ, 8414
- Freeman et al. (2002) Freeman, P. E., Kashyap, V., Rosner, R., & Lamb, D. Q. 2002, ApJS, 138, 185
- Gorenstein & Tucker (1976) Gorenstein, P., & Tucker, W. H. 1976, ARA&A, 14, 373
- Grasberg et al. (1971) Grasberg, E. K., Imshennik, V. S., & Nadyozhin, D. K. 1971, Ap&SS, 10, 28
- Holt et al. (2003) Holt, S. S., Schlegel, E. M., Hwang, U., & Petre, R. 2003, ApJ, 588, 792
- Hyman et al. (2000) Hyman, S. D., Lacey, C. K., Weiler, K. W., & Van Dyk, S. D. 2000, AJ, 119, 1711
- Immler & Lewin (2003) Immler, S., & Lewin, W. H. G. 2003 Supernovae and Gamma-Ray Bursts, edited by K. W. Weiler (Springer-Verlag)
- Immler et al. (2007) Immler, S., et al. 2007, ApJ, in press (astro-ph/0703765)
- Jarrett (2004) Jarrett, T., 2004, PASA, 21, 396
- Jarrett et al. (2007) Jarrett, T., et al. 2007, in preparation
- Kennicutt et al. (2003) Kennicutt, R.C., et al. 2003, PASP, 115, 928
- Klotz et al. (2004) Klotz, A., Pollas, C. & Boer, M., 2004, IAU Circ. 8413, 2
- Lacey & Duric (2001) Lacey, C. K., & Duric, N. 2001, ApJ, 560, 719
- Li et al. (2002) Li, W., 2002, IAU circular, IAU 8005
- Li et al. (2005) Li, W., van Dyk, S., Fillippenko, V., & Cuillandre, J.-C. 2005, PASP, 117, 121
- Nadyozhin (1985) Nadyozhin, D. K. 1985, ApSS, 112, 225
- Pooley et al. (2002) Pooley, D., et al. 2002, ApJ, 572, 932
- Rho et al. (2007) Rho, J., Jarrett, T. H., & Chevalier, R. 2007, IAU Circ., 8799, 2
- Sahu et al. (2006) Sahu, D. K., Anupama, G. C., Srividya, S., & Muneer S. 2006, MNRAS, 372, 1315
- Schlegel et al. (1994) Schlegel, E. M., et al. 1994, ApJ, 424, 95
- Schlegel et al. (2000) Schlegel, E. M., Blair, W. P., & Fesen R. A. 2000, AJ, 120, 791
- Schlegel et al. (2001) Schlegel, E. M, 2001, ApJ, 556, L25
- Shapley et al. (2001) Shapley, A., Fabbiano, G., & Eskridge, P. B. 2001, ApJS, 137, 139
- Stockdale et al. (2004) Stockdale, C. J., Kaster, B., Weiler, K. W., Van Dyk, S. D., Sramek, R. A., & Panagia, N. 2004a, SN 2004et Data Table (Washington: NRL), http://rsd-www.nrl.navy.mil/7213/weiler/kwdata/04etdata.asc
- Utrobin (2007) Utrobin, V. P. 2007, A&A, 461, 233
- Utrobin & Chugai (2002) Utrobin, V. P., & Chugai, N. N. 2002, Astron. Lett., 28, 386
- Wild (1980) Wild, P., 1980, IAU circular, No. 3532
- Zwitter et al. (2004) Zwitter, T., Munari, U., & Moretti, S. 2004, IAU Circ., 8413, 1
| date | OBSIDa | net counts | snrb | exposure | hard countsc | soft countsc | HRc |
|---|---|---|---|---|---|---|---|
| (daysd) | time (ks) | ||||||
| 2004 October 22 (30) | 4631 | 201.816.7 | 12.8 | 29.7 | 133.511.5 | 82.49.11 | 0.070(38%) |
| 2004 November 06 (45) | 4632 | 150.714.6 | 10.3 | 28.0 | 105.610.3 | 53.57.3 | 0.084(34%) |
| 2004 December 03 (72) | 4633 | 158.314.7 | 10.8 | 26.6 | 121.611.0 | 45.66.8 | 0.085(27%) |
| Model | NH | kT | Z/Z⊙ | fxb | Lxc | |
|---|---|---|---|---|---|---|
| (1022cm-2) | (keV) | (erg cm-2 s-1) | (erg s-1) | |||
| thermal | 0.4c | 1.1(2.1) | 1.3 (0.4) | 1 | 2.9 | 3.8 |
| thermal | 0.18 | 0.3 | 8.9(1.5) | 1 | 7.1(4.3) | 3.2(2.4) |
| thermald | 0.2 | 0.23 (1.3) | 22 (0) | 0.2 | 6.6 | 2.8 |
| bremstrahlung | 0.18 | 0.22 (1) | 25 (0.5) | – | 7.5 | 3.3 |