Single quantum dot spectroscopy using a fiber taper waveguide near-field optic
Abstract
Photoluminescence spectroscopy of single InAs quantum dots at cryogenic temperatures ( 14 K) is performed using a micron-scale optical fiber taper waveguide as a near-field optic. The measured collection efficiency of quantum dot spontaneous emission into the fundamental guided mode of the fiber taper is estimated at , and spatially-resolved measurements with 600 nm resolution are obtained by varying the taper position with respect to the sample and using the fiber taper for both the pump and collection channels.
pacs:
42.70.Qs, 42.55.Sa, 42.60.Da, 42.55.PxSemiconductor quantum dots (QDs) have drawn significant recent interest due to their potential to create novel optoelectronic devices such as those that can generate single photons on demand Michler et al. (2000). Methods to optically interrogate single QDs include physical isolation via microfabricated mesas Marzin et al. (1994) and diffraction-limited confocal optical microscopy Dekel et al. (1998). Despite the technical challenges involved in developing tools for use at cryogenic temperatures (a prerequisite for most single QD studies), solid immersion lenses Wu et al. (1999) have been implemented to improve the efficiency of light collection, while near-field scanning optical microscopy (NSOM) has been used to achieve sub-100 nm spatial resolution Toda and Arakawa (2000). In this paper, we examine the use of optical fiber taper waveguides as a near-field optic for performing single QD spectroscopy. These micron-scale silica waveguides have been used in many studies of optical microcavities, beginning as an efficient coupler to silica microspheres Knight et al. (1997). More recently, we have shown that they can effectively probe the spatial and spectral properties of small mode volume (), high refractive index semiconductor cavities such as planar photonic crystals and microdisks Srinivasan et al. (2004). Other researchers have proposedKlimov and Ducloy (2004); Kien et al. (2005) and realized their use as a collection tool for spontaneous emission from atomic vapors Nayak et al. (2007). Here, we show that a fiber taper may be used to channel emission from single self-assembled QDs embedded in a semiconductor slab directly into a standard single-mode fiber with high efficiency (), and to provide sub-micron spatial resolution of QDs, either through taper positioning or resonant pumping of the optical modes of etched microdisk structures.
The QDs we study consist of a single layer of InAs QDs embedded in an In0.15Ga0.85As quantum well, a so-called dot-in-a-well (DWELL) structureLiu et al. (2000). The DWELL layer is grown in the center of a GaAs waveguide (total waveguide thickness of 256 nm), which sits atop a 1.5 m thick Al0.7Ga0.3As buffer layer. The resulting peak of the ground state emission of the ensemble of QDs is located at m at room temperature. To limit the number of optically pumped QDs, microdisk cavities of diameter m were fabricated using electron beam lithography and a series of dry and wet etching steps Srinivasan et al. (2005). Although the QDs physically reside in a microcavity, they are non-resonant with the cavity whispering gallery modes (WGMs). In other words, our primary interest here is general single QD spectroscopy through the fiber taper, without enhancement through interaction with the high quality factor () microdisk WGMs. The samples were mounted in a continuous-flow liquid He cryostat that has been modified to allow sample probing with optical fiber tapers while being held at cryogenic temperatures (T K), as described in detail in ref. [Srinivasan and Painter, 2007]. The cryostat is part of a microphotoluminescence setup that provides any combination of free-space and fiber taper pumping and collection; see Fig. 1(a) for details.
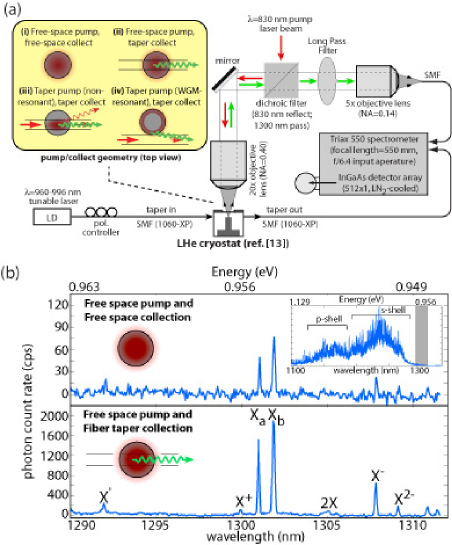
The inset of Fig. 1(b) shows the emission spectrum from an ensemble of QDs in one of the microdisks. Here, the device is optically pumped through an objective lens at normal incidence (free-space pumping), with a spot size of m and wavelength nm. Clearly present are the ground and excited states ( and shells) of the ensemble of QDs which, based on the estimated QD density of 300-500 m-2, consists of QDs. To study isolated emission lines from single QDs, we focus on the long-wavelength tail end of the QD distribution (- nm). In this range, isolated emission lines from a single QD are seen for a fraction () of the interrogated devices. A typical spectrum as collected through the pump lens (free-space collection) from one such device is shown in the top panel of Fig. 1(b). Under identical pumping conditions, the signal collected through a fiber taper waveguide positioned on top of, and in contact with, the microdisk is shown in the bottom panel of Fig. 1(b). The taper is a single mode optical fiber that has been heated and stretched down to a minimum radius of nm, and is installed in the customized liquid He cryostat as detailed in ref. [Srinivasan and Painter, 2007]. The most stark difference between the free-space and fiber taper collected spectra is the increase in fiber taper collected power. Similar improvement in collection efficiency was measured over all the QDs studied in this work.
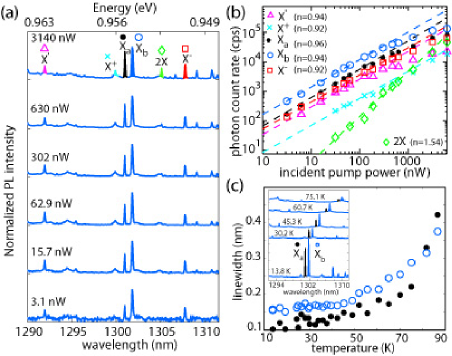
Before further studying the fiber taper as a collection optic, we attempt to identify the different QD lines of Fig. 1(b). Of particular benefit in this assignment is the recent work of Cade, et al. Cade et al. (2005), who study a DWELL material very similar to that investigated here. In Fig. 2(a), we show taper-collected emission spectra as a function of pump power (free-space, nm) for a fixed taper position. Emission is first seen for incident powers of a few nW (estimated absorbed powers of tens of pW), with excitonic lines centered at nm, nm, nm, and nm. As we discuss later, spatially-resolved measurements clearly indicate that the shortest wavelength emission line is unrelated to the latter three, which we identify as the polarization-split exciton lines ( and ) Cade et al. (2005); Bayer et al. (2002) and the negatively charged exciton line (). As the pump power is increased, additional emission lines appear, including the positively charged exciton () at nm and the bi-exciton () line at nm. The -, -, and - splitting values of , , and meV match reasonably well with the , , and meV values measured in Ref. [Cade et al., 2005], although the fine structure splitting in the line is significantly larger ( vs. eV) for this QD. In Fig. 2(b), we plot the emission level in each QD state against pump power. Below saturation, the emission lines all scale nearly linearly with pump power, except for the line which scales superlinearly, although more slowly than expected ( as opposed to ). Previous studies of - m QDs have also measured a sub-quadratic pump-power-dependence for the line Cade et al. (2005); Alloing et al. (2005),although usually in conjunction with a sub-linear dependence of the line. Finally, the temperature (T) dependence of the lines is shown in Fig. 2(c), where significant broadening is seen for T K. Below this temperature we measure linewidths of - nm, roughly corresponding to the spectral resolution of our system ( nm eV).
A rough estimate of the absolute collection efficiency of the fiber taper is derived by considering the saturated photon count rates for the lines in Fig. 2(b). The measured saturated photon count rate into the line is counts per second (cps), which after considering the spectrometer grating efficiency (), the detector array quantum efficiency (), and including the light in the backwards fiber channel, corresponds to a count rate of cps. Taking into account the transmission effiency of the fiber taper ( for a QD centrally located along the tapered region of the fiber), the taper-collected photon count rate rises to cps. Neglecting possible suppression or enhancement of radiation due to the presence of the microdisk (a good approximation for QDs located above the disk’s central pedestal), the saturated photon emission rate for InAs QDs is - cps (photon lifetime - nsMichler et al. (2000)). This yields an approximate fiber taper collection efficiency of . It is important to note that this efficiency is for non-resonant collection, and does not correspond to that attainable for QDs resonant with a high- microdisk WGM, which one would expect to be much higher due to the Purcell-enhanced emission into a localized cavity modeMichler et al. (2000) and the efficient taper-WGM couplingSrinivasan et al. (2005).
Obtaining a theoretical value for the non-resonant fiber taper collection efficiency is hindered by the complex geometry in which the QD is embedded; however, a coarse estimate can be made by comparison to refs. [Klimov and Ducloy, 2004; Kien et al., 2005]. In these works, a spontaneous emission collection efficiency of - is estimated for a dipole emitter on the surface of a silica fiber taper of radius ( is the free-space wavenumber). For our larger fiber taper (), and for a QD nm away from its surface (corresponding to the middle of the GaAs slab), the theoretical collection efficiency is on the order of . Beyond providing an upper bound on the collection efficiency (due to the high-index GaAs slab and AlGaAs substrate of the measured devices), the model indicates that we are far from the optimum fiber taper diameter. Comparison with ref. [Kien et al., 2005] indicates that an order of magnitude increase in the collection efficiency may be obtained by decreasing the fiber taper radius to nm, an experimentally realizable value.
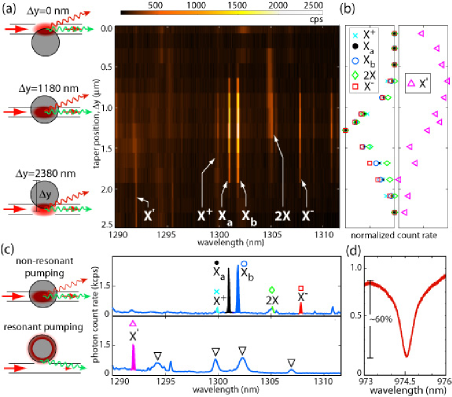
An additional benefit of using the fiber taper as a near-field collection optic is the potential for spatially-resolved measurements. Although the spatial resolution provided by a glass fiber taper Srinivasan et al. (2004) is lower than the sub-100 nm level achievable through NSOM Toda and Arakawa (2000), valuable information on the spatial location of QDs can be inferred from both the spatially-dependent collection and excitation through the fiber taper. For the following measurements, we pump the microdisk through the fiber taper (instead of from free-space), with nm, where only the DWELL is significantly absorbing. Figure 3(a) shows a plot of the fiber-collected emission spectrum as a function of taper position along the -axis of the sample (the taper position is adjusted through a piezo stage on which it is mounted). Figure 3(b) plots the spatial dependence of the total photon count rate within each of the QD states identified in Fig. 2. Of note is the similar spatial dependence of the collected emission from each of the lines , confirming that they originate from the same single QD. The full-width at half-maximum of the collected emission is roughly 600 nm, giving an estimate of the taper’s spatial resolution transverse to its longitudinal axis. Two-dimensional mapping of a QD’s position may also be obtained by rotating the sample, and repeating the measurement along the orthogonal axis as was done in ref. [Srinivasan et al., 2004] for the mapping of the modes of photonic crystal cavities. Finally, in contrast to the other emission lines, emission from the short wavelength line at nm has a quite different dependence on taper position, with collected emission being strongest for the taper at the disk periphery.
Spatial selection of QDs may also be realized by resonantly pumping a microdisk WGM. This excites QDs located in a 250 nm thick annulus at the microdisk perimeter, where the pump beam resides, and efficient taper-WGM coupling allows for an accurate estimate of the absorbed pump power. The QDs located at the disk periphery are of course those that are of interest for cavity QED studies involving high-, ultrasmall WGMs. Figure 3(d) shows a transmission scan of a pump-band WGM with a coupling depth of and 1000 (limited by DWELL absorption). By pumping on resonance at nm, we reduce the power needed to achieve a given signal by - orders of magnitude relative to non-resonant pumping. The bottom scan of Fig. 3(c) shows the emission spectrum when we pump on resonance with 690 pW of power at the taper input (corresponding to pW of dropped/absorbed power). Emission from the centrally located QD (top scan of Fig. 3(c)) is no longer present, and has been replaced by a pronounced emission peak at nm, corresponding to the line, confirming that this emission is likely due to a QD located in the disk periphery. Another difference in comparison to the non-resonant pumping spectrum is the presence of several broad emission peaks. These peaks are due to emission into relatively low-, higher-radial-order WGMs of the microdisk, as confirmed by fiber-taper-based transmission spectroscopy of the cavity with a tunable laser Srinivasan et al. (2005). The source of such background emission into detuned cavity modes is not well understood, but has been observed to occur for even large detunings of - nm Hennnessy et al. (2007). In this case, it is likely that the preferential excitation of QDs that reside in the microdisk perimeter, even those that have exciton lines which are significantly detuned spectrally, results in enhanced emission into the microdisk WGMs.
In summary, we have shown that a micron-scale optical fiber taper waveguide, previously demonstrated to be an effective tool for characterization of semiconductor microcavities, can also be used to study single semiconductor quantum dots. As a near-field collection optic, the fiber taper is shown to channel quantum dot light emission directly into a single mode fiber with a high efficiency of , and to provide a sub-micron spatial resolution of QDs. The ability to effectively investigate both microcavities and quantum dots suggests that these fiber tapers can serve as a very versatile tool for studying microphotonic structures, and in particular, for investigations of chip-based cavity QED.
References
- Michler et al. (2000) P. Michler, A. Kiraz, C. Becher, W. V. Schoenfeld, P. M. Petroff, L. Zhang, E. Hu, and A. Imamoglu, Science 290, 2282 (2000).
- Marzin et al. (1994) J. Y. Marzin, J. M. Gérard, A. Izraël, D. Barrier, and G. Bastard, Phys. Rev. Lett. 73, 716 (1994).
- Dekel et al. (1998) E. Dekel, D. Gershoni, E. Ehrenfreund, D. Spektor, J. M. Garcia, and P. M. Petroff, Phys. Rev. Lett. 80, 4991 (1998).
- Wu et al. (1999) Q. Wu, R. D. Grober, D. Gammon, and D. S. Katzer, Phys. Rev. Lett. 83, 2652 (1999).
- Toda and Arakawa (2000) Y. Toda and Y. Arakawa, IEEE J. Sel. Top. Quan. Elec. 6, 528 (2000).
- Knight et al. (1997) J. C. Knight, G. Cheung, F. Jacques, and T. A. Birks, Opt. Lett. 22, 1129 (1997).
- Srinivasan et al. (2004) K. Srinivasan, P. E. Barclay, M. Borselli, and O. Painter, Phys. Rev. B 70, 081306R (2004).
- Klimov and Ducloy (2004) V. V. Klimov and M. Ducloy, Phys. Rev. A 69, 013812 (2004).
- Kien et al. (2005) F. L. Kien, S. D. Gupta, V. I. Balykin, and K. Hakuta, Phys. Rev. A 72, 032509 (2005).
- Nayak et al. (2007) K. Nayak, P. Melentiev, M. Morinaga, F. Kien, V. Balykin, and K. Hakuta, Opt. Express 15, 5431 (2007).
- Liu et al. (2000) G. T. Liu, A. Stintz, H. Li, T. C. Newell, A. L. Gray, P. M. Varangis, K. J. Malloy, and L. F. Lester, IEEE J. Quan. Elec. 36, 1272 (2000).
- Srinivasan et al. (2005) K. Srinivasan, M. Borselli, T. J. Johnson, P. E. Barclay, O. Painter, A. Stintz, and S. Krishna, Appl. Phys. Lett. 86, 151106 (2005).
- Srinivasan and Painter (2007) K. Srinivasan and O. Painter, Appl. Phys. Lett. 90, 031114 (2007).
- Cade et al. (2005) N. I. Cade, H. Gotoh, H. Kamada, T. Tawara, T. Sogawa, H. Nakano, and H. Okamoto, Appl. Phys. Lett. 87, 172101 (2005).
- Bayer et al. (2002) M. Bayer, G. Ortner, O. Stern, A. Kuther, A. A. Gorbunov, A. Forchel, P. Hawrylak, S. Fafard, K. Hinzer, T. L. Reinecke, et al., Phys. Rev. B 65, 195315 (2002).
- Alloing et al. (2005) B. Alloing, C. Zinoni, V. Zwiller, L. H. Li, C. Monat, M. Gobet, G. Buchs, A. Fiore, E. Pelucchi, and E. Kapon, Appl. Phys. Lett. 86, 101908 (2005).
- Hennnessy et al. (2007) K. Hennnessy, A. Badolato, M. Winger, D. Gerace, M. Atature, S. Guide, S. Falt, E. Hu, and A. Imamoglu, Nature (London) 445, 896 (2007).