Arrhenius Laboratory, Stockholm University, SE-10691 Stockholm
Brno University of Technology, Technicka 2896/2, 616 69 Brno, Czech Republic
Grenoble High Magnetic Field Lab, CNRS, 25, avenue des Martyrs, Grenoble Cedex 9, France
Magnetomechanical and magnetoelectric effects, magnetostriction Infrared and Raman spectra Phonons in crystal lattices Dielectric properties of solids and liquids
Magnetodielectric effect and optic soft mode behaviour in quantum paraelectric EuTiO3 ceramics
Abstract
Infrared reflectivity and time-domain terahertz transmission spectra of EuTiO3 ceramics revealed a polar optic phonon at 6 - 300 K whose softening is fully responsible for the recently observed quantum paraelectric behaviour. Even if our EuTiO3 ceramics show lower permittivity than the single crystal due to a reduced density and/or small amount of secondary pyrochlore Eu2Ti2O7 phase, we confirmed the magnetic field dependence of the permittivity, also slightly smaller than in single crystal. Attempt to reveal the soft phonon dependence at 1.8 K on the magnetic field up to 13 T remained below the accuracy of our infrared reflectivity experiment.
pacs:
75.80.+qpacs:
78.30.-jpacs:
63.20.-epacs:
77.22.-dMultiferroics exhibiting simultaneously ferroelectric and ferro- or antiferromagnetic order are known since the beginning of the 1960’s, but the interest to these materials underwent a revival after the pioneering work by Wang et al.[1] who in the BiFeO3 thin films revealed spontaneous polarization and magnetization almost by an order of magnitude higher compared to the bulk samples. Recently, much attention have been paid to the multiferroic materials not only because of their rich and fascinating fundamental physics (questions why only few materials with simultaneous ferroelectric and magnetic order are known, how to explain the coupling of magnetic and ferroelectric order etc.), but also because of the promising potential applications in multiple-state memory elements.[2, 3] In magnetoelectrics the polarization can be controlled by the magnetic field as well as the magnetization by the electric field and so magnetic field tuning of the dielectric permittivity ’ (magnetodielectric effect) is expected. Recently, gigantic proper magnetodielectric effect has been observed e. g. in TbMnO3[4] and EuTiO3.[5] Large magnetodielectric effect was recently seen also in BiFeO3[6], however in this case the change of ’ with magnetic field is not due to coupling of the polarization and magnetization, but due to combination of inhomogeneous magnetoresistance and Maxwell-Wagner effect.[6]
The perovskite EuTiO3 is not a typical multiferroic. It exhibits an antiferromagnetic (AFM) structure below = 5.3 K,[7] but the ferroelectric order does not take place because the quantum fluctuations prevent the freezing of polarization at low temperatures. Its permittivity increases on cooling similarly to classical quantum paraelectrics[9, 10] (incipient ferroelectrics) SrTiO3, KTaO3, etc., but it saturates below 30 K and sharply drops down at .[5] Magnetic structure of EuTiO3 was investigated already forty years ago[7] and determined in Ref. [8]. A neutron-diffraction study of a powder sample revealed the G type AFM structure.[7] In this magnetic arrangement, there are two interpenetrating sublattices in which a given Eu2+ has six nearest-neighbor Eu2+ with antiparallel spins and 12 next-nearest-neighbor Eu2+ with parallel spins. At 1.3 K the magnetic moment increases linearly with magnetic field up to 1 T and above 1.4 T the moment saturates at 156 emu/g (6.93 ).[7]
The low-temperature ’ below exhibits a huge dependence on the magnetic field , giving evidence about a large interaction of magnetic moments with the crystal lattice.[5] ’ strongly increases even for low and the drop down in ’ seen near at 0 T disappears at fields above 1 T so that only quantum paraelectric behaviour is seen at high magnetic fields down to 2 K. Katsufuji and Takagi[5] suggested that the temperature dependence of ’ above is due to a soft optic phonon reducing its frequency on cooling and the decrease in ’ below occurs due to the strong coupling of localized spins in the levels of Eu2+ with the soft phonon, which causes its hardening below . The transverse-field Ising model and Heisenberg model were successfully applied for explaining the dielectric and magnetic properties of EuTiO3 and Eu1-xBaxTiO3 with and without external magnetic and electric fields.[11, 12, 13, 14, 15] Jiang and Wu[11] calculated the soft mode frequency and obtained 8 at 20 K. Fennie and Rabe[16] calculated the soft mode frequency in the AFM phase from the first principles and obtained 77. They also predicted a remarkable softening of the soft mode and transition into the ferroelectric phase in biaxially strained samples. The strain can be realized in thin films deposited on substrates with slightly mismatched lattice parameters.[16] In such a phase the giant magnetodielectric effect is expected.
The polar soft mode is infrared (IR) active so that the IR spectroscopy is the best tool for the verification of the predicted phonon softening on cooling. In this letter we will show that the soft mode really exhibits the expected softening (from 112 at 300 K to 82 at 6K), in perfect agreement with the predictions from the first-principles calculations.[16]
EuTiO3 ceramics was synthesized from the Eu2O3 and Ti2O3 powders using mechanochemical activation in the planetary micromill Fritsch Pulverisette 7. Powder XRD showed strong amorphization - no diffraction line of Eu2O3 were found but significantly widened peaks of the Ti2O3 and of some unidentified phases. The powder was pressed into pellet in a uniaxial press at 650 MPa (or in an isostatic press at 300 MPa) at room temperature and then annealed at 1500C in Ar + 10% H2 atmosphere. The reducing atmosphere is necessary to prevent the formation of pyrochlore EuTiO7. The powder XRD showed sharp diffraction lines corresponding to single-phase cubic perovskite EuTiO3. No other phase was detected, but the porosity of resulting ceramics was relatively high - 20-30%. Therefore we used an additional sample processing: The EuTiO3 pellet was ground and milled again to a fine nanopowder which was sintered by spark plasma sintering (temperature 1150-1200C, pressure 75-100 MPa, time 3-5 min). The resulting ceramic samples were more than 91% dense and contained 5% or in one case even 15% of the secondary pyrochlore phase.
The magnetodielectric effect was studied by measuring the changes in permittivity with the magnetic fields up to 14 T (PPMS, Quantum design) at temperatures 2-300 K. The measurements were performed at frequency 1 kHz with ultra-precision capacitance bridge Andeen-Hagerling 2500A. Details of the dielectric, THz and IR experiments performed without magnetic field are described elsewhere.[6] The IR reflectivity spectra were taken as well at magnetic fields up to 13 T at 1.8 K using a Fourier transform IR spectrometer Bruker IFS 113v. For reduction of the high noise we measured 2000 scans with resolution of 6, while the IR spectra in non-magnetic cryostat were taken with resolution of 2 at only 128 scans.
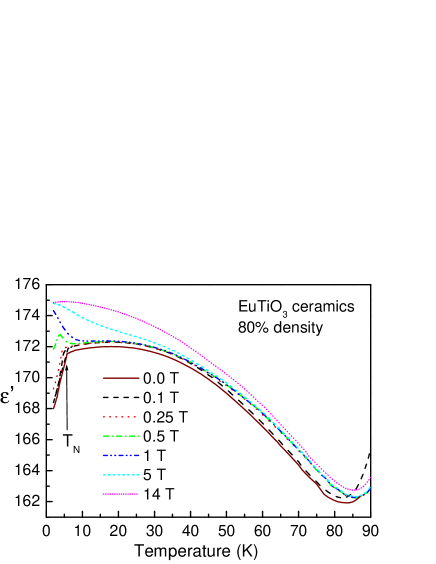
Temperature dependence of ’ below 90 K measured at various magnetic fields is plotted in Fig. 1. At higher temperature the sample becomes slightly conducting,[17] therefore ’ increases to huge values (not shown in Fig. 1) due to Maxwell-Wagner polarization mechanism. Below 85 K, one can see an increase in intrinsic permittivity on cooling and its saturation below 25 K due to quantum fluctuations. The shape of the ’() curve down to 6 K is the same as in classical quantum paraelectric SrTiO3,[9] but with much lower value. Sharp drop appears in ’() below AFM phase transition at =5.3 K, although the sample remains paraelectric. At high magnetic fields above 1 T the AFM phase transforms to the ferromagnetic one, drop down in ’() disappears and a pure incipient ferroelectric behaviour, i.e. continuous increase of ’(T) on cooling is seen. We note that the same temperature and magnetic field dependences of ’ were observed independently on orientation of magnetic B and measuring electric E fields (i.e. both geometries and gave the same ’() results as in Fig. 1). Similar ’() was observed by Katsufuji and Takagi on EuTiO3 single crystal, but the value of permittivity was more than twice higher compared with our values obtained on the ceramics of 80% density. This discrepancy could be due to the porosity which may cause a 50% decrease in the permittivity.[18]
’ decreases with the AFM ordering of Eu spins whereas it increases with their ferromagnetic arrangement under magnetic field. Therefore Katsufuji and Takagi suggested that the ’(B) is dominated by the pair correlation of the Eu neighbouring spins and successfully fitted the experimental ’() data by the formula
| (1) |
where () is the dielectric constant in the absence of a spin correlation and is the coupling constant between correlated spins and permittivity. The same authors also suggested that the value of static permittivity is only due to contributions of polar optic phonons and the temperature dependence of is caused by softening of one of the phonons, similarly as in SrTiO3. Our radio-frequency dielectric measurements without magnetic field really did not reveal any frequency dispersion in and only negligible dielectric losses between 100 Hz and 1 MHz.
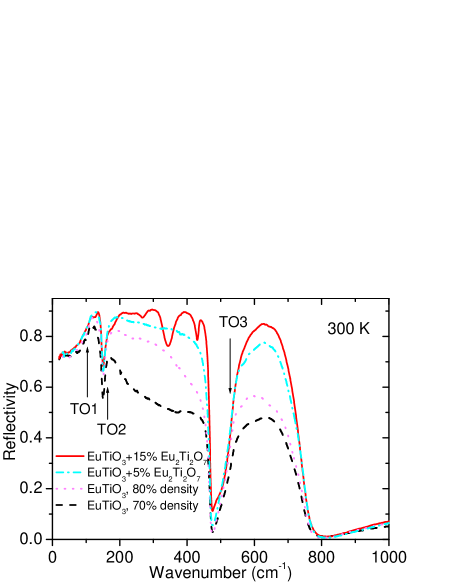
For confirmation of the anomalous polar phonon we performed THz transmission and IR reflectivity measurements between 6 and 300 K. IR spectra show strong dependence on the density of the ceramics as well as on the amount of pyrochlore Eu2Ti2O7 secondary phase (see Fig. 2). Low-dense pure perovskite ceramics shows a large diffuse scattering, which rises with increasing frequency and deteriorates the IR reflectivity. 93.6% dense EuTiO3 ceramics with 15% of Eu2Ti2O7 secondary phase exhibits no diffuse scattering but additional reflection bands between 100 and 450, corresponding to polar phonons of the pyrochlore phase, while in the perovskite cubic phase only 3 IR active phonons are allowed. As an optimal compromise we decided to present here the low-temperature spectra of the sample with 5% of pyrochlore phase (91% density) which exhibits only weak diffuse scattering and the bands from pyrochlore phase are also very weak (see Figs. 2 and 3 ).
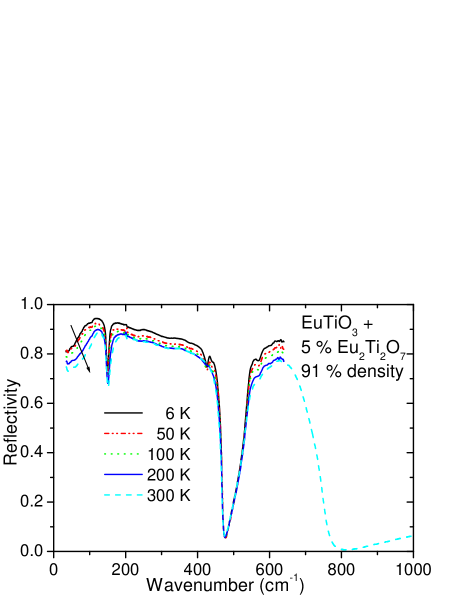
Fig. 3 shows corresponding IR reflectivity spectra at selected temperatures. One can see an increase of reflectivity on cooling due to the reduced phonon damping at low temperatures, as well as the shift of the first reflection band (i.e. the soft mode) to lower frequencies on reducing temperature. Complex permittivity ∗( is related to the reflectivity R() by
| (2) |
For the fit of the IR and THz spectra we used a generalized-oscillator model with the factorized form of the complex permittivity:[19]
| (3) |
where and denotes the transverse and longitudinal frequency of the j-th polar phonon, respectively, and TOj and LOj denotes their corresponding damping constants. The high-frequency permittivity resulting from the electron absorption processes was obtained from the room-temperature frequency-independent reflectivity tail above the phonon frequencies and was assumed temperature independent.
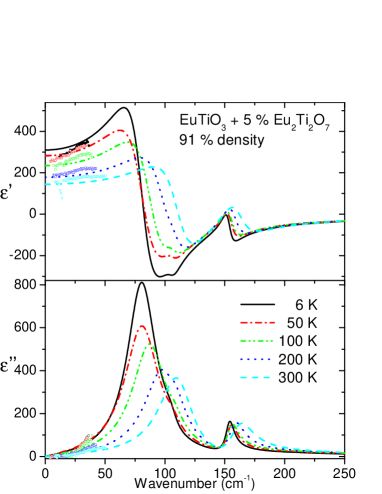
Real and imaginary parts of () obtained from the fits to IR reflectivity are shown together with the experimental THz spectra in Fig. 4. The maxima in () correspond roughly to the phonon eigen-frequencies. One can clearly see the increase in static permittivity on cooling (zero frequency values in Fig. 4a) due to the phonon softening.
It is worth to note that for the fits we used the factorized form of (Eq. (3)) instead of more frequently used classical damped harmonic oscillators model[19]
| (4) |
where dielectric strength means the contribution of the j-th mode to the static permittivity and the rest of the parameters in Eq. (4) has the same meaning as in Eq. 3. The Eq. 3 is more suitable than Eq. (4) for the fits of IR reflectivity spectra of EuTiO3, because it exhibits large TO-LO splitting, which cannot be well fitted with Eq. (4). Dielectric strength can be obtained from the formula[19]
| (5) |
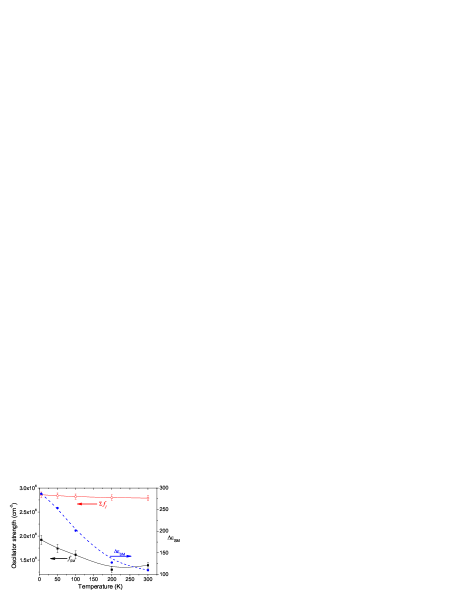
It follows from very general summation rules[20] that the sum of all oscillator strengths is temperature independent (i.e. ). In the case of uncoupled phonons even each oscillator strength should remain temperature independent (i.e. ). It means that each decrease of phonon frequency should be accompanied by increase of dielectric strength . Fig. 5 shows that the dielectric strength of the lowest frequency mode (i.e. the soft mode) remarkably increases on cooling. However, the oscillator strength of the soft mode increases on cooling as well, which gives evidence about the coupling of the soft mode with other higher-frequency modes. It means that the soft modes receives some part of its dielectric strength from higher-frequency modes, predominantly from second perovskite (TO2) phonon (see in Fig. 4 the shift of second peak in with temperature). Simultaneously, the Fig. 5 shows that the sum rule of oscillator strengths is valid, because within accuracy of our measurements.
EuTiO3 crystallizes in the cubic structure, which allows 3 IR active phonons and no Raman active mode. Our Raman spectra really revealed no first order peak. In IR spectra we see three distinct reflection bands corresponding to phonon frequencies at 82, 153 and 539 (at 6 K), however the fits were performed on the whole with 12 (mostly weak) modes, which account for the small rippled shape of reflectivity (mostly between 100 and 450). The additional modes stem apparently from the secondary pyrochlore Eu2Ti2O7 phase since they are better resolved in the sample with 15% pyrochlore phase (Fig. 2). We studied also temperature dependence of IR reflectivity of the 80%-dense single phase perovskite sample used for the magnetodielectric experiment in Fig. 1. The spectra yield the same temperature dependence of the soft mode, however, we do not present the spectra because of the deteriorated reflectance above 200.
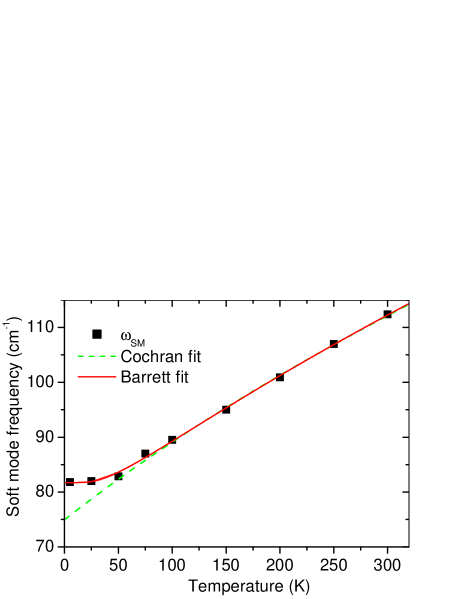
In Fig. 6 the temperature dependence of the soft mode frequency is plotted. The soft mode softens from 112 (300 K) down to 82 (6 K) and below 50 K is seen the saturation of . The low-temperature value of reasonably corresponds to the soft mode frequency obtained from the first principle calculations by Fennie and Rabe,[16], but is one order of magnitude larger than the value estimated by Jiang and Wu[11]. In classical paraelectrics above the ferroelectric phase transition , the should obey the Cochran law . Our fit in Fig. 6 yields A=(23.20.5) cm-2K-1 and = (-24210) K. However, the fit is of low quality since the experimental saturates at low temperatures below 50 K. Therefore it is more justified to use the Barrett formula[21]
| (6) |
which takes into account the quantum fluctuation at low temperatures. The fit with Eq. 6 is much more accurate especially at low temperatures (see Fig. 6) and yields the following parameters: A=(24.00.7) cm-2K-1, = (-22113) K and =(11314) K. is the temperature below which the quantum fluctuations start to play a role ( is the zero-point vibration energy). In other words, follows the Cochran law above , while below this temperature deviates from this law due to the quantum fluctuations. is the critical temperature, which is in our case negative indicating the tendency to hypothetical lattice instability at negative temperatures. Note that the parameters, as well as the and parameters in Cochran and Barret fits have the same values within the experimental errors.
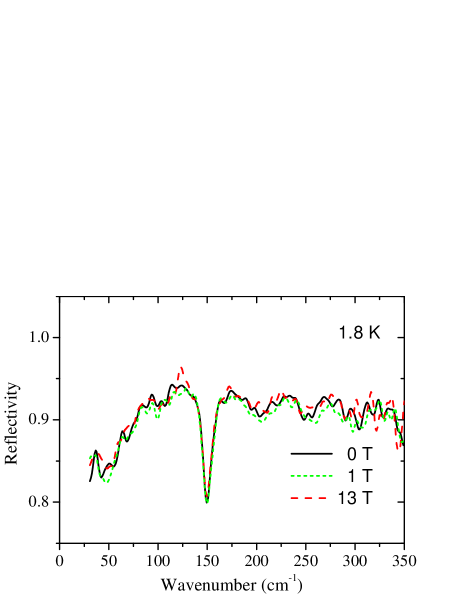
Up to now discussed IR and THz spectra were taken above 6 K, i.e. above . Since the permittivity decreases below , we may expect an increase in in the AFM phase and its softening with applied magnetic field. In a different setup we therefore measured the IR reflectivity at 1.8 K from 30 to 350 in the magnetic field from 0 to 13 T (see Fig. 7). Unfortunately, due to the low IR signal, high noise and limited accuracy of the measurement, we do not see any reliable magnetic field dependence of our FIR reflectivity. The expected change of with the highest magnetic field is only 3, which lies below limit of accuracy of the IR experiment using the magnetic cryostat.
Finally we conclude that our IR experiment confirmed the predictions of Refs. [5] that the quantum paraelectric behaviour in EuTiO3 is caused by a soft optic phonon and its frequency corresponds to value calculated from the first principles.[16] Simultaneously, we bring evidence that the soft mode is coupled with higher frequency polar modes, predominantly with TO2 phonon. However, the expected change of with magnetic field was not detected due to the low accuracy of IR reflectivity measurements in the magnetic cryostat. The effect is expected to be larger in a single crystal or strained thin films, which will be subject of our next studies.
Acknowledgements.
The work was supported by the Grant Agency of the Czech Republic (Project No. 202/06/0403), AVOZ10100520, Ministry of Education (OC101 and OC102-COST539) and European grant RITA-CT-2003-505474. The authors are grateful to V. Studnička for the XRD analysis.References
- [1] J. Wang et al. Science, 299 (2003) 1719.
- [2] M. Fiebig, J. Phys. D: Appl. Phys., 38 (2005) R123 .
- [3] S.-W. Cheong and M. Mostovoy, Nature Mater., 6 (2007) 13.
- [4] T. Kimura, T. Goto, H. Shintani, K. Ishizaka, T. Arima and Y. Tokura, Nature, 426 (2003) 55.
- [5] T. Katsufuji and H. Takagi, Phys. Rev. B, 64 (2001) 054415.
- [6] S. Kamba et al. Phys. Rev. B, 75 (2007) 024403.
- [7] T.R. McGuire et al. J. Appl. Phys. 37 (1966) 981.
- [8] Ch.-L. Chien, S. DeBenedetti, and F. De S. Barros, Phys. Rev. B, 10 (1974) 3913.
- [9] K.A. Müller and H. Burkard, Phys. Rev. B 19 (1979) 3593.
- [10] G. A. Samara, Solid State Physics, Advances in Research and Applications, Vol. 56. San Diego: Academic Press, pp. 240-458 (2001) and references therein.
- [11] Q. Jiang and H. Wu, J. Appl. Phys., 93 (2003) 2121.
- [12] S.J. Gong and Q. Jiang, Phys. Stat. Sol. (b), 241 (2004) 3033.
- [13] H. Wu, Q. Jiang and W.Z. Shen, Phys. Lett. A, 330 (2004) 358.
- [14] H. Wu, Q. Jiang and W.Z. Shen, Phys. Rev. B, 69 (2004) 014104.
- [15] H. Wu and W.Z. Shen, Sol. State Commun., 133 (2005) 487.
- [16] C.J. Fennie and K. M. Rabe, Phys. Rev. Lett., 97 (2006) 267602.
- [17] T. Katsufuji and Y. Tokura, Phys. Rev. B 60 (1999) R15021.
- [18] I. Rychetský, J. Petzelt, T. Ostapchuk, Appl. Phys. Lett.,81 (2002) 4224.
- [19] F. Gervais, in Infrared and Millimeter Waves, vol. 8, ed. K. J. Button (New York: Academic) chapter 7, p. 279
- [20] D.Y. Smith, Dispersion Theory, Sum Rules, and Their Application to the Analysis of Optical Data, p. 35 in Handbook of Optical Constants of Solids, Ed. E.D. Palik, Academic Press, Inc., London 1985.
- [21] Y. Minaki et al. J. Korean Phys. Soc., 42 (2003) S1290.