The Norma Cluster (ACO 3627): I. A Dynamical Analysis of the Most Massive Cluster in the Great Attractor
Abstract
A detailed dynamical analysis of the nearby rich Norma cluster (ACO 3627) is presented. From radial velocities of 296 cluster members, we find a mean velocity of 4871 54 km s-1 and a velocity dispersion of 925 km s-1. The mean velocity of the E/S0 population (4979 85 km s-1) is offset with respect to that of the S/Irr population (4812 70 km s-1) by km s-1 in the cluster rest frame. This offset increases towards the core of the cluster. The E/S0 population is free of any detectable substructure and appears relaxed. Its shape is clearly elongated with a position angle that is aligned along the dominant large-scale structures in this region, the so-called Norma wall. The central cD galaxy has a very large peculiar velocity of 561 km s-1 which is most probably related to an ongoing merger at the core of the cluster. The spiral/irregular galaxies reveal a large amount of substructure; two dynamically distinct subgroups within the overall spiral-population have been identified, located along the Norma wall elongation. The dynamical mass of the Norma cluster within its Abell radius is M⊙. One of the cluster members, the spiral galaxy WKK 6176 which recently was observed to have a 70 kpc X-ray tail, reveals numerous striking low-brightness filaments pointing away from the cluster centre suggesting strong interaction with the intracluster medium.
keywords:
galaxies: clusters: individual: Norma cluster (ACO 3627) – galaxies: elliptical and lenticular, cD – galaxies: individual: WKK 6176 – galaxies: kinematics and dynamics1 Introduction
The observed velocity flow field of galaxies in the nearby Universe is largely dominated by the Great Attractor (Dressler et al. 1987; Lynden-Bell et al. 1988; Tonry et al. 2000) and the 3 times more distant Shapley supercluster (Hudson et al. 2004). Both are extended overdensities in the large-scale mass distribution of the local Universe and both are thought to contribute significantly to the peculiar motion of the Local Group (LG) (Lucey, Radburn-Smith & Hudson 2005; Kocevski & Ebeling 2006). The relative contribution of the Great Attractor and the Shapley supercluster to the motion of the LG, however, remains poorly determined (cf. Erdoğdu et al. 2006; Kocevski & Ebeling 2006) and is still a matter of debate.
The Shapley supercluster (SCL) is clearly visible as an overdensity in the distribution of Abell clusters (Scaramella et al. 1989; Einasto et al. 1997; Proust et al. 2006), whereas the Great Attractor (GA) and its location was identified first and foremost from the systematic peculiar velocities of galaxies streaming towards this apex (e.g. Lynden-Bell et al. 1988), and confirmed later from reconstructed mass-density fields of the local Universe (Dekel 1994; Kolatt, Dekel & Lahav 1995; Erdoğdu et al. 2006). However, no significant overdensity was obvious in the distribution of galaxies or Abell clusters at the position of the GA (Lynden-Bell & Lahav 1988). This is not surprising given the location of the GA with respect to the Zone of Avoidance (ZOA). Kolatt et al. (1995) locate the approximate centre of the extended GA overdensity at () (320∘, 0∘, 4000 km s-1) based on their smoothed reconstructed mass-density field. The uncertainty in this position is as a result of the applied smoothing of 1200 km s-1; this smoothing is necessary given the sparsely sampled data (Kolatt et al. 1995). Towards such low Galactic latitudes, the view of the extragalactic light distribution is increasingly reduced by the dust and stars in the Milky Way. As a result, a large part of the GA overdensity is hidden from view by the Milky Way and early attempts to quantify the nature and extent of the GA (e.g. Dressler 1988; Hudson 1993a, 1993b; Rowan-Robinson et al. 1990; Jahoda & Mushotsky 1989) were unsatisfactory: the clear (and significant) mismatch between the inferred mass of the GA and the visible galaxy distribution could not be understood.
A deep optical galaxy search at low Galactic latitudes in the GA region (Woudt & Kraan-Korteweg 2001) has lifted part of the veil of the Milky Way. Close to the predicted centre of the GA, the Norma cluster (ACO 3627: Abell, Corwin & Olowin 1989) has been identified as the most massive cluster in the GA region (Kraan-Korteweg et al. 1996; Woudt 1998). Abell et al. (1989) classified this cluster as an irregular (I) cluster with Bautz-Morgan type I (Bautz & Morgan 1970). They furthermore classify it as a richness-class 1 cluster with ‘59?’ galaxies in the magnitude interval and + 2, where corresponds to the magnitude of the third brightest galaxy in the cluster. Independently, X-ray observations of the Norma cluster from ROSAT (Böhringer et al. 1996) and ASCA (Tamura et al. 1998) confirm the massive nature of this cluster. From our deep optical galaxy survey in the ZOA in the general GA region, and our follow-up redshift survey (Fairall, Woudt & Kraan-Korteweg 1998; Woudt, Kraan-Korteweg & Fairall 1999; Woudt et al. 2004), a clearer view of the obscured GA overdensity has emerged. The Norma cluster is the central cluster in a web of connected filaments and wall-like structures (Woudt 1998; Kraan-Korteweg & Lahav 2000; Radburn-Smith et al. 2006), analogous to the structures observed in and around major mass concentrations in the -CDM (cold dark matter) Millenium simulation (Springel et al. 2005).
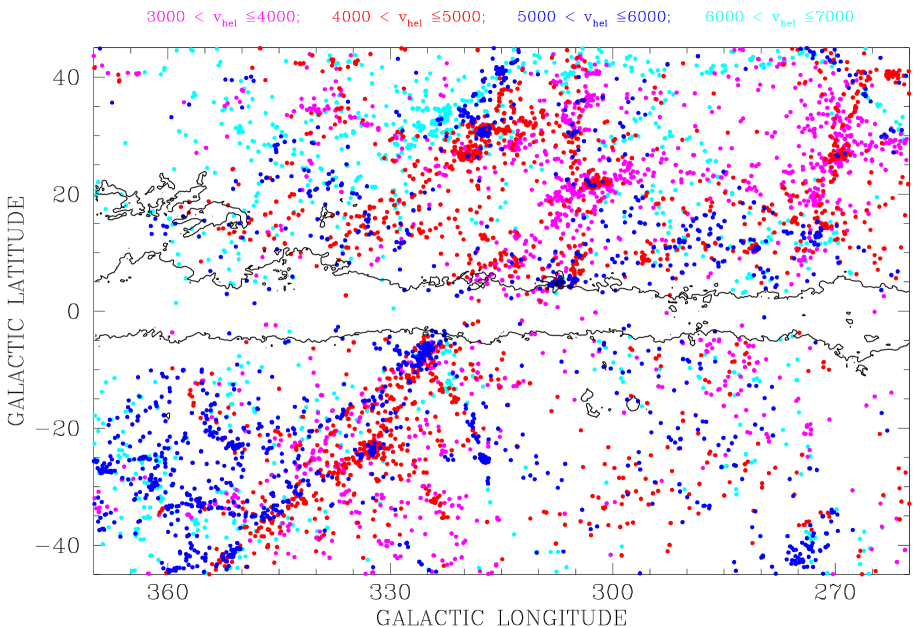
One of the most prominent newly identified structures is a great-wall-like structure with the Norma cluster at its centre which we dubbed the Norma supercluster (Woudt 1998; Fairall et al. 1998), a wall of galaxies which runs nearly parallel to the Galactic Plane (Kraan-Korteweg & Lahav 2000; Radburn-Smith et al. 2006) connecting the Pavo II cluster with the Norma cluster and continuing across (and nearly parallel to) the Galactic Plane to the more distant Vela overdensity (Kraan-Korteweg, Fairall & Balkowski 1995) via the Cen-Crux cluster (Woudt 1998). Fig. 1 gives a clear overview of the dominant large-scale structures in the Great Attractor region.
Support for the prominence of the Norma SCL has come from various complementary multiwavelength studies at lower Galactic latitudes such as the detection of several further clusters embedded in the Norma SCL. An X-ray search for highly obscured clusters in the ZOA (Ebeling, Mullis & Tully 2002) revealed the second most massive cluster in the Norma SCL, namely CIZA J1324.7–5736. This cluster is 50%–70% less massive than the Norma cluster (Radburn-Smith et al. 2006) and is located at km s-1). Deep near-infrared observations (Nagayama et al. 2004) furthermore uncovered a low-mass cluster around PKS 1343-601 at km s-1), also within the Norma SCL. Apart from this significant collection of clusters, a general overdensity along the Norma SCL is also clearly present in the Parkes deep H I multibeam ZOA survey (Kraan-Korteweg et al. 2005).
In the first of a series of papers investigating the Norma cluster, we present a detailed dynamical analysis of this cluster, the most massive cluster in the Great Attractor overdensity, centrally located in a cosmic web of filaments and wall-like structures.
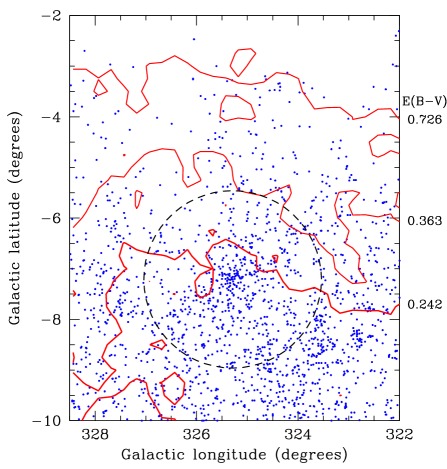
Figure 2 shows the distribution of the optically-detected galaxies (Woudt & Kraan-Korteweg 2001) in the general direction of the Norma cluster, where the Abell radius () of the Norma cluster is indicated by the dashed circle. At the redshift of the Norma cluster (see Sect. 3), the Abell radius corresponds to an angular radius of 1.75∘. Assuming a Hubble constant of km s-1 Mpc-1 and the cosmological concordance model (assumed throughout this paper), the Abell radius corresponds to a physical size of 2.0 Mpc (the cosmology-corrected angular scale at this distance is 1.16 Mpc per degree). Contours of equal Galactic foreground extinction, taken from the DIRBE/IRAS Galactic reddening map (Schlegel, Finkbeiner & Davis 1998), are overlayed on the galaxy distribution in Fig. 2 ( = 1.0, 1.5 and 3.0 mag, respectively; Cardelli, Clayton & Mathis 1989) and show that the Galactic foreground extinction within the Abell radius of the Norma cluster is moderate, mag.
Within the Abell radius, there are 603 optically-detected galaxies with observed diameters in excess of 12′′ (Woudt & Kraan-Korteweg 2001) and 219 (near-infrared-detected) galaxies in the extended source catalogue (XSC) of the 2 Micron All-Sky Survey (2MASS, Skrutskie et al. 2006). The 2MASS galaxies in the Norma cluster represent a subset of the 603 optically-detected galaxies, although not all the 2MASS galaxies have an optical counterpart; 165 of the 219 2MASS galaxies (75%) were also found by Woudt & Kraan-Korteweg (2001). For the brighter 2MASS galaxies (10′′-aperture -band 12.5 mag), the overlap between 2MASS and the optical survey is excellent: 97% of the 2MASS galaxies have an optical counterpart. It should be noted that at the position of the Norma cluster () star-crowding is the primary limiting factor, not the Galactic foreground extinction. The star-crowding leaves a Zone of Avoidance imprint on the 2MASS XSC catalogue near the Galactic Bulge (Kraan-Korteweg & Jarrett 2005) and the Norma cluster is located on the edge of this Zone of Avoidance. At moderate extinction ( mag), but in the presence of severe star-crowding, optical surveys still retrieve the most complete galaxy distribution in the Zone of Avoidance (Kraan-Korteweg & Jarrett 2005).
We have obtainted 129 new redshifts of galaxies within the Abell radius of the Norma cluster using the 2dF spectrograph at the Anglo-Australian Observatory. These new observations are presented in Section 2. In Section 3 all the redshifts obtained to date are combined and a detailed dynamical analysis of the cluster based on 296 cluster members is presented. In Section 4, we discuss a few individual galaxies in the Norma cluster of dynamical interest.
2 2dF spectroscopy
Spectra were obtained with the 2dF facility (Lewis et al. 2002) on the 3.9m Anglo-Australian Telescope. Full details of the observing 2dF setup used for observations are given in Table 1. As the main objective was to measure the velocity disperisons of the cluster’s early-type galaxies the 1200V gratings were used in each of the 2dF spectrographs. These gave a FWHM resolution of 125 km s-1 at Mg which is sufficient to determine velocity dispersions down to 60 km s-1. In all, three fibre configurations were observed. Spectra were extracted from the raw data frames, wavelength calibrated and sky-subtracted using the AAO 2dfdr software package111http://www.aao.gov.au/2df/software.html#2dfdr. Redshifts were determined via cross-correlation for the absorption line spectra and/or the direct measurement of emission lines.
| Date of Observations | 2001 May 30 |
|---|---|
| Field centre (J2000.0) | |
| Number of fibre config. | 3 |
| Total exposure times | s, s, s |
| Fibre size | 2.1 arcsec (= 0.68 kpc at Norma) |
| Grating | 1200V |
| Wavelength coverage | 4700 – 5840 Å |
| Resolution (FWHM) | 2.2 Å |
| Wavelength pixel scale | 1.1 Å |
The 2dF spectroscopic observations focussed on the determination of accurate velocity dispersions of early-type galaxies in the Norma cluster for a Fundamental Plane analysis of the cluster. The primary target list therefore consisted of known bright ellipticals in the cluster (Woudt & Kraan-Korteweg 2001). However, we used the spare fibres of the 2dF spectrograph to extend the redshift coverage of the Norma cluster. Galaxies were primarily selected from the optical catalogue of Woudt & Kraan-Korteweg (2001) and the 2MASS XSC, indicated by ‘WKK’ and ‘2MASX J’, respectively in Table 2. Additional galaxies were identified on deep images taken with the ESO/MPG 2.2-m telescope and the Wide Field Imager (see Sect. 4). These are identified as ‘ZOA J’ in Table 2.
Redshifts were obtained for 182 galaxies, 53 of which had a previous measurement. For 76 galaxies, multiple measurements were obtained to gauge the internal accuracy of the 2dF spectrograph. Table 2 shows a representative sample of the results obtained from the 2dF spectroscopy. The full table is available online.
| Identification∗ | RA (2000.0) | DEC (2000.0) | vabs | vem |
|---|---|---|---|---|
| (km s-1) | (km s-1) | |||
| ZOA J16070347-6113587 | 16 07 03.465 | –61 13 58.74 | 15868 | |
| WKK 5916 | 16 07 50.369 | –61 10 06.84 | 3053 | |
| WKK 5920 | 16 07 52.618 | –60 31 12.95 | 4762 | |
| WKK 5926 | 16 08 08.744 | –61 12 44.37 | 15856 | |
| ZOA J16081355-6109377 | 16 08 13.548 | –61 09 37.65 | 3640 | |
| 2MASX J16082135-6044498 | 16 08 21.312 | –60 44 50.20 | 29813 | |
| ZOA J16083012-6039511 | 16 08 30.118 | –60 39 51.08 | 6040 | |
| WKK 5958 | 16 09 01.326 | –60 52 03.70 | 15708 | |
| WKK 5964 | 16 09 06.402 | –60 59 07.70 | 4711 | |
| ZOA J16091138-6108285 | 16 09 11.377 | –61 08 28.45 | 15674 |
∗ In column 1, the WKK identification (Woudt & Kraan-Korteweg 2001) is given if the galaxy has been identified by
WKK.
Alternative names for galaxies are given if a WKK identification was unavailable but when the galaxy has been identified already
in
another survey (e.g. ‘2MASX J’, Skrutskie et al. 2006). A new identification was given to galaxies not yet catalogued in the
literature,
but which we identified from deep imaging (e.g. ‘ZOA J’, see Sect. 4).
Figure 3 shows a comparison of the measured 2dF heliocentric velocities with measurements from the literature. The vast majority of these previous measurements were obtained in the course of our ZOA redshift survey (SAAO: Woudt et al. 1999; MEFOS: Woudt et al. 2004). The overall agreement is very good:
with a dispersion of = 124 km s-1 (based on 51 galaxies). Only one galaxy revealed a discrepent heliocentric velocity; for WKK 6329, the 2dF spectroscopy resulted in km s-1 as compared to the previously low signal-to-noise value for this galaxy of 2477 250 km s-1 (Woudt et al. 1999).

We then compared the 2dF results with a subset of the literature sample, namely those for which redshifts were obtained with the MEFOS multi-fibre spectrograph (Woudt et al. 2004). This subset has the most accurate redshifts available for the Norma cluster. There are 16 galaxies in common between 2dF and MEFOS (the filled circles in Fig. 3). The agreement is again excellent, with a lower rms ( = 31 km s-1) than the previous comparison (which included the SAAO measurements),
Given the primary goal of obtaining accurate velocity dispersions from the 2dF spectroscopy, we have observed a large number of galaxies repeatedly to gauge the internal uncertainty: 69 galaxies were observed twice and 7 galaxies had three independent velocity measurements. For these repeated observations we find = 33 km s-1 over the entire range of observed velocities. This is comparable to the external comparison with the MEFOS spectroscopy. Based on these independent evaluations, we have assigned a standard error of 35 km s-1 to each of the 2dF velocities.
3 Dynamical Analysis
3.1 Cluster membership
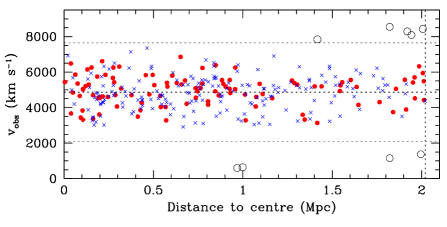
With the new 2dF observations described above, radial velocities are now available for 305 galaxies within the Abell radius of the Norma cluster for the velocity range 0 – 9500 km s-1. The velocity distribution of these galaxies as a function of distance to the Norma cluster centre is shown in Fig. 4. The centre of the cluster was taken as the cD galaxy WKK 6269, a strong wide-angle-tail radio-continuum source (Jones & McAdam 1992, 1996) located at the peak in the 0.7–10 keV ASCA map of the Norma cluster (figure 1 of Tamura et al. 1998). The velocity centroid (see Sect. 3.2.3) of the Norma cluster is 4871 km s-1 and is marked by the central horizontal dashed line. The velocity limits for cluster membership are taken as 3 times the velocity scale/dispersion (925 km s-1) around the velocity centroid; these limits are shown as the upper and lower horizontal dashed line in Fig. 4.
Nine galaxies are distinct outliers (open circles in Fig. 4) and have been rejected from our subsequent analysis. This leaves 296 likely cluster members, of which 107 have been classified as elliptical or lenticular (E/S0: filled circles in Fig. 4) and 189 are either spirals or irregulars (S/Irr: crosses in Fig. 4) (Woudt & Kraan-Korteweg 2001).
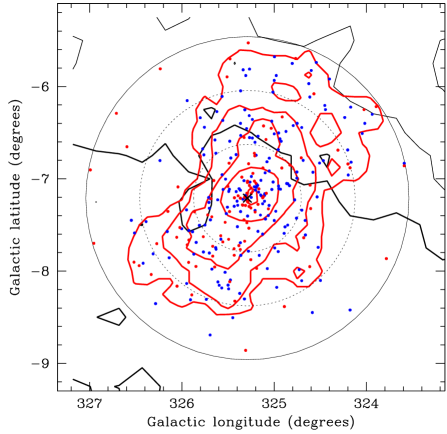
The galaxy density contours determined from the 296 cluster members, displayed in Fig. 5, show that the cluster is strongly elongated along a position angle which is aligned with the Norma wall (compare Figs. 1 and 5). Since the elongation is nearly perpendicular to the Galactic extinction contours, it seems very unlikely that selective extinction effects are the cause of the observed elongation. The peak of the galaxy-density distribution is located at right ascension and declination , (J2000.0), about 3 arcmin from WKK 6269 at , (J2000.0), our adopted centre.
3.2 Substructure statistics
We employed the statistical tests described by Pinkney et al. (1993, 1996) in analysing the dynamical structure of the Norma cluster. This array of statistical tools consists of one-dimensional tests (analysing the shape of the velocity histogram), two-dimensional tests (checking for substructure in the on-sky distribution), and three-dimensional tests (using velocity and positional information). Among the latter, the Dressler-Shectman (DS) -test (Dressler & Shectman 1988) is a particularly powerful and frequently used method to quantify substructure (e.g. Pinkney et al. 1993; Oegerle & Hill 2001; Pimbblet, Roseboom & Doyle 2006). This test calculates the mean velocity () and the standard deviation () for each galaxy and its (= ) nearest neighbours, where represents the total number of galaxies in the sample; often only the 10 nearest galaxies are used in this analysis. These local parameters are then compared with the global mean () and standard deviation () of all the galaxies in the sample. For each galaxy, is calculated where is given by
The cumulative deviation is defined as the sum of all ’s. If no subclustering is present, is approximately equal to the number of galaxies in the sample ().
In the following subsections we analyse the Norma cluster at three incremental radii, starting with the inner core of the cluster ( Mpc), double this radius ( Mpc) and three times this radius out to the Abell radius ( Mpc).
3.2.1 The inner Abell radius (= 0.67 Mpc)
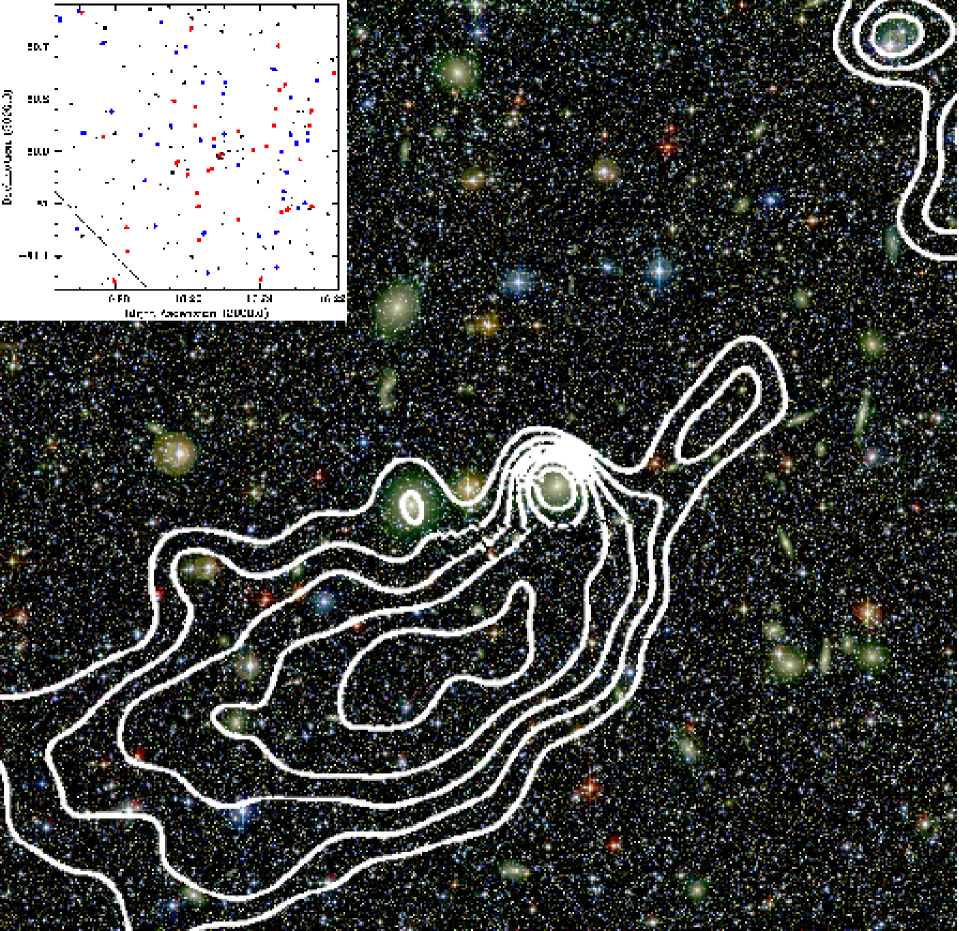
Figure 6 shows the optical image of the central arcmin of the Norma cluster, obtained with the 2.2-m MPG/ESO telescope at la Silla and the Wide Field Imager during three nights in 1999 May (see also Section 4). The area displayed in Fig. 6 corresponds to 1.6 times the core radius (; King 1966) of the Norma cluster, where = 104 11 (optical: Kraan-Korteweg et al. 1996) and = 995 10 (X-ray; Böhringer et al. 1996) for the Norma cluster. In terms of the Abell radius, Fig. 6 displays the inner .
Superimposed on the optical colour image are the contours of the X-ray subcluster identified by Böhringer et al. (1996) (reproduced from their figure 2). Note that these contours mark the subcluster only and that the main cluster has been subtracted as described in Böhringer et al. (1996). The inset in Fig. 6 shows the corresponding sky distribution (in equatorial coordinates) of the identified galaxies in this field of view. The red and blue dots are confirmed cluster members, where the red dots mark E/S0 galaxies, and the blue dots correspond to S/Irr galaxies. The large black dots are galaxies (without a redshift) identified in our deep optical survey (Woudt & Kraan-Korteweg 2001) and the small black dots are galaxies (also without a redshift) identified on the deep -band images taken with the Wide Field Imager. The central cD galaxy (WKK 6269, see the discussion in Sect. 3.4 on the peculiar velocity of this galaxy) is indicated by the black-encircled red dot.

Within , there are 129 galaxies confirmed as cluster members; 53 galaxies are E/S0 (41%) and 76 have been classified as S/Irr (59%), respectively. The velocity histogram of the 129 cluster members – shown in the upper panel of Fig. 7 as the cross-hatched distribution – is consistent with being Gaussian and has a biweight velocity centroid () and scale () (Beers, Flynn & Gebbhardt 1990) of 4777 86 km s-1 and 973 km s-1, respectively. When separating the sample into the elliptical and spiral population, there are some marked differences between these galaxy populations. Firstly, the biweight velocity centroid of the two populations differ by 334 km s-1 (see Table 3). The statistical significance of this difference – by analogy to the arguments used in the peculiar velocity discussion (Sect. 3.4) – is . Secondly, contrary to the velocity distribution of the elliptical galaxies (the dark shaded histogram in the top panel of Fig. 7), the velocity distribution of the spiral galaxies is non-Gaussian with hints of skewness and kurtosis.
In addition, the elliptical population is strongly elongated along a position angle in the equatorial on-sky projection of 116∘ (measured counter-clockwise from North), whereas the distribution of the spiral galaxies is largely spherical. The position angle of 116∘ in equatorial coordinates corresponds to a position angle of 160∘ (measured counter-clockwise from North) in the galactic-coordinate distribution at the position of the Norma cluster. The position angle of the elongated distribution is indicated by the arrows in the top-left panel of Fig. 8. The location of the X-ray subcluster is indicated by the solid black line in the left panels of Fig. 8. It is interesting to note the approximate alignment of the X-ray subgroup with the elongated distribution of the E/S0 galaxies. Statistical significance of the two- and three-dimensional substructure tests are calculated by means of Monte Carlo (MC) simulations (Pinkney et al. 1996). The observed sample is compared to 500 simulated samples. In the case of the elongation of the elliptical population, only 4 out of the 500 simulations showed a larger degree of elongation.
Despite the above mentioned differences between the elliptical and spiral galaxy population, and despite the presence of the X-ray subcluster, the Dressler-Shectman -test showed no clear sign of substructure. The combined sample, as well as the E/S0 galaxy sample (and to a lesser extent the S/Irr galaxies) are formally consistent with no substructure. The values for the combined sample and the individual galaxy populations are given in Table 3, together with the average value of after 500 Monte Carlo simulations.
| (= 0.67 Mpc) | (= 1.35 Mpc) | (= 2.02 Mpc) | ||
| All galaxies | ||||
| (km s-1) | 4777 86 | 4822 61 | 4871 54 | |
| (km s-1) | 973 | 940 | 925 | |
| 129 | 239 | 296 | ||
| 135.7 (38%) | 262.7 (23%) | 353.1 (4%) | ||
| 131.4 | 244.0 | 301.4 | ||
| cD | (km s-1) | 653 | 609 | 561 |
| 6.5 | 7.6 | 7.5 | ||
| Elliptical and lenticular galaxies | ||||
| (km s-1) | 4951 132 | 4962 97 | 4979 85 | |
| (km s-1) | 964 | 901 | 877 | |
| 53 | 86 | 107 | ||
| 44.8 (75%) | 83.7 (52%) | 107.7 (47%) | ||
| 49.6 | 84.4 | 106.9 | ||
| Spiral and irregular galaxies | ||||
| (km s-1) | 4617 109 | 4740 78 | 4812 70 | |
| (km s-1) | 949 | 965 | 957 | |
| 76 | 153 | 189 | ||
| 98.2 (14%) | 186.3 (8%) | 247.4 (1%) | ||
| 85.6 | 158.0 | 191.2 | ||
∗ The percentages given after each value of reflect the percentage of Monte Carlo simulations which showed
a higher amount of
subclustering than the actual observed sample. Percentages below 10% indicate significant subclustering.
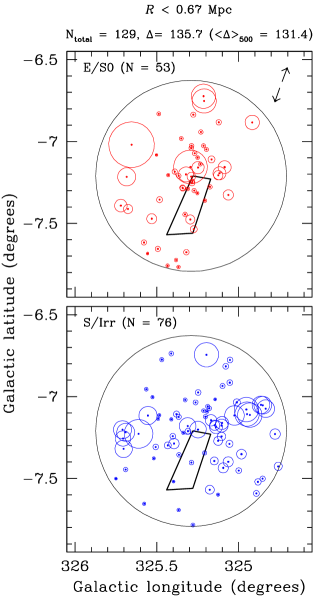
Of the 500 MC simulations, 38%, 75% and 14% revealed a higher than the observed for the combined, E/S0 and S/Irr sample, respectively. Nominally, substructure is said to be present in the observed sample when less than 10% of the MC simulations show a larger amount of substructure. In this case, the S/Irr galaxies reveal marginal evidence for substructure. Fig. 8 shows the results of the Dressler-Shectman -test for the combined sample, plotted in Galactic coordinates (as in Fig. 2). We have plotted the E/S0 galaxies (upper-left panel) and the S/Irr galaxies (lower-left panel) separately. The size of the symbols is proportional to the individual values of , where large circles indicate significant deviations from either the local mean velocity or the local mean velocity dispersion.
Various individual galaxies exhibit properties which are also strongly aligned along the same position angle (WKK 6305 = PKS 1610-605: extended head-tail radio continuum emission (Jones & McAdam 1992), WKK 6176: extended X-ray tail (Sun et al. 2006)); there is an obvious elongation within the Norma cluster which affects the way in which the galaxies interact with the intracluster medium. In Sect. 4 we will review some of the properties of these galaxies in more detail.
3.2.2 The inner Abell radius (= 1.35 Mpc)
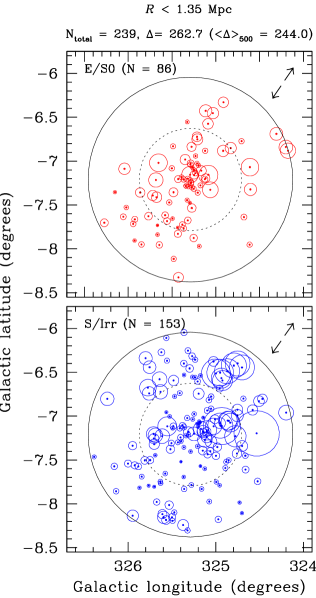
The inner of the Norma cluster contains 239 confirmed cluster members, of which 86 are E/S0 galaxies (36%) and 153 are S/Irr galaxies (64%). The velocity distribution (histogram) is formally consistent with being Gaussian (see middle panel of Fig. 7), although a slight excess of spiral galaxies at lower velocities is present. The velocity centroid of the combined sample ( km s-1) is somewhat larger compared to that of the inner -sample, but this is largely due to an increase in the velocity centroid of the S/Irr population (although the velocity scale of the S/Irr galaxies has not changed). The values for the biweight velocity centroids and scales of the various samples are given in Table 3.
The offset in the biweight velocity centroid between the E/S0 and S/Irr sample remains albeit slightly lower and is 222 km s-1 with a significance of . The velocity centroid of the E/S0 galaxies has not changed by extending the sample to a larger radius (see Table 3), although its biweight velocity scale is somewhat smaller; = 901 km s-1 for , compared to = 964 km s-1 for .
In terms of their spatial distribution, the elliptical and spiral populations now both reveal significant elongation and have position angles of 102∘ and 101∘, respectively, in the equatorial coordinate frame. This corresponds to position angles of 146∘ and 145∘ in the Galactic coordinate frame. The latter are again indicated by arrows in the top-right of the middle panels in Fig. 8. The -test now clearly reveals substructure in the S/Irr sample (only 8% of the MC simulations show a larger degree of substructure). Interestingly, the -test shows that the E/SO population is completely free of any detectable substructure. In Fig. 8, the results from the -test of the combined sample out to is shown in the middle panels, where the upper-middle panel shows the E/SO galaxies and the lower-middle panels displays the S/Irr galaxies.
3.2.3 The Abell radius (= 2.02 Mpc)
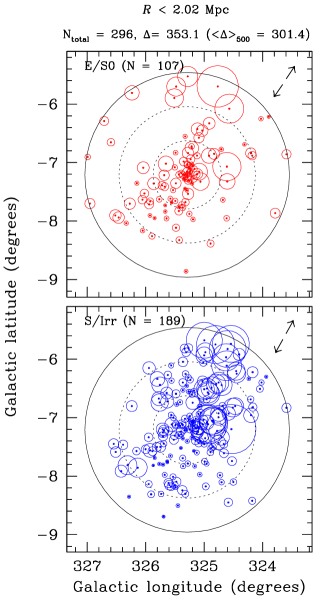
Our final sample extends out to the full Abell radius of the Norma cluster. Within this region, there are 296 cluster members (Sect. 3.1) of which 107 are classified E/S0 (36%) and 189 belong to the S/Irr population (64%). The velocity histogram of the combined set (the hashed histogram in the lower panel of Fig. 7) shows some evidence for kurtosis, based on the average of 6 kurtosis tests (Pinkney et al. 1996), and a clear excess of galaxies at lower velocities. The difference in the velocity centroid of the two morphologically-distinct samples is reduced to 167 km s-1 (164 km s-1 in the cluster rest frame) at a significance of .
The spatial distribution of both the E/S0 galaxies and the S/Irr galaxies is strongly elongated with position angles of 102∘ and 107∘, respectively, in the equatorial coordinate frame. This corresponds to 146∘ and 151∘ in the Galactic coordinate reference frame; these angles are indicated by the arrows in the top-right corner of the right panels in Fig. 8. The uncertainty in the position angle is 7∘.
As before, the E/S0 population appears relaxed. Their velocity centroid remains constant throughout the cluster (4979 85 km s-1 for all the E/S0 galaxies within the Abell radius) and no substructure is detected by the Dressler-Shectman -test. The velocity scale () of the E/S0 sample shows a distinct decrease as a function of radius (see Table 3), again a signature of a relaxed rich cluster (Rines et al. 2003).
The spiral galaxy population, on the other hand, appears far from relaxed. The velocity centroid increases with increasing radius (shifting by 200 km s-1 across the Abell radius) and the velocity scale stays roughly constant at 960 km s-1. The Monte Carlo simulations of the Dressler-Shectman -test of the S/Irr galaxies indicate that only 1% of the simulations show a larger degree of substructure compared to the observed amount of substructure. The results of the -test of the combined sample () is shown in the right panels of Fig. 8.
3.3 Subgroups in the Norma cluster
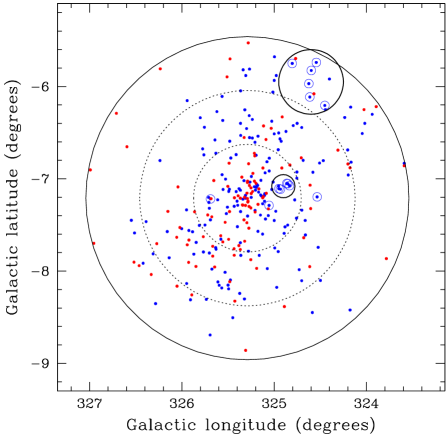
We have identified two spiral-rich subgroups based on the Dressler-Shectman -test of the S/Irr population alone. When displaying those S/Irr galaxies for which , two distinct groups appear. In Fig. 9 the distribution in Galactic coordinates of the 296 cluster members are shown, where spiral galaxies with are shown as encircled dots. This limit was chosen based on the outcome of the -test of the E/S0 galaxies; that sample is completely free of any substructure and there the largest measured was 2.25. A few isolated galaxies also appear with large values.
In the case of WKK 6406 at () = (, , km s-1), its large heliocentric velocity could indicate that it is a background galaxy which was mistakenly identified as a cluster member (see also Fig. 4).
Close to the centre of the Norma cluster is a compact group (dubbed ‘Norma A’) where we have isolated a group of five dynamically distinct galaxies around WKK 6078 (including WKK 6071, WKK 6078, WKK 6125, WKK 6135 and ZOA J16113352). This group is marked in Fig. 9 by the small solid circle within the region (inner dashed circle). The centre of Norma A is approximately at right ascension and declination , (J2000.0). Based on these five galaxies, we find a mean velocity of 4453 km s-1 (which is 418 km s-1 less than the mean of the cluster, corresponding to 411 km s-1 in the cluster rest frame). Norma A has a velocity dispersion of 312 km s-1, which is much smaller than the velocity scale of the cluster (925 km s-1).
A second dynamically distinct group of galaxies (‘Norma B’) is found further from the core of the cluster, centred around WKK 5751 (other galaxies include WKK 5718, WKK 5779, WKK 5783, WKK 5796 and WKK 5813). This group is indicated by the large solid circle in Fig. 9 in the region and has a central position (in right ascension and declination) of , (J2000.0). It has a mean velocity of 5313 km s-1 (an offset of +435 km s-1 in the cluster rest frame) and a velocity dispersion of 604 km s-1.
Norma B (and to a lesser extent Norma A) lies along the Norma wall elongation, supporting the idea that cluster infall occurs along the connecting filaments and wall-like structures. This is consistent with the large-scale structure formation and evolution as seen in the -CDM Millenium simulation (Springel et al. 2005). To gauge how far the merger of both Norma A and B with the main cluster (Norma major) has progressed, deep observations with the Australian Telescope Compact Array (ATCA) could be used to determine whether the spiral galaxies in Norma A and Norma B are hydrogen-deficient as a result of interactions with the intracluster medium. Previous observations with ATCA of the Norma cluster (Vollmer et al. 2001) showed that spirals in the Norma cluster are generally HI-deficient, but these observations did not include Norma A and B, respectively.
3.4 The peculiar velocity of the central cD galaxy
The Norma cluster contains two large cD galaxies, namely WKK 6312 at km s-1 (Woudt et al. 2004) and WKK 6269 at km s-1 (Woudt et al. 2004). The latter has been observed with the 2dF and was found to be in excellent agreement with previous measurements: km s-1, see Table 2). WKK 6269 is also known as PKS B1610-608 (one of the 20 strongest extragalactic radio sources) and is a textbook example of a wide-angle-tail (WAT) radio galaxy (Jones & McAdam 1992, 1996). Such WAT morphology either reflects the motion of the cD galaxy through the cluster and its interaction with the intracluster medium via ram pressure (Owen & Rudnick 1976), or indicates the presence of a cluster-subcluster merger (Burns 1998).
Whether WKK 6269 is at rest with respect to the potential well of the cluster can be assessed from its peculiar velocity, i.e. the difference between the velocity centroid of the cluster () and the velocity of the individual cD galaxy (). The peculiar velocity has to be corrected by a factor to ensure the velocity difference is in the cluster rest frame and considered independently for the varying values in the three regarded spheres.
In Table 3 we also list the values of the peculiar velocity of WKK 6269 as determined within the various spheres. It ranges from 650 km s-1 within a radius of 0.67 Mpc to 550 km s-1 within 2.02 Mpc. The statistical significance of this peculiar velocity ranges from 6.5 to 7.5 (, where is the error in the velocity centroid of the cluster and is the error in the velocity measurement of the cD galaxy). The large number of cluster members used to determine the velocity centroid () and the small error in the measurement of the heliocentric velocity of WKK 6269, makes this large peculiar velocity highly significant. It is exceptionally large when compared to other cD galaxies in clusters (Oegerle & Hill 2001), but not without precedent (Pimbblet et al. 2006). Note that the other cD galaxy in the Norma cluster (WKK 6312) has an even larger velocity offset.
Böhringer et al. (1996) identified an X-ray subgroup close the centre of the Norma cluster (see Fig. 6). This subgroup (dubbed ‘Norma minor’) is fairly massive; Tamura et al. (1998) estimate that the mass of this subgroup could add up to 50% to the total mass of the cluster.
A comparison of the 843 MHz radio continuum emission of PKS B1610-608 (Jones & McAdam 1992) with the X-ray contours of this central subgroup (shown in Fig. 11) shows that the radio lobes of WKK 6269 are closely aligned with the X-ray subgroup. The large observed peculiar velocity of the cD galaxy in the Norma cluster is most likely caused by this ongoing merger.
Based on the compactness of the X-ray subcluster, Böhringer et al. (1996) argued that the merger has not progressed very far yet, and that most of the main component of the cluster is still undisturbed by the collision. This is consistent with simulations of cluster mergers (Pinkney et al. 1996), which show that large peculiar velocities can be reproduced in the event of large-scale mergers at the time of core-crossing. If this merger takes place close to the plane of the sky, it would also explain the non-results of the statistical tests. These are least sensitive to mergers occuring perpendicular to the line-of-sight. Therefore, the X-ray morphology – in combination with the large peculiar motion of the central cD galaxy – strongly suggests a recent or commencing merger at the core of the cluster.
3.5 Dynamical mass estimate
For the determination of the dynamical mass of the Norma cluster, we have used both the virial theorem () and the projected mass estimator (), see equations 21 and 22 of Pinkney et al. (1996). The use of the bi-weight velocity centroid and scale (Beers et al. 1990) in the virial theorem (instead of the velocity mean and standard deviation) leads to a more robust mass estimate (). The latter is more robust against the effects of contamination by the inclusion of possible non-members in the analysis. The projected mass estimator (Bird 1995), on the other hand, is sensitive to the presence of (spatially-separated) subclusters due to its proportionality to the projected distance between galaxy and the cluster centroid () (see equation 22 in Pinkney et al. 1996). The presence of a spatially-separated subcluster (e.g. in a premerger configuration) would result in a systematic offset with respect to the cluster centroid; this leads to larger values of and thus to a significantly larger mass estimate. For a full discussion of the appropriate use of these dynamical mass estimators we refer to Pinkney et al. (1996) and Bird (1995).
The three dynamical mass estimates (, and ) determined within the three radial limits (using the combined samples of = 129, 239 and 296 galaxies, respectively) are given in Table 4. On average, is % larger than . The projected mass estimate, however, is generally about 50% larger than and indicates the presence of a spatially-distinct subcluster (projected on the plane of the sky) presumably in the early stages of merging (Pinkney et al. 1996). This is consistent with our previous indications of subclustering, particularly in the form of Norma minor (the X-ray subgroup).
Böhringer et al. (1996) and Tamura et al. (1998) both give an estimate of the gravitational mass of the Norma cluster based on ROSAT and ASCA X-ray observations, respectively. In Table 4, we list the values (converted from to ) of the mass within a specific radius as derived from X-ray observations by Böhringer et al. (1996) and Tamura et al. (1998). Both virial mass estimates ( and ) are consistent with the mass determined from the X-ray luminosity of the cluster. In the presence of substantial subclustering, as suggested here for the Norma cluster, all dynamical mass estimators could still overestimate the true mass of the cluster, depending on the projection angle of the cluster–subcluster merger axis with respect to the line of sight (Pinkney et al. 1996). This effect is smallest for and for a merger occuring perpendicular to the line-of-sight. We can therefore safely conclude that the mass of the Norma cluster within the Abell radius corresponds to M⊙. This confirms the status of the Norma cluster as the most massive cluster in the Great Attractor.
| X-ray mass (gravitational) | ||
|---|---|---|
| (h Mpc)∗ | (h M⊙)∗ | Reference |
| 0.68 | Böhringer et al. (1996) | |
| 0.75 | Tamura et al. (1998) | |
| 2.05 | Böhringer et al. (1996) | |
| Dynamical mass | |||
|---|---|---|---|
| (h Mpc) | (h M⊙) | ||
| all galaxies | |||
| 0.67 | |||
| 1.35 | |||
| 2.02 | |||
∗ The original values have been converted from to .
4 Individual galaxies
A number of galaxies in the Norma cluster show direct or indirect evidence of interaction with the intracluster medium (ICM). Here, we will explore these galaxies in some detail in the light of the preceding discussion.
4.1 WKK 6176 and the X-ray tail
Recent Chandra and XMM-Newton observations of WKK 6176 (= ESO 137-001) revealed the presence of a 70 kpc long X-ray tail pointing away from the cluster centre (Sun et al. 2006), suggesting this galaxy is undergoing a significant amount of gas stripping. The extent of this X-ray tail is unusual (Sun et al. 2006).
We have deep , and -band photometry of WKK 6176. These data were obtained in 1999 May with the MPG/ESO 2.2-m telescope at la Silla and the Wide Field Imager (ESO Programme 63.N-0054). We covered the entire Abell radius of the Norma cluster for the purpose of measuring the -band luminosity function (see also Fig. 6). This optical as well as the near-infrared , and luminosity function of the Norma cluster will be presented in a separate paper in this series.

WKK 6176 is located close to the core of the Norma cluster. In Fig. 6 it can be found at (RA, DEC) (16.22425∘, –60.76397∘), to the lower-left of the right-most X-ray contours (aligned with the virtual extension of the X-ray subgroup). A close-up of WKK 6176 is shown in Fig. 10 where we have displayed the -band image in a field of view of arcminutes. Given the low Galactic latitude of the Norma cluster () and proximity to the Galactic bulge (only 35∘ away), a large number of stars are superimposed on the galaxy images. Reliable photometry can only be obtained after careful removal of the many foreground stars. We used the KILLALL routine developed by Buta & McCall (1999) within the IRAF222IRAF is distributed by the National Optical Astronomy Observatories, which are operated by the Association of Universities for Research in Astronomy, Inc., under cooperative agreement with the National Science Foundation. environment to remove this stellar contamination. Fig. 10 illustrates the effectiveness of this star-removal procedure for the Norma cluster galaxy WKK 6176 (compare the right-hand panel of Fig. 10 to the original image). It also reveals numerous striking low-brightness filaments to the west of WKK 6176, appearing to stream away from WKK 6176 at a position angle of 125∘. Several bright knots (distinctly different from the Galactic foreground pollution) appear within these filaments. The low surface brightness filaments are aligned with the X-ray tail (Sun et al. 2006), but are not only confined to the region of the X-ray tail. For comparison, we have indicated the direction of the major axis of the E/SO galaxy population with the diagonal marker in Fig. 10.
WKK 6176 is a low-redshift equivalent of the two recently detected spiral galaxies in massive rich clusters (Abell 2667 and Abell 1689) at which show clear evidence for galaxy transformation (Cortese et al. 2007). Interestingly, WKK 6176 is located at a similar projected distance from the centre of the Norma cluster (0.28 Mpc) as the two high-redshift spirals in Abell 2667 and Abell 1689, which lie at 0.34 h Mpc and 0.24 h Mpc from their respective cluster centre.
A full investigation into the properties of WKK 6176 as derived from multiwavelength photometry (), spectroscopy, and galaxy evolution modelling (Fritze-von Alvensleben & Woudt 2006), and its implications for galaxy evolution in dense environments will be presented elsewhere.
4.2 WKK 6305: the head-tail radio continuum source
| Galaxy | Observational characteristic | Pos. angle |
|---|---|---|
| WKK 6176 | – 70 kpc X-ray tail | 129∘ |
| – Optical filaments | 125∘ | |
| WKK 6269∗ | – Central cD galaxy | 128∘ |
| WKK 6305 | – 500 kpc radio-continuum tail | 108∘ |
∗ The position angle quoted here for WKK 6269 is a mean
position angle as determined from GALFIT (Peng et al. 2002)
isophotal fitting of deep -band imaging.
Another peculiar galaxy in the Norma cluster is WKK 6305, also known as PKS 1610-605 (Jones & McAdam 1996). It is located at a similar distance from the centre of the cluster (0.29 Mpc) as WKK 6176. In Fig. 11 we show an overview of the central region with the same field of view as Fig. 6. The galaxy distribution of confirmed cluster members and the X-ray subgroup are as before, but now the radio continuum emission of WKK 6269 and WKK 6305 at 843 MHz are overplotted (reproduced from Jones & McAdam 1992). WKK 6305 corresponds to the head-tail source visible in Fig. 11. The tail length of 26′ ( 500 kpc at the distance of the Norma cluster) represents one of the longest radio continuum tails observed. The position angle of the tail is 108∘ (Jones & McAdam 1996) and is, as before with the X-ray tail of WKK 6176, closely aligned with the elongated (E/S0) galaxy distribution in the cluster.

5 Discussion
The dynamical analysis of the Norma cluster presented here has revealed a significant amount of subclustering in this nearby rich cluster, ranging from the central X-ray group to the two spiral-rich subgroups further from the core of the cluster. Even though the X-ray group did not show up in the dynamical analysis, the large peculiar velocity of the cD galaxy, whose radio lobes appear to ‘embrace’ the X-ray contours of this central group, is a tell-tale sign of an ongoing merger. The large discrepancy between and the mass determined from the virial theorem (where ) is an independent indication of the presence of a spatially-separated subcluster of substantial mass. Significant subclustering is not unusual for rich and massive clusters; Colless & Dunn (1996) in their detailed dynamical analysis of the archetypical rich Coma cluster also revealed the presence of an ongoing merger.
The galaxy distribution in the Norma cluster is clearly elongated, with a position angle (in equatorial coordinates) ranging between 116∘ (for the central part) and 105∘ (for the overall distribution). It should be emphasized that this observed elongation is not an artefact of selective Galactic extinction effects at this low Galactic latitude. The position angle of the major axis of the Norma cluster, as indicated by the arrows in Fig. 8, runs nearly perpendicular to the lines of constant Galactic foreground extinction (compare with Fig. 2). The elongated galaxy distribution is aligned with the major large-scale structure in this region as can be seen in Fig. 1. Such an alignment is not unexpected within the cluster-rich GA environment (Binggeli 1982).
Within the cluster itself, various galaxies show clear evidence for interactions with the intracluster medium. An overview of these galaxies and their defining characteristics is given in Table 5. The defining features of these galaxies are strongly aligned with the general galaxy distribution of the cluster. In the case of WKK 6176 and WKK 6305, they are X-ray/optical and radio continuum tails, respectively, whereas for WKK 6269 (the central cD galaxy) the major axis of the galaxy is aligned with the cluster (see Table 5).
6 Conclusion
The Norma cluster (ACO 3627) is a nearby, rich and massive cluster – on par with the more distant Coma cluster – which resides at the bottom of the potential well of the Great Attractor. The galaxy distribution of the cluster members shows a clear elongation which is aligned with the main wall-like structures of the GA. Despite the relaxed appearance of the early-type galaxy population in the Norma cluster, a large amount of subclustering is present. We have identified two spiral-rich subclusters (Norma A and B) in addition to the previously identified central (X-ray) subcluster (Norma minor). The ongoing merger of the latter with the main cluster (Norma major) is assumed to be responsible for the large peculiar motion of the central cD galaxy.
The proximity of the Norma cluster offers an excellent opportunity to study the interaction of cluster members such as WKK 6176 with the intracluster medium at high resolution and sensitivity.
Acknowledgments
We thank J. Pinkney for providing his cluster substructure analysis programme and M. McCall for the use of his KILLALL routine. This research has made use of the NASA/IPAC Extragalactic Database (NED) which is operated by the Jet Propulsion Laboratory, California Institute of Technology, under contract with the National Aeronautics and Space Administration. PAW, RCKK and APF kindly acknowledge funding from the National Research Foundation.
References
- [1] Abell G.O., Corwin H.G., Olowin R.P., 1989, ApJS, 70, 1
- [2] Bautz L.P., Morgan W.W., 1970, ApJ, 162, L149
- [3] Beers T.C., Flynn K., Gebhardt K., 1990, AJ, 100, 32
- [4] Binggeli B., 1982, A&A, 107, 338
- [5] Bird C.M., 1995, ApJ, 445, L81
- [6] Böhringer H., Neumann D.M., Schindler S., Kraan-Korteweg R.C., 1996, ApJ, 467, 168
- [7] Burns J.O., 1998, Science, 280, 40
- [8] Buta R.J., McCall M.L., 1999, ApJS, 124, 33
- [9] Cardelli J.A., Clayton G.C., Mathis J.S., 1989, ApJ, 345, 245
- [10] Colless M., Dunn A.M., 1996, ApJ, 458, 435
- [11] Cortese L., Marcillac D., Richard J., Bravo-Alfero H., Kneib J.-P., et al., 2007, MNRAS, 376, 157
- [12] Dekel A., 1994, ARA&A, 32, 371
- [13] Dressler A., 1988, ApJ, 329, 519
- [14] Dressler A., Shectman S.A., 1988, AJ, 95, 985
- [15] Dressler A., Faber S.M., Burstein D., Davies R.L., Lynden-Bell D., Terlevich R.J., Wegner G., 1987, ApJ, 313, 37
- [16] Ebeling H., Mullis C.R., Tully R.B., 2002, ApJ, 580, 774
- [17] Einasto M., Tago E., Jaaniste J., Einasto J., Andernach H., 1997, A&AS, 123, 119
- [18] Erdoğdu P., Lahav O., Huchra J.P., Colless M., Cutri R.M., et al., 2006, MNRAS, 373, 45
- [19] Fairall A.P., Woudt P.A., Kraan-Korteweg R.C., 1998, A&AS, 127, 463
- [20] Fritze-v. Alvensleben U., Woudt P.A., 2006, in Whitelock P.A., Dennefeld M., Leibundgut B., eds, Proc. IAU Symposium 232, Scientific Requirements for Extremely Large Telescopes. Cambridge University Press, Cambridge, p. 223
- [21] Hudson M.J., 1993a, MNRAS, 265, 43
- [22] Hudson M.J., 1993b, MNRAS, 265, 72
- [23] Hudson M.J., Smith R.J., Lucey J., Branchini E., 2004, MNRAS, 352, 61
- [24] Jahoda K., Mushotzky R.F., 1989, ApJ, 346, 638
- [25] Jones P.A., McAdam W.B., 1992, ApJS, 80, 137
- [26] Jones P.A., McAdam W.B., 1996, MNRAS, 282, 137
- [27] Kocevski D.D., Ebeling H., 2006, ApJ, 645, 1043
- [28] Kolatt T., Dekel A., Lahav O., 1995, MNRAS, 275, 797
- [29] Kraan-Korteweg R.C., Jarrett T., 2005, in Fairall A.P., Woudt P.A., eds, ASP Conf. Ser. Vol. 329, Nearby Large-Scale Structures and the Zone of Avoidance. Astron. Soc. Pac., San Francisco, p. 119
- [30] Kraan-Korteweg R.C., Lahav O., 2000, A&ARv, 10, 211
- [31] Kraan-Korteweg R.C., Fairall A.P., Balkowski C., 1995, A&A, 297, 617
- [32] Kraan-Korteweg R.C., Staveley-Smith L., Donley J., Koribalski B., Henning P.A., 2005, in Colless M., ed, Proc. IAU Symposium 216, Maps of the Cosmos. Astron. Soc. Pac., San Francisco, p. 203
- [33] Kraan-Korteweg R.C., Woudt P.A., Cayatte V., Fairall A.P., Balkowski C., Henning P.A., 1996, Nature, 379, 519
- [34] Lewis I.J., Cannon R.D., Taylor K., Glazebrook K., Bailey J.A., et al., 2002, MNRAS, 333, 279
- [35] Lucey J., Radburn-Smith D., Hudson M.J., 2005, in Fairall A.P., Woudt P.A., eds, ASP Conf. Ser. Vol. 329, Nearby Large-Scale Structures and the Zone of Avoidance. Astron. Soc. Pac., San Francisco, p. 21
- [36] Lynden-Bell D., Lahav O., 1988, in Rubin V.C., Coyne G.V., eds., Large-Scale Motions in the Universe. Princeton University Press, Princeton, New Jersey, p. 199
- [37] Lynden-Bell D., Faber S.M., Burstein D., Davies R.L., Dressler A., Terlevich R.J., Wegner G., 1988, ApJ, 326, 19
- [38] Nagayama T., Woudt P.A., Nagashima C., Nakajima Y., Kato D., et al., 2004, MNRAS, 354, 980
- [39] Oegerle W.R., Hill J.M., 2001, AJ, 122, 2858
- [40] Owen F.N., Rudnick L., 1976, ApJ, 205, 1
- [41] Peng C.Y., Ho L.C., Impey C.D., Rix H.-W., 2002, AJ, 124, 266
- [42] Pimbblet K.A., Roseboom I.G., Doyle M.T., 2006, MNRAS, 368, 651
- [43] Pinkney J., Rhee G., Burns J.O., Hill J.M., Oegerle W., Batuski D., Hintzen P., 1993, ApJ, 416, 36
- [44] Pinkney J., Roettiger K., Burns J.O., Bird C.M., 1996, ApJS, 104, 1
- [45] Proust D., Quintana H., Carrasco E.R., Reisenegger A., Slezak E., et al. 2006, A&A, 447, 133
- [46] Radburn-Smith D.J., Lucey J.R., Woudt P.A., Kraan-Korteweg R.C., Watson F.G., 2006, MNRAS, 369, 1131
- [47] Rines K. Geller M.J., Kurtz M.J., Diaferio A., 2003, AJ, 126, 2152
- [48] Rowan-Robinson M., Lawrence A., Saunders W., Crawford J., Ellis R., et al., 1990, MNRAS, 247, 1
- [49] Scaramella R., Baiesi-Pillastrini G., Chincarini G., Vettolani G., Zamorani G., 1989, Nature, 338, 562
- [50] Schlegel E.M., Finkbeiner D.P., Davis M., 1998, ApJ, 500, 525
- [51] Skrutskie M.F., Cutri R.M., Stiening R., Weinberg M.D., Schneider S., et al., 2006, AJ, 131, 1163
- [52] Springel V., White S.D.M., Jenkins A., Frenk C.S., Yoshida N., et al., 2005, Nature, 435, 629
- [53] Sun, M., Jones, C., Forman, W., Nulsen, P.E.J., Donahue, M., Voigt, G.M., 2006, ApJ, 637, L81
- [54] Tamura T., Fukazawa Y., Kaneda H., Makishima K., Tashiro M., Tanaka Y., Böhringer H., 1998, PASJ, 50, 195
- [55] Tonry J.L., Blakeslee J.P., Ajhar E.A., Dressler A., 2000, ApJ, 530, 625
- [56] Vollmer B., Cayatte V., van Driel W., Henning P.A., Kraan-Korteweg R.C., Balkowski C., Woudt P.A., Duschl W.J., 2001, A&A, 369, 432
- [57] Woudt P.A., 1998, PhD Thesis, University of Cape Town
- [58] Woudt P.A., Kraan-Korteweg R.C., 2001, A&A, 380, 441
- [59] Woudt P.A., Kraan-Korteweg R.C., Fairall A.P., 1999, 352, 39
- [60] Woudt P.A., Cayatte V., Kraan-Korteweg R.C., Balkowski C., Felenbok P., 2004, A&A, 415, 9