2University of Cukurova, Turkey
3Institute of Nuclear Physics, Krakow, Poland
4CERN, Geneva, Switzerland
5University of Athens, Hellas
6Institute of Nuclear Research, Moscow, Russia
7NRC “Demokritos” INP, Hellas
8Northeastern University, Boston, USA
9ITEP, Moscow, Russia
Performance Studies of Prototype II for the CASTOR forward Calorimeter at the CMS Experiment
Abstract
We present results of the performance of the second prototype of the CASTOR quartz-tungsten sampling calorimeter, to be installed in the very forward region of the CMS experiment at the LHC. The energy linearity and resolution, as well as the spatial resolution of the prototype to electromagnetic and hadronic showers are studied with 20-200 GeV electrons, 20-350 GeV pions, and 50, 150 GeV muons from beam tests carried out at CERN/SPS in 2004. The responses of the calorimeter using two different types of photodetectors (avalanche photodiodes APDs, and photomultiplier tubes PMTs) are compared.
1 Introduction
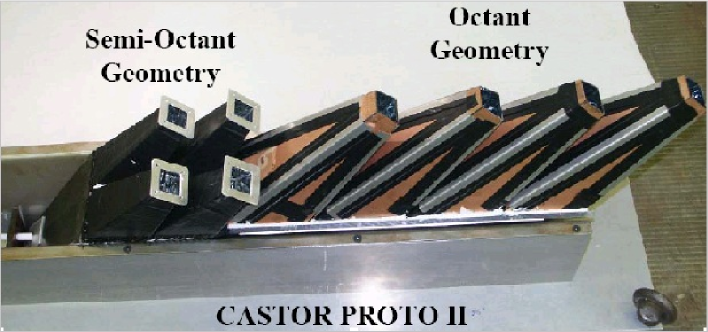
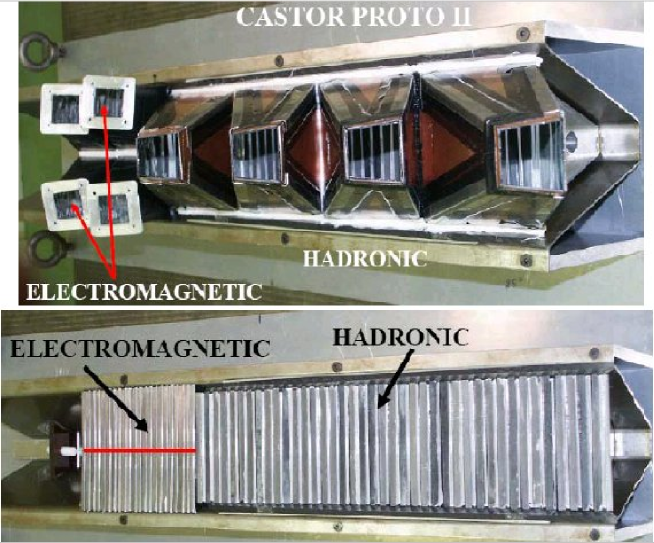
The CASTOR (Centauro And Strange Object Research) detector is a quartz-tungsten sampling calorimeter, which has been proposed for the study of the very forward rapidity region in heavy ion and proton-proton collisions in the multi-TeV range at the LHC castor . Its main physics motivation is to complement the nucleus-nucleus physics programme, focused mainly in the baryon-free region at midrapidity ptdr . CASTOR will be installed in the CMS experiment at 14.38 m from the interaction point, covering the pseudorapidity range 5.2 6.6 and will, thus, contribute not only to the heavy ion programme, but also to diffractive and low- physics in pp collisions castor_forw . The results of the beam test and simulation studies with CASTOR prototype I castor_protoI prompted us to construct a second prototype using quartz plates, avalanche photodiodes (APDs) as well as photomultiplier tubes (PMTs), and air-core light-guides with inner reflective foil (Dupont polyester film reflector coated with AlO and reflection enhancing dielectric layer stack SiO2+TiO2). In addition, we tested a new semi-octant ( = 22.5∘) geometry of the readout unit in the electromagnetic section. The beam tests were carried out in the H2 line at the CERN SPS in 2004 using beams of electrons, pions and muons. The prototype II calorimeter consists of an electromagnetic (EM) and a hadronic (HAD) section, built in an octant sector (Fig. 1). Both calorimeters are constructed with successive layers of tungsten plates as absorber and fused silica quartz plates as active medium. The EM part (14 cm length) is further divided into two semi-octant sectors and is longitudinally segmented into 2 sections, so that there are 4 independent readout units in total. The HAD part (40 cm length) retains the octant geometry of prototype I and is longitudinally segmented into 4 sections. The Čerenkov light produced by the passage of relativistic particles through the quartz medium is collected in sections along the length of the calorimeters and focused by air-core light guides onto the photodetector devices, APDs or PMTs.
2 Technical description
The CASTOR detector is a Čerenkov-effect based calorimeter with tungsten absorber and quartz plates as active material. The main advantages of quartz calorimeters are their radiation hardness, the fast response and the compact detector dimensions mavro very well adapted for the experimental conditions encountered in the very forward region at the LHC. A detailed description of the operation principle and, in particular, of the light-guide performances have been provided in reference castor_protoI . In section 2.1 we describe the active (quartz) and passive (tungsten) materials of the calorimeter considered in this second beam test. Section 2.2 discusses the characteristics of the two types of photodetectors (photomultipliers and avalanche photodiodes) tested.
2.1 Tungsten - Quartz plates
The calorimeter is constructed from layers of tungsten (W: = 10.0 cm, = 0.365 cm, density= 18.5 g/cm3) plates as absorber and fused silica quartz (Q) plates as active medium (see Fig. 2). For the electromagnetic section, the W-plates have a thickness of 3 mm and the Q-plates 1.5 mm. For the hadronic section, the W- and Q-plates have a larger thicknesses of 5 mm and 2 mm, respectively. The W/Q-plates are inclined 45∘ with respect to the direction of the impinging particles, in order to maximize the Čerenkov light output in the quartz. Each individual combination of W/Q-plates is called a sampling unit (SU). The large sides of the Q plates were covered with Tyvek paper, to protect them from damage by the tungsten plates and also to diffuse back the escaping light. The perimeter sides – except the top one – were painted with white reflecting paint. The top edge of the W plates had just a machined finish.
In the EM section, each sampling unit (SU) corresponds to 1.218 , or 4.8810-2 . Each readout unit (RU) consists of 11 SUs and is 13.4 , or 0.536 deep. The EM section is divided in two successive RUs and has a total length of 26.8 and 1.072 lengths. In the hadronic section, a sampling unit corresponds to 7.96. Each readout unit consists of 10 SUs and is 0.796 deep. The HAD section has 4 RUs, corresponding to 3.186 .
In total, the whole prototype has 4.26 . For some runs with pions, we inserted an additional inactive absorber of 1.03 in front of the calorimeter, in order to make the EM section act as a hadronic one, increasing the total depth of the prototype to 5.3.
2.2 Photodetectors
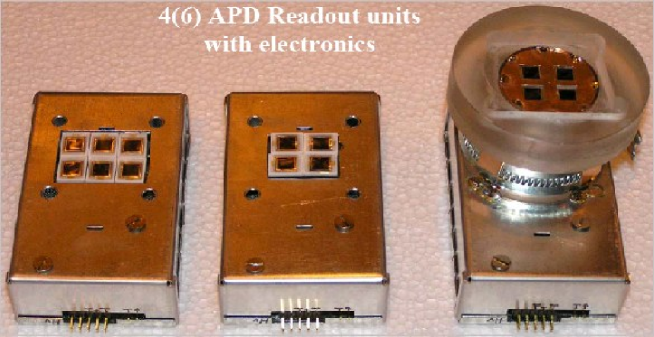
The Čerenkov light emitted by the quartz plates is collected and transmitted to photodetector devices through air-core light-guides. All light guides of Prototype-II were equipped with Dupont [AlO+ SiO2+TiO2] reflective foil with the same characteristics discussed in castor_protoI . As photodetectors we used a matrix of 4 or 6 Hamamatsu S8148 APDs (developed originally for the CMS electromagnetic calorimeter apd1 ), as well as two different types of PMTs. The total area of the APDs was 1 cm2 (for 4 APDs) and 1.5 cm2 (for 6 APDs), see Fig. 3. The phototubes were positioned only on one side of the EM section of the prototype, for comparison with the APDs during the electron beam tests. The two types of PMTs used were respectively: (i) a Hamamatsu R7899 PMT, and (ii) a radiation-hard multi-mesh, small size PMT FEU-187 from RIE St. Petersburg, with cathode area 2 cm2 castor_protoI .
3 Beam tests
The beam test of prototype II took place in October 2004 at the H2 beam line of the SPS at CERN. Electron, hadron () and muon () beams of several energies were used. The energy responses (linearity, resolution) of the electromagnetic and hadronic calorimeters were obtained with energy scans with: 20-200 GeV electrons, 20-350 GeV pions, as well as 50, 150 GeV muons. The calorimeter prototype was placed on a platform movable with respect to the beam in both horizontal and vertical () directions (see Figure 4). A telescope of finger scintillator detectors and wire chambers were installed upstream of the prototype, giving precise information on the position of each particle hitting the calorimeter. In this way, we were able to know the beam profile and also select particular regions of the beam profile for the spatial resolution analyses. We note that the typical visible transverse sizes of hadronic and electromagnetic showers in quartz calorimeters are (5-10 cm), (10 mm) resp. (for 95% signal containement), i.e. are a factor 3 to 4 times narrower than those in “standard” (scintillation) calorimeters mavro .
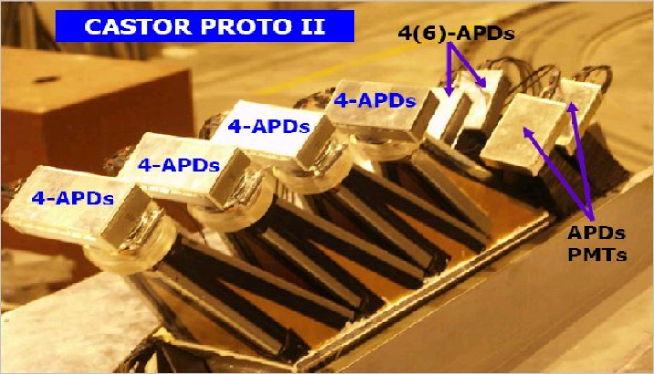
Figure 5 shows the two semi-octants of the electromagnetic (blue) and the octant of the hadronic (red) sections, as seen projected onto a plane at 45∘ with respect to the beam axis. We notice that there is no complete overlap of the two sections, due to the different sizes of the W/Q-plates available. The horizontal and vertical numbers correspond to distances along the plate ( coordinates) of the points used for the horizontal and vertical scans.
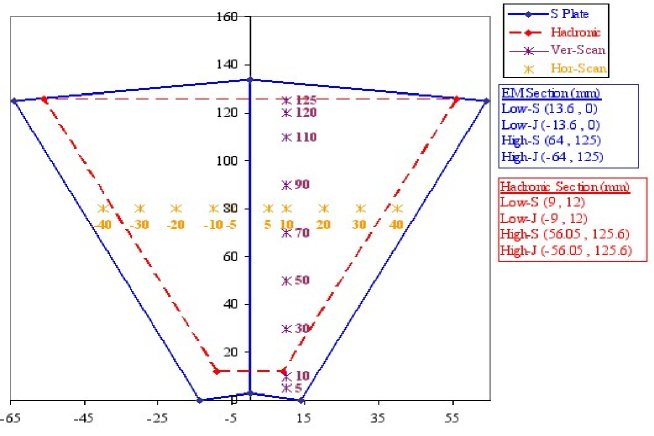
Table 1 lists the () coordinates of the impact points of the horizontal and vertical scans for both electron and hadron beams. The location of these points on the 45∘ projection of the semi-octant sectors is shown in Figure 5. The beam profile for each point was subdivided into a number of smaller parts, each of diameter 1-2 mm, so that we obtained more impact points in total.
| Electron SCAN | |||||
|---|---|---|---|---|---|
| Vertical Scan | Horizontal Scan | ||||
| A | 10 | 5 | A’ | -40 | 80 |
| B | 10 | 10 | B’ | -30 | 80 |
| C | 10 | 30 | C’ | -20 | 80 |
| D | 10 | 50 | D’ | -10 | 80 |
| E | 10 | 70 | E’ | -5 | 80 |
| F | 10 | 90 | F’ | 5 | 80 |
| G | 10 | 110 | G’ | 10 | 80 |
| H | 10 | 120 | H’ | 20 | 80 |
| I | 10 | 125 | I’ | 30 | 80 |
| J’ | 40 | 80 | |||
| Hadron SCAN | |||||
| Vertical Scan | Horizontal Scan | ||||
| A | 10 | 30 | A’ | -30 | 80 |
| B | 10 | 50 | B’ | -20 | 80 |
| C | 10 | 70 | C’ | -10 | 80 |
| D | 10 | 90 | D’ | 0 | 80 |
| E | 10 | 110 | E’ | 10 | 80 |
| F | 10 | 120 | F’ | 20 | 80 |
| G’ | 30 | 80 |
4 Electron beam tests
Electron beams of energy 20-200 GeV were used to test the energy linearity and resolution as well as the position resolution of the EM section of the prototype.
4.1 Energy response
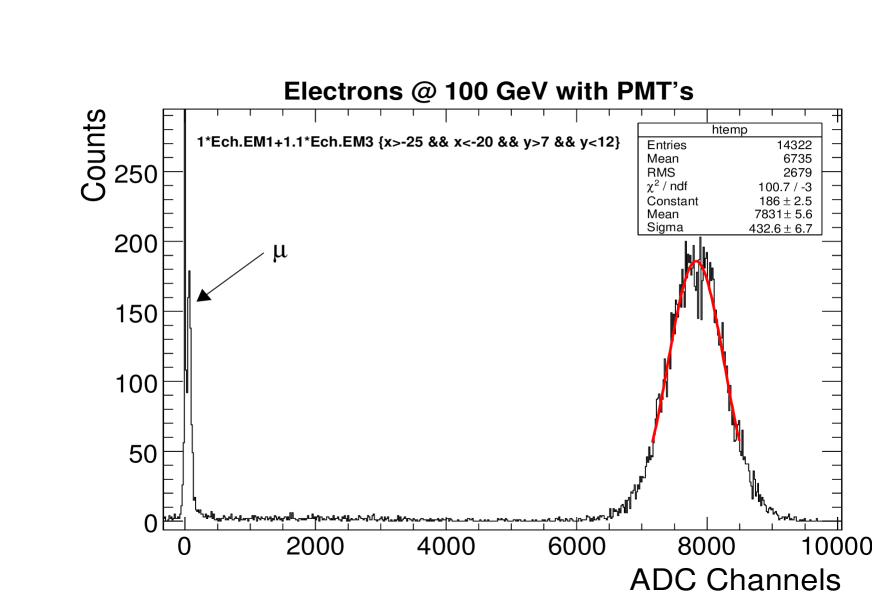
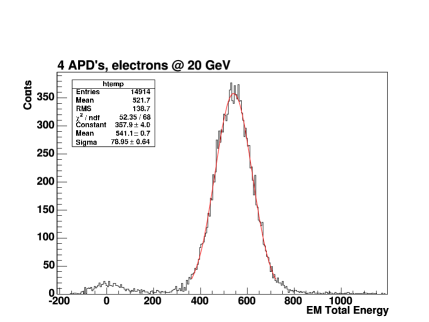
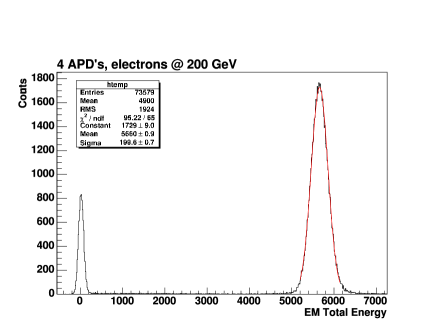
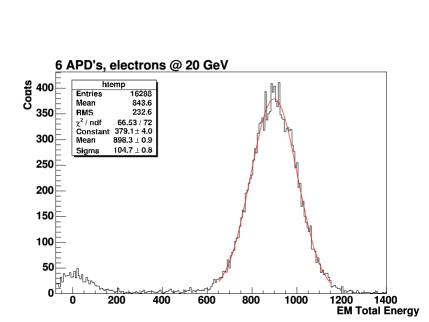
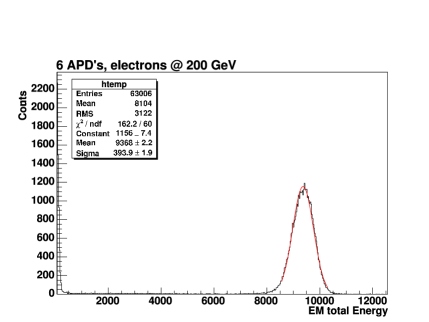
A typical spectrum measured with 100 GeV electrons incident on the EM section of the prototype, equipped with PMTs, is shown in Figure 6. Residual muons in the electron beam are also seen as minimum ionizing particle (MIPs) just above the pedestal. The energy response of the calorimeter is found to be Gaussian for all energies. Figure 7 shows the energy response for 20 and 200 GeV electron beams, obtained with 4 and 6 APDs respectively.
Energy Linearity: To study the linearity of the EM calorimeter response as a function of electron-beam energy, a central point (Fig. 8) in the two different azimuthal sectors has been exposed to beams of various energies. The distributions of signal amplitudes, after introducing the cuts on the spatial profile of the beam (a circle of radius 2 mm), are in most cases symmetric and well fitted by a Gaussian function. The peak signal position, obtained for the three photodetector configurations, is plotted as a function of the beam energy in Figure 9.
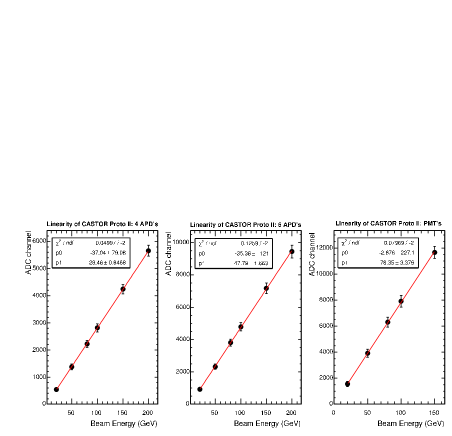
For all configurations, the calorimeter response is found to be linear in the energy range explored. The average signal amplitude, expressed in units of ADC channels, is satisfactorily fitted by the formula:
| (1) |
where the energy E is in GeV. The fitted values of the parameters for each configuration
are shown in the insets of each plot in Fig. 9.
Energy Resolution: The relative energy resolution of the calorimeter has been studied by plotting the normalized width of the Gaussian signal amplitudes, , with respect to the incident beam electron energy, (GeV) and fitting the data points with two different functional forms castor_protoI :
| (2) | |||||
| (3) |
where the indicates that the terms are added in quadrature. In principle, three general terms contribute to the energy resolution in calorimeters:
-
1.
The constant term, , related to imperfections of the calorimetry, signal generation and collection non-uniformity, calibration errors and fluctuations in the energy leakage, which limit the resolution at high energies.
-
2.
The stochastic or sampling term, , due to intrinsic shower photon statistics, characterizes the fluctuations in the signal generating process.
-
3.
The noise term, , includes the electronic noise contribution from capacitance and dark current which (due to its steep dependence) is only important for low energies.
Figure 10 shows the fit to the data with expressions (2) and
(3). Both parametrizations satisfactorily fit the data. In Table 2
we summarize the fit parameters for both parameterizations and the three readout configurations.
The measured stochastic term is in the range 36% - 54%. We notice too that
the constant term is close to zero for all options. It should be noted that though
the APDs are very sensitive to both voltage and temperature changes, there was no
stabilization used for this test.
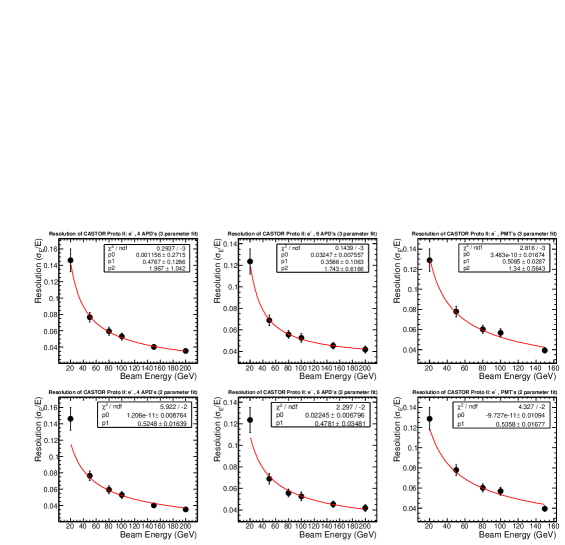
| Photodetector(s) | Fit function | (GeV1/2) | (GeV) | ndf | |
|---|---|---|---|---|---|
| 4 APDs | (2) | 1.2e-11 8.7e-3 | 0.525 0.0163 | - | 5.92/4 |
| 4 APDs | (3) | 1.1e-3 0.21 | 0.477 9.65e-2 | 1.97 0.70 | 0.29/3 |
| 6 APDs | (2) | 2.24e-2 6.80e-3 | 0.478 0.0348 | - | 2.30/4 |
| 6 APDs | (3) | 3.25e-2 7.56e-2 | 0.358 0.106 | 1.74 0.62 | 0.14/3 |
| PMTs | (2) | 9.7e-11 1.1e-2 | 0.536 0.0168 | - | 4.33/3 |
| PMTs | (3) | 3.5e-10 1.7e-2 | 0.508 0.029 | 1.34 0.56 | 2.82/2 |
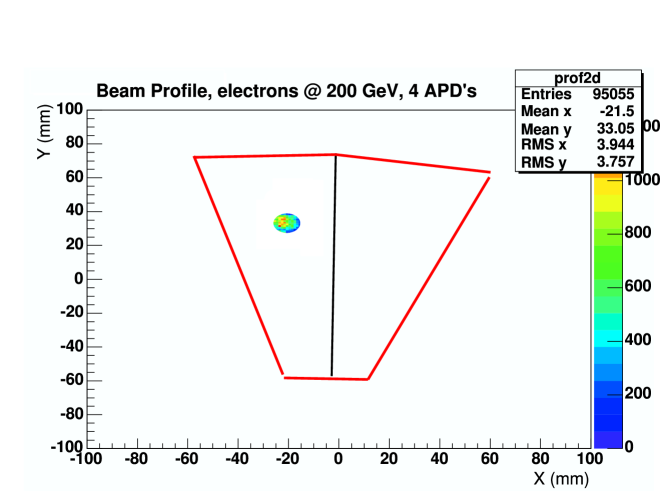
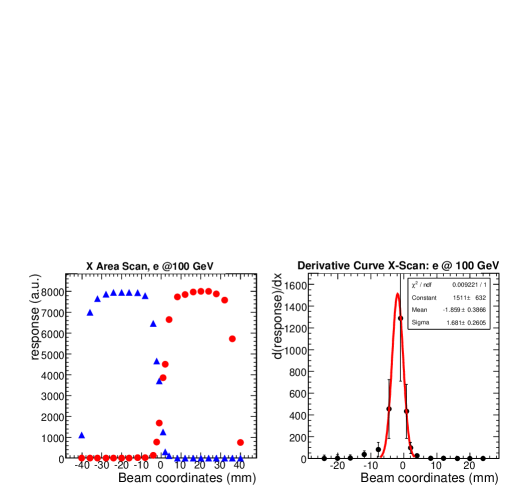
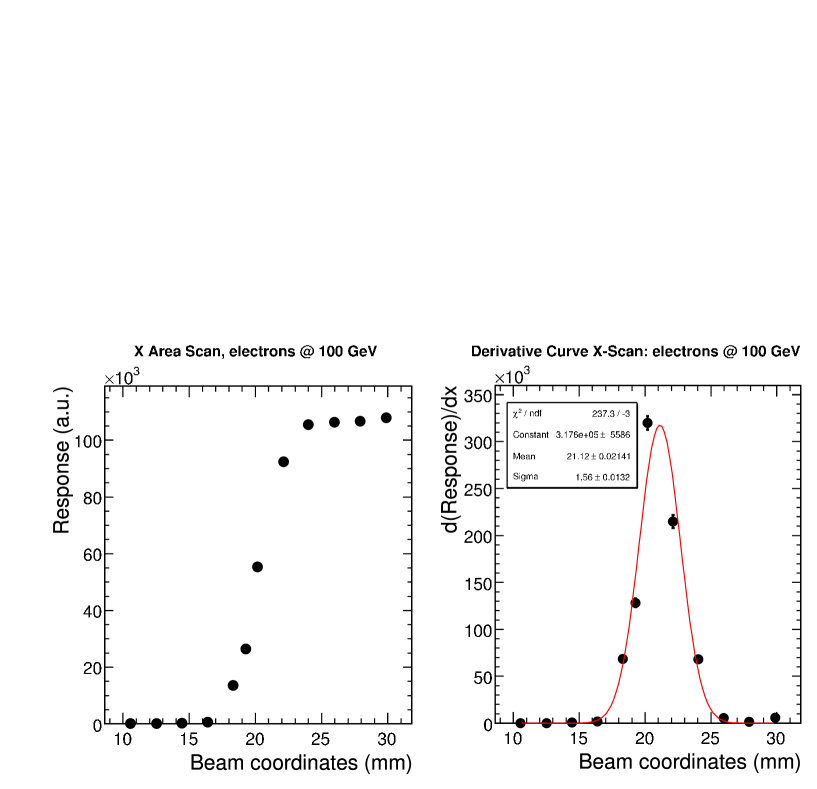
Spatial Response: The purpose of the area scanning was to check the uniformity of the EM calorimeter response to electrons hitting at different points on the sector area, as well as to assess the amount of edge effects and lateral leakage from the calorimeter, which could lead to cross-talk between neighboring sectors. Figure 8 shows the typical profile of the electron beam hitting the left semi-octant of the prototype. The width of the EM shower and the percentage of the containment close to the edge were estimated by varying the horizontal and vertical hit positions of the incident beam according to the () coordinates shown in Fig. 8 and listed in Table 1.
The results of the horizontal-scan analysis are shown in Figure 11 for the 4 APDs readout configuration. Figure 11(a) shows the response of the two adjacent (left-right) EM semi-octants as the beam impact point moves across the front face of the calorimeter. The sigmoid nature of each response curve is evident. In Figure 11(b), the derivative of the response is calculated, giving the width of the electromagnetic shower. We observe that one standard deviation amounts to 1.7 mm.
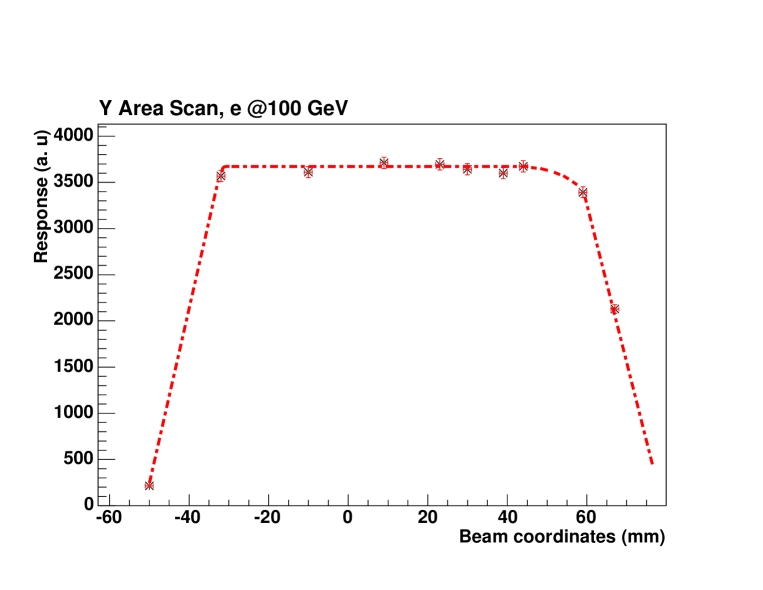
The vertical-scan covered the entire height of the semi-octant EM sector, with impact points shown in Figure 5 and listed in Table 1. The results of this scan are shown in Figure 12. We notice the abrupt fall at the lower end of the sector past the point ”A” and the more gradual fall at the upper end, the later due to the shower particles directly hitting the light guide.
4.2 Pion beam tests
Pions of energy 20–350 GeV were used for the study of the hadronic
energy and position responses of the CASTOR prototype II. In order to
increase the interaction depth of the calorimeter, an inactive absorber
of 1.03 was inserted in front of the EM calorimeter, increasing
the total depth to 5.3. This had also as a result to make the two
first (EM) RUs effectively act, in depth, as part of the hadronic section.
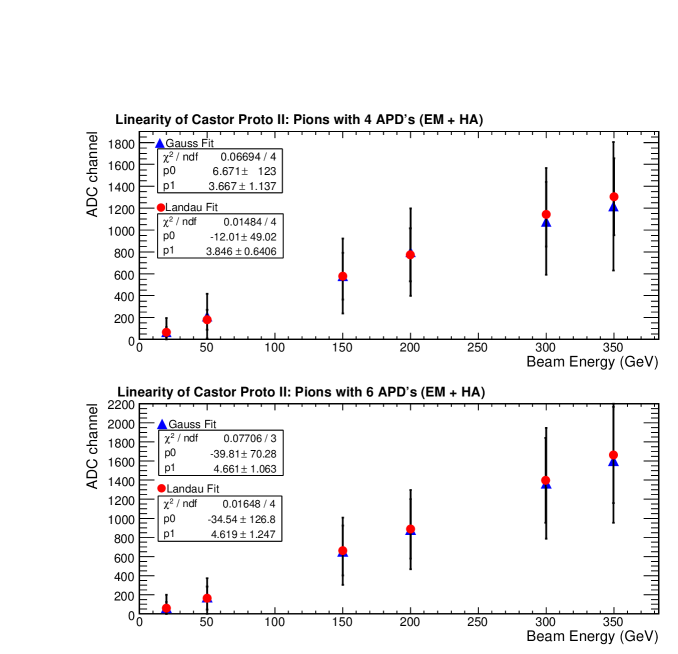
Energy Response: Typical spectra, obtained with 200 GeV pions incident on the prototype, are shown in Figure 13 where the distribution of the total energy measured in both (EM and HAD) parts of the calorimeter is plotted. During the different tests, the electromagnetic sections were equipped with 4 or 6 APDs and the hadronic ones had 4 APDs in its readout units for all runs. The total depth of the prototype (5.3) was not enough to contain the showers produced by the pion beams. We see that there is a long tail at high energies indicating the leakage of energy from the back of the calorimeter. However, no quantitative measurements of the leakage fraction were done at this stage. The peak of the total pion energy measured by the prototype was fitted with a Gaussian and a Landau curve. The fitting ranges correspond roughly to 1- (2-) around the peak for the Gaussian (Landau) distributions. We observe that the Landau parametrization fits the distribution better than the Gaussian one.
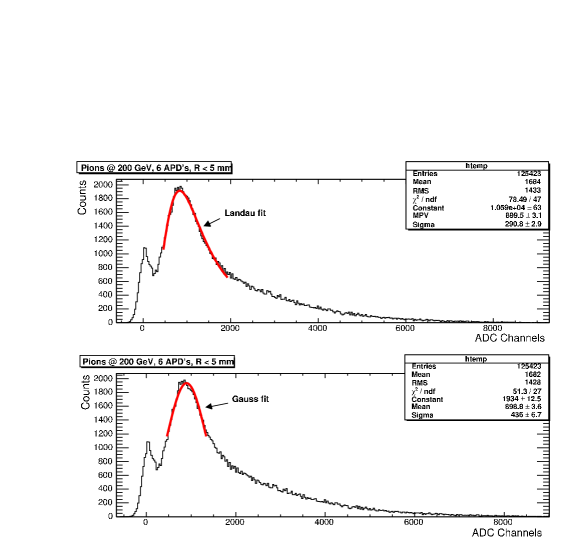
The energy response (position and width of the pion peak) was obtained by
fitting both Gaussian and Landau curves to the spectrum measured for all beam
energies. The corresponding hadronic energy linearity and resolution were thus
obtained.
Energy Linearity: Figure 14 shows the linearity of the CASTOR prototype to incident pions as obtained by measuring the total energy deposited in the calorimeter sections and correlating the position of the pion peak with each corresponding beam energy. At higher energies, the Landau fit gives higher response, as expected, and an overall smaller statistical error.
Energy Resolution:
The relative energy resolution of the calo-rimeter has been studied by fitting
the normalized width of the fitted signal amplitudes (peaks in Fig. 13),
, with respect to the incident pion beam energy, (GeV), with the two
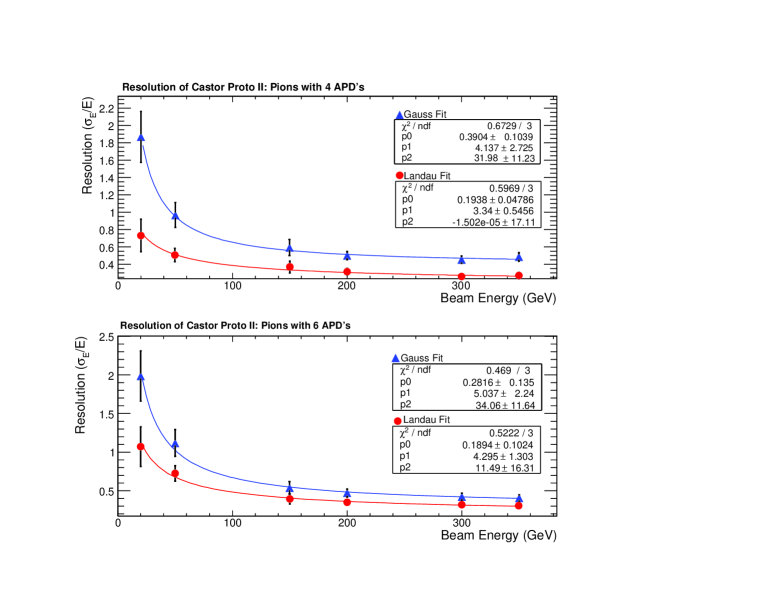
functional forms (2) and (3). Figure 15
shows the obtained energy resolution of the prototype for pions of energy up to
350 GeV with 6 (left) and 4 (right) APDs in the EM part of the calorimeter.
The blue points and line in Figure 15 show the resolution
when the pion energy distribution is fitted by a Gaussian curve. The red ones, when the
distribution is fitted by the Landau expression. We observe that the resolution is
much better when the Landau fit is employed. It should be noted that the length of the tested calorimeter is only 4.26 interaction lengths
(almost a factor 3 smaller than the planned length of the final CASTOR calorimeter)
and thus there is considerable energy leakage at the end even at low pion energies.
This does not permit an accurate estimation of the hadronic resolution.
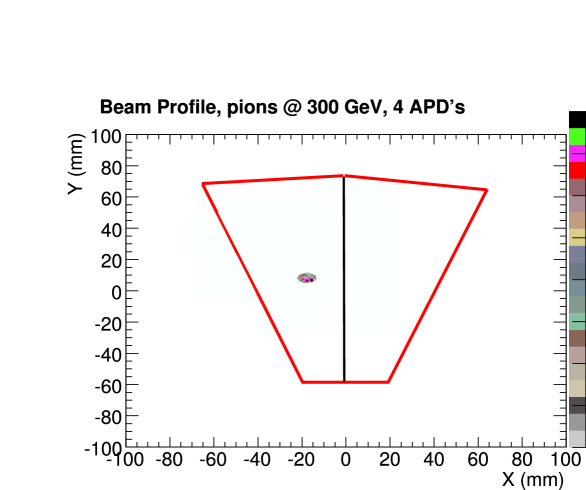
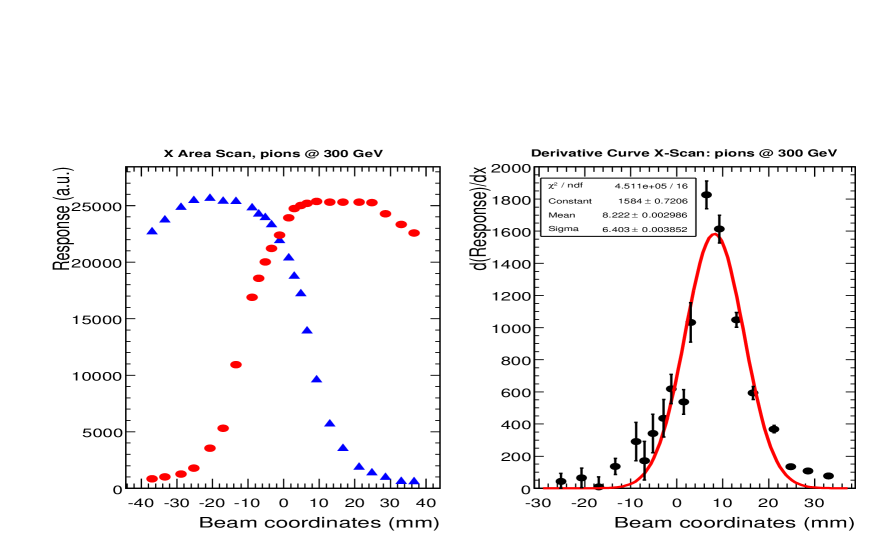
Spatial Response: Figure 16 shows the pion beam profile hitting the left semi-octant region of the prototype. We observe that the hadron beam is much more focused than the electron beam (see profile in Fig. 8). The spatial response of the prototype calorimeter to pions was obtained from the two EM semi-octant sectors, by moving the beam along the direction. The 1.03 inactive absorber was positioned in front of the calorimeter. The beam profile for each point was subdivided into a number of parts, each of diameter 5 mm, so that we obtained more impact points in total. Figure 17 shows the scan for pions of 300 GeV energy on the left and the derivative of this response with respect to on the right. The pion beam width has = 6.4 mm, considerably larger than the corresponding electromagnetic one ( = 1.7 mm, see Fig. 11), as expected.
5 Muon beam tests
Muon energy spectra at 50 and 100 GeV were measured with the electromagnetic sector, using the PMT readout configuration. Figure 18 shows the muon peak measured for the 50 GeV beam well separated from the pedestal at zero counts. The lineshape has been obtained with two different PMTs: Hamamatsu R7899 (Fig. 18a), and RIE FEU187 (18b). In Figure 18c, the sum of both EM readout units is shown.
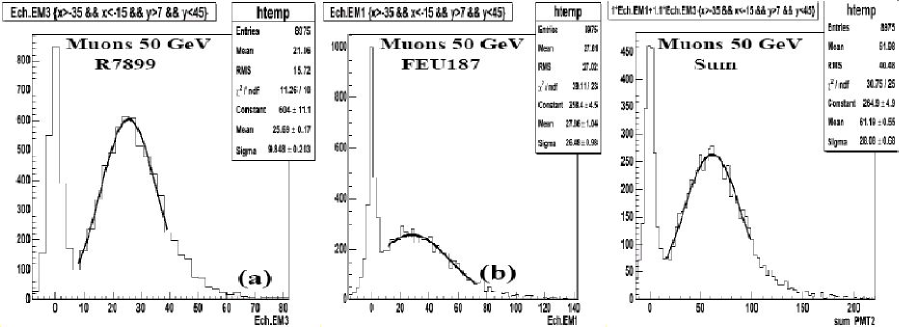
From Figure 18 we find that the Hamamatsu R7899 PMT performs much better than the RIE FEU187 one, in identifying the muon signal above the pedestal. A disadvantage of the R7899 PMT for this application is its large length, which prohibits its use, even in the semi-octant geometry.
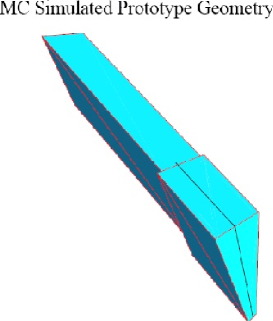
6 Monte Carlo simulation of prototype II
Fig. 19 shows the GEANT4 geant4 geometry of prototype II as implemented in the CMS software (OSCAR 6.3.5). The geometry of the electromagnetic section described in the simulations (XML-format) matches exactly that of the tested calorimeter.
We run simulations for 500 electron events with 7 different energies in the range = 20 -250 GeV and studied the corresponding response in terms of the number of photoelectrons produced. Figure 20 shows the simulated energy (a) linearity and (b) resolution of the prototype obtained assuming an overall efficiency (light transmission quantum efficiency) of about 65% for the APDs castor_protoI . The linearity of the energy response is consistent with the experimental data (Fig. 9), but the energy resolution is 2–3 times better than the beam test results (Fig. 21).
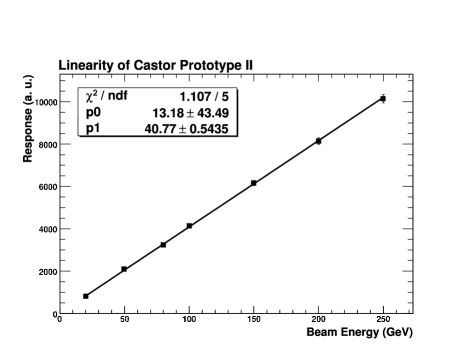
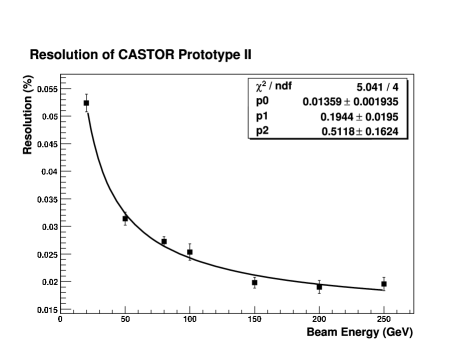
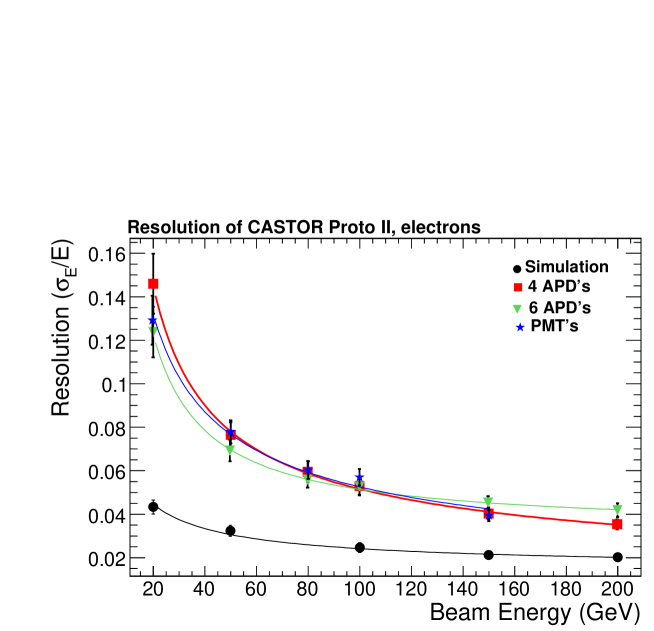
Figure 22 shows the -spatial response of the electromagnetic shower simulated in GEANT4. In the MC simulation, the electron beam has a radius of 1.5 mm, similar to the cut imposed in the analysis of the experimental data. The sigmoid curve is seen in Fig. 22a and its -derivative in Fig. 22b, from which we obtain the width of 1.56 mm. which is close to what one observes in the real data (Fig. 11b)
7 Summary
We have presented a detailed performance study of the energetic and spatial responses of a second prototype of the CASTOR quartz-tungsten calorimeter of the CMS experiment. The results have been obtained from beam tests at CERN-SPS with high-energy electrons (20-200 GeV), pions (20-350 GeV) and muons (50, 150 GeV) and two different types of photodetectors (APDs and PMTs) for the EM section of the calorimeter. The main conclusions of this study can be summarized as follows:
-
1.
EM Section: The semi-octant geometry has an efficient light-collection with 4 or 6 APDs. Due to the small height of the light-guide, a PMT readout can also be used, provided it is of small size. This has the advantage of higher gain (over the APD configurations), enabling the clear identification of the muon peak above the pedestal.
-
2.
HAD Section: The octant geometry has an efficient light-collection for the hadronic section. However, the large height of the associated light-guides precludes this configuration in the limited space available for the CASTOR calorimeter in the very forward region of the CMS experiment.
On the basis of physics concerns for both pp and heavy-ion interactions, the semi-octant geometry (which would correspond to 16 sectors covering full ) is, therefore, preferred. For this geometry, two reading-device options provide the desired performances: (i) 6 Hamamatsu-S8148 APDs per readout unit, and (ii) a small-size PMT, such as the RIE FEU-187. Both photodetectors should be tested/adapted for the radiation-harsh conditions of the CASTOR calorimeter (10-100MGy accumulated, to be compared e.g. to the 3kGy expected for the CMS ECAL APDs apd1 ). The relative merits and difficulties of each option will be further studied in detail before a final decision is reached.
8 Acknowledgments
This work is supported in part by the Secretariat for Research of the University of Athens and by the Polish State Committee for Scientific Research (KBN) SPUB-M nr. 620/E-77/SPB/CERN/P-03/DWM 51/2004-2006. D.d’E. acknowledges support from the 6th EU Framework Programme (contract MEIF-CT-2005-025073).
References
- (1) A.L.S. Angelis and A.D. Panagiotou, J.Phys.G23:2069-2080,1997; A.L.S. Angelis et al., hep-ex/9901038; A.L.S. Angelis et al., Nucl.Phys.Proc.Suppl. 97:227-230,2001.
- (2) S. Chatrchyan et al. [CMS Collab.], “High Density QCD with Heavy-Ions. CMS Physics Technical Design Report”, [CERN-LHCC 2007-009, CMS TDR 8.2-Add1], http://cdsweb.cern.ch/search?id=1019832
- (3) M. Albrow et al. [CMS and TOTEM Collaborations], “Prospects for Diffractive and Forward Physics at the LHC”, CERN/LHCC 2006-039/G-124, http://cdsweb.cern.ch/record/1005180
- (4) X. Aslanoglou et al., submitted to Nucl. Instr. Meth. A, arXiv:0706.2576.
- (5) G. Mavromanolakis, “Quartz fiber calorimetry and calorimeters,” arXiv:physics/0412123.
- (6) K. Deiters et al., Nucl. Instr. and Meth. A 461 (2001) 574; Z. Antunovic et al., Nucl. Instr. Meth. A537 (2005) 379
- (7) S. Agostinelli et al. [GEANT4 Collaboration], Nucl. Instr. Meth. A 506 (2003), p. 250.