The nature of the fluorescent iron line in V 1486 Ori
The fluorescent keV iron line provides information on cool material in the vicinity of hard X-ray sources as well as on the characteristics of the X-ray sources themselves. First discovered in the X-ray spectra of the flaring Sun, X-ray binaries and active galactic nuclei (AGN), the fluorescent line was also observed in a number of stellar X-ray sources. The young stellar object (YSO) V1486 Ori was observed in the framework of the Chandra Ultra Deep Project (COUP) as the source COUP 331. We investigate its spectrum, with emphasis on the strength and time variability of the fluorescent iron Kα line, derive and analyze the light curve of COUP 331 and proceed with a time-resolved spectral analysis of the observation. The light curve of V 1486 Ori shows two major flares, the first one lasting for ks with a peak X-ray luminosity of erg/s (dereddened in the keV band) and the second one – only partially observed – for ks with an average X-ray luminosity of erg/s (dereddened). The spectrum of the first flare is very well described by an absorbed thermal model at high temperature, with a pronounced 6.7 keV iron line complex, but without any fluorescent Kα line. The X-ray spectrum of the second flare is characterized by even higher temperatures ( keV) without any detectable keV Fe XXV feature, but with a very strong fluorescent iron Kα line appearing predominantly in the 20 ks rise phase of the flare. Preliminary model calculations indicate that photoionization is unlikely to account for the entire fluorescent emission during the rise phase.
Key Words.:
stars: early-type, activity – X-ray: stars1 Introduction
The COUP data set provides a nearly continuous 13 day long X-ray observation of the Orion nebula star forming region and is currently one of the best suited data sets for the exploration of the X-ray properties of large and homogeneous samples of young stars. Substantial analysis of this data set has already been performed (e.g. by Getman et al. 2005). In particular, Tsujimoto et al. (2005) carried out a systematic search for the occurrence of the fluorescent iron Kα line at 6.4 keV, identifying COUP sources with detectable fluorescent emission. This emission line is particularly interesting since it can provide a wealth of information on the emitting source(s). Fluorescent keV photons – hereafter referred to as Fe I Kα photons – result from a de-excitation of neutral or lowly ionized iron atoms, following an excitation leaving the iron ion with a K-shell vacancy. When the latter is filled by another (mostly L-shell) electron, the excess energy can be carried by a fluorescent photon. Highly ionized iron can also show this behavior, but the transition energy rises because of the reduced screening of the inner electrons from the nuclear charge. Several processes lead to the ejection of a K-shell electron and, thus, to the creation of the Fe I Kα line. During the process of photoionization a K-shell electron is ejected from iron after the absorption of a photon with an energy exceeding keV. Alternatively, high energy particles can eject K-shell electrons with the same threshold energy.
The first detection of the fluorescent Fe I Kα line was reported in the context of solar physics (e.g. Neupert et al. 1967). A model succeeding in explaining most of the solar Fe I Kα emission with photoionization only was proposed and evaluated by Bai (1979), yet, e.g., Zarro et al. (1992) argue that photoionization alone is not sufficient to account for all of the solar Fe I Kα emission. Fluorescent Kα line emission has also been reported from other celestial X-ray sources. It is typically encountered in the high-energy emission from AGN and X-ray binaries, which are characterized by high X-ray luminosities and rather hard X-ray spectra, thus providing large photon numbers above the keV threshold for photoionization. Fabian et al. (1989) detect the fluorescent iron line in the spectrum of the X-ray binary Cyg-X1, and Tanaka et al. (1995) were the first to report the relativistically broadened line in the spectrum of the AGN MCG-6-30-15. Recent observations with XMM-Newton and Chandra extended the class of Fe I Kα line emitters to a number of stellar sources, such as the class I YSO Elias 2-29 (Favata et al. 2005), the above seven COUP sources discussed by Tsujimoto et al. (2005), and the YSO YLW 16A for which Imanishi et al. (2001) carried out time-resolved spectroscopy.
In this letter we present a detailed analysis of the X-ray properties of the YSO V 1486 Ori (= COUP 331) with emphasis on its Fe I Kα emission, which was already reported by Tsujimoto et al. (2005), who measured a normalization of ph/(cm2 s) with an equivalent width of eV for the fluorescent line. Unfortunately, the YSO V 1486 Ori has so far not received much attention at other energy bands. From the 2MASS-all-sky survey we infer its infrared magnitudes as mag, mag, and mag, in the J,H, and Ks bands, respectively. Tsujimoto et al. (2005) show that the infrared colors of V 1486 Ori do not match the regions of reddened dwarfs or giants and argue for the presence of a NIR-emitting inner disk. Moreover a rotation period of d is known for V 1486 Ori (Herbst et al. (2002) and Stassun et al. (1999)). Following Tsujimoto et al. (2005) we adopt a distance of pc for Orion.
2 Observations and data analysis
The COUP data was obtained during 13 consecutive days in Jan. 2003 with the Advanced CCD Imaging Spectrometer (ACIS) on board the Chandra X-ray observatory. The total exposure time is ks, separated into 6 observation segments extending over a total time of ks. All observations have the same aimpoint ( and ) and the field of view covers an area of ; the source COUP 331 is located at and (cf. Getman et al. 2005). Our analysis is based on the pre-processed photon data provided by the Chandra pipeline; for further analysis we applied the CIAO-software in version 3.4. We first screened the photon data for events in the keV energy band to suppress background. Thereafter, we defined source and background regions as a circle with an arcsec radius and an annulus extending from - arcsec, both centered on the nominal source position.
2.1 The light curve
We generated the background-subtracted keV band light curve of COUP 331 shown in Fig. 1. The 6 observation segments can be clearly identified. For most of the COUP observations COUP 331 was recorded at a count rate of cts/s, except for two periods. A strong flare (termed “flare I”) occurred ks after the beginning of the observation. The flare rapidly rises to its peak within ks, the decay is again quite rapid with an e-folding time of ks, but, unfortunately, is only partially observed. A second, less prominent but very significant count rate enhancement (termed ”flare II”) occurred 1080 ks after the start of the COUP campaign. This second flare was also not fully covered. Flare II has a much slower rise phase lasting for ks, and thereafter, the keV band count rate remains more or less constant for at least ks when the COUP observations were terminated. For the rest of the observations COUP 331 was found in quiescence.
2.2 Spectral analysis
In the following section we carry out temporally resolved spectral analysis of the flare I, flare II, and quiescent phases of COUP 331; note that all quoted errors refer to % confidence intervals unless stated otherwise. COUP 331 is located about arcmin off-axis, hence it does not appear as a perfectly symmetric point-source. However, we regard its image distortion as weak and apply the CIAO standard tools for the extraction of point-source spectra (i.e. psextract). The spectra were analyzed using the XSPEC environment in version 11.3.1.

2.2.1 The quiescent phase
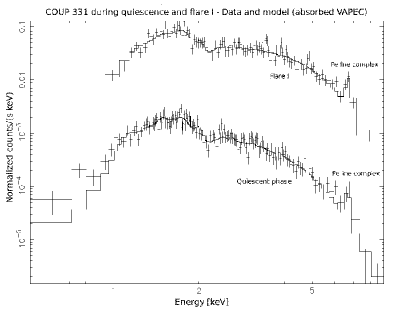
The quiescent phase spans the ks time interval with the exception of the first flare event, and is the longest lasting phase, covering % of the total observation time. Note that we disregard a ks contribution preceding flare II. During quiescence COUP 331 is detected with a net count-rate of cts/s corresponding to an (unabsorbed) X-ray luminosity of erg/s. We checked for temporal changes in the quiescent spectrum, but did not find evidence for any significant variations. The quiescent X-ray spectrum is well described by an absorbed thin-thermal plasma model (we used the VAPEC models) with all metal abundances – apart from Fe, which is left as a free parameter – fixed to times the solar values. In Fig. 2 we show the data and the fit; the best fit model parameters are presented in Table 1, where we list the derived absorbing hydrogen column-density, the temperature, the iron abundance and the fit quality.
2.3 Flare I
For an analysis of flare I we considered all data recorded in the time interval from to ks; the spectrum of flare I is shown in Fig. 2. The flare spectrum is very well described by the same model as applied for the quiescent phase (cf. Sect. 2.2.1) with somewhat different spectral parameters listed in Table 1. We find – as expected for a flare – an enhanced temperature of keV, leading to a spectrum with a clearly detected Fe line feature at 6.7 keV, but with no detected excess emission at keV. From the spectrum we derive an (unabsorbed) peak X-ray luminosity of L erg/s (in the keV band) reached directly after the rise phase, and – with an e-folding time of ks for the decay phase – a total energy output of erg in the same band. With these numbers, flare I observed on COUP 331 is among the largest stellar flares ever observed.
2.4 Flare II
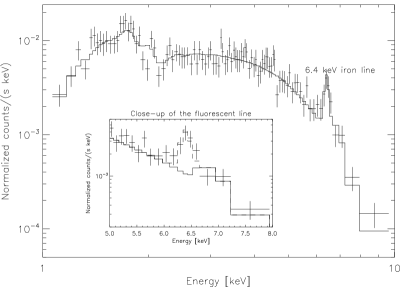
For the analysis of flare II we considered all data recorded after ks (cf. Fig. 1). The X-ray spectrum was generated and analyzed in the same fashion as those of the quiescent and flare I phases. From the spectrum of the entire observed flare II phase (see Fig. 3) we calculate an keV band X-ray luminosity of erg/s. Considering a duration of at least ks, the total energy output in this energy band is erg.
In the fit process of the flare II data we encountered two problems. First, the absence of temperature-sensitive features in the spectrum – especially the hot Fe XXV feature at keV and its Fe XXVI counterpart near keV – prevents us from tightly constraining the plasma temperature. We find that any choice of the temperature beyond keV leads to acceptable fits, and thus decided to apply a value of keV. Second, the spectrum shows definite excess emission above the thermal continuum at keV, which we attribute to the Fe I Kα line. We therefore included an additional instrumentally broadened Gaussian component centered at 6.4 keV into our model and refitted, leaving only the normalization of the Gaussian component free to vary. The thus obtained fit is shown in Fig. 3, which shows the obvious presence of the 6.4 keV line and virtual absence of the keV Fe XXV feature. The resulting fit parameters for the thermal model are again listed in Table 1, and for the Gaussian component we arrive at a normalization of ph/(cm2 s), corresponding to an equivalent width of 685(452-918) eV. As is obvious from Fig. 3, the inclusion of a Gaussian component at keV into the model significantly increases the fit quality.
| Phase | nH | Temp. | AbFe | /d.o.f. |
|---|---|---|---|---|
| [keV] | ||||
| Quiescent | 131.6/134 | |||
| Flare I | 94.2/99 | |||
| Flare II | 111This value is ill-constrained since temperature-dependent | 102/95 |
As a first result we thus note that the 6.4 keV emission feature is present – at best – only during 60 ks during flare II. In order to further temporally constrain the presence of the 6.4 keV iron line we constructed a background-subtracted keV narrow-band light curve of COUP 331 with a ks binning in addition to the ks binned keV band light curve; both light curves are shown in Fig. 4. As is clear from Fig. 4 the keV band light curve stays more or less constant after the rise to peak, while the keV narrow-band light curve decays quite rapidly. We therefore subdivided the the flare II phase data into three consecutive ks time intervals, denoted by “rise-phase”, “phase II”, and “phase III” as indicated in Fig. 4.

The X-ray spectra in the 5-8 keV region corresponding to these time intervals are shown in Fig. 5. In these plots the solid line indicates the thermal model described earlier. For all spectra the same model was applied, but we allowed the normalizations of the VAPEC and Gaussian component to be fitted independently for all time intervals; all other parameters were regarded globally. Figure 5 clearly demonstrates an evolution of the Fe I Kα line strength. Interestingly the line normalization decreases as time proceeds, while the underlying thermal spectrum remains almost unaffected. We thus interpret the variations in the narrow-band light curve shown in Fig. 4 as arising from variations in the Fe I Kα feature’s strength. Note that the constancy of the thermal spectrum does not imply the same for the temperature, since the latter exceeds keV, producing a flat spectrum in the “low energy” band we are observing. The Kα feature is strongest during the flare II rise phase where our fits yield a line flux of ph/(cm2 s) (an EW of eV) while in phase II and III it is reduced to 3.04(0.8-7.6) and 0.9(0-4.8) ph/(cm2 s), respectively. This is also reflected by the narrow-band light curve around keV (cf. Fig. 4).

3 Interpretation and conclusions
Our time resolved analysis of the COUP X-ray data of the YSO COUP 331 shows that for % of the entire observation time the object is found in a quiescent state characterized by an X-ray temperature of MK. Two major flares are covered by the COUP observation. In the first data segment a relatively short duration event with a peak X-ray luminosity of erg/s occurred, which clearly shows the keV iron feature, but no Fe I Kα emission.
In the last COUP data segment a long duration flare event occurred; starting with a ks rise phase it lasted ks. The decay of this flare cannot be constrained because the COUP observations were stopped. The total amount of energy released in the keV energy band is erg; the X-ray temperature of this flare is extremely large ( keV) and can in fact not be well constrained with the Chandra data. A clear and highly significant detection of the fluorescent Kα line is obtained only during the ks rise time of this flare; at later times the line may still be present albeit at a lower level. This event on COUP 331 resembles a huge flare observed on Algol, observed by Favata & Schmitt (1999) with BeppoSAX, which also shows a slow rise phase, followed by a nearly constant phase - lasting for ks - in its keV band light curve. However, the corresponding keV band light curve clearly shows the characteristics of a decay phase (cf., Favata & Schmitt (1999), Figs.1 and 2). The energy output of erg derived by Favata & Schmitt (1999) in the keV band compares well to the numbers estimated for COUP 331, note however that no Fe I Kα line was detected.
The precise temporal association between Fe I Kα line emission and high energy continuum is necessary in order to quantitatively assess the origin of the Fe I Kα emission observed in COUP 331; we find that the actual photon flux in the fluorescent Kα line during the flare II rise phase is times larger than reported by Tsujimoto et al. (2005). This discrepancy arises because Tsujimoto et al. (2005) give time-averaged values, whereas our values refer to several limited time intervals. The X-ray temperature during the flare event was extremely large; the total luminosity in the Fe I Kα line alone is erg/sec. While these circumstances appear to favor the excitation of the Fe I Kα line through photoionization, preliminary model calculations challenge such a scenario. We repeated the calculations carried out by Bai (1979) applying a reflector with cosmic abundances. We used the same branching ratios and cross sections for iron, but slightly different cross section for absorption by other elements composed according to cosmic abundances. Furthermore, we located the source directly on the reflector to make it subtend half the sky, thus providing an upper limit for the fluorescent iron line flux. The illuminating input spectrum was modeled as a thermal X-ray spectrum with a temperature of keV, normalized to the measured fluxes. Our preliminary calculations show that an already optimally assumed fluorescence geometry significantly underpredicts the observed Fe I Kα flux, making an interpretation of the Fe I Kα line through photoionization difficult to accept. However, these calculations will be extensively discussed in a larger and systematic context in a forthcoming paper, where we will also address its impact on the characteristics of COUP 331 and other sources with fluorescent Kα emission.
Acknowledgements.
SC acknowledges support from the DLR under grant 50OR0105.References
- Bai (1979) Bai, T. 1979, Sol. Phys., 62, 113
- Fabian et al. (1989) Fabian, A. C., Rees, M. J., Stella, L., & White, N. E. 1989, MNRAS, 238, 729
- Favata et al. (2005) Favata, F., Micela, G., Silva, B., Sciortino, S., & Tsujimoto, M. 2005, A&A, 433, 1047
- Favata & Schmitt (1999) Favata, F. & Schmitt, J. H. M. M. 1999, A&A, 350, 900
- Getman et al. (2005) Getman, K. V., Flaccomio, E., Broos, P. S., et al. 2005, ApJS, 160, 319
- Herbst et al. (2002) Herbst, W., Bailer-Jones, C. A. L., Mundt, R., Meisenheimer, K., & Wackermann, R. 2002, A&A, 396, 513
- Imanishi et al. (2001) Imanishi, K., Koyama, K., & Tsuboi, Y. 2001, ApJ, 557, 747
- Neupert et al. (1967) Neupert, W. M., Gates, W., Swartz, M., & Young, R. 1967, ApJ, 149, L79+
- Stassun et al. (1999) Stassun, K. G., Mathieu, R. D., Mazeh, T., & Vrba, F. J. 1999, AJ, 117, 2941
- Tanaka et al. (1995) Tanaka, Y., Nandra, K., Fabian, A. C., et al. 1995, Nature, 375, 659
- Tsujimoto et al. (2005) Tsujimoto, M., Feigelson, E. D., Grosso, N., et al. 2005, ApJS, 160, 503
- Zarro et al. (1992) Zarro, D. M., Dennis, B. R., & Slater, G. L. 1992, ApJ, 391, 865