How do methanol masers manage to appear in the youngest star vicinities and isolated molecular clumps?
Abstract
General characteristics of methanol (CH3OH) maser emission are summarized. It is shown that methanol maser sources are concentrated in the spiral arms. Most of the methanol maser sources from the Perseus arm are associated with embedded stellar clusters and a considerable portion is situated close to compact Hii regions. Almost 1/3 of the Perseus Arm sources lie at the edges of optically identified Hii regions which means that massive star formation in the Perseus Arm is to a great extent triggered by local phenomena. A multiline analysis of the methanol masers allows us to determine the physical parameters in the regions of maser formation. Maser modelling shows that class II methanol masers can be pumped by the radiation of the warm dust as well as by free-free emission of a hypercompact region (hcHii) with a turnover frequency exceeding 100 GHz. Methanol masers of both classes can reside in the vicinity of hcHiis. Modelling shows that periodic changes of maser fluxes can be reproduced by variations of the dust temperature by a few percent which may be caused by variations in the brightness of the central young stellar object reflecting the character of the accretion process. Sensitive observations have shown that the masers with low flux densities can still have considerable amplification factors. The analysis of class I maser surveys allows us to identify four distinct regimes that differ by the series of their brightest lines.
keywords:
masers; catalogs; surveys; stars: formation; ISM: clouds, evolution, kinematics and dynamics, structure; Galaxy: structure; radio lines: ISM1 Introduction
Methanol is a complex molecule — it consists of six atoms, and two of them are heavy. It is surely the 1st prize winner by complexity among the molecules producing cosmic masers. It is really surprising that such a molecule gives birth to numerous and extremely bright masers that are only matched by the 1.7 GHz hydroxyl (OH) and 22 GHz water vapor (H2O) lines.
This paper describes the methanol maser phenomenon on different spatial scales emphasizing the physical conditions that characterize methanol maser sites. Several aspects of this topic are covered in papers of other participants of this conference. We concentrate on results obtained by researchers from the Ural State University mostly in cooperation with scientists from other institutes.
2 General characteristics
Methanol masers are traditionally divided into two classes according to the sets of transitions in which they emit. Historically, the first methanol masers (later attributed to class I) were discovered in Orion in the E series of lines at about 25 GHz ([Barrett et al. (1971), Barrett et al. 1971]). The existence of the second class of methanol masers (eventually named class II) was justified in the paper by [Batrla et al. (1987)] after the discovery of strong masers in the E line at 12.1 GHz. The existence of an intermediate class of methanol masers is predicted but these masers are not likely to attain fluxes comparable to those of the strongest lines of the two major classes ([Voronkov et al. (2005), Voronkov et al. 2005]). Methanol masers of both classes often co-exist in the same star-forming region, though there are bright and notorious examples of class-I-only (OMC-1) and class-II-only (W3(OH)) sources.
Methanol maser lines can achieve extremely high brightness: class I maser lines at 44 GHz are reported to be brighter than K ([Kogan & Slysh (1998), Kogan & Slysh 1998]) and class II lines at 6.7 GHz achieve even higher brightness exceeding K ([Menten et al. (1992), Menten et al. 1992]). Spectra of the bright methanol masers usually contain numerous components (see, e.g., [Caswell et al. (1995), Caswell et al. 1995]) spread in a range smaller than 20 km/s around the systemic velocity of the respective molecular core ([Malyshev & Sobolev (2003), Malyshev & Sobolev 2003]). Maser components are usually narrow (about 0.5 km/s) and the narrowest ever reported line (0.1 km/s) belongs to a class I methanol maser ([Voronkov et al. (2006), Voronkov et al. 2006]). Methanol masers display time variability of various kinds including periodic, chaotic and episodic flaring ([Goedhart et al. (2004), Goedhart et al. 2004]).
3 Methanol masers on a Galactic scale
Studies of the distribution of methanol masers in the Galaxy can be reduced to class II maser sources because most of the class I maser sites are found close to class II ones (see, e.g., [Slysh et al. (1994), Slysh et al.. 1994] and [Ellingsen (2005), Ellingsen 2005]). At present there exist three unified catalogues of class II methanol masers each containing information on more than 500 objects ([Malyshev & Sobolev (2003), Malyshev & Sobolev 2003]; [Xu, Zheng & Jiang (2003), Xu, Zheng & Jiang 2003] and [Pestalozzi et al. (2005), Pestalozzi et al. 2005]). The distinguishing feature of the [Malyshev & Sobolev (2003)] catalogue is that it contains data on several maser transitions and cross-references to the data on molecular shock tracers. This catalogue is updated on a monthly basis and is available at http://astroserver.astro.usu.ru.
Most of the class II maser sources were found toward positions of OH masers and IRAS sources with specific spectral characteristics. A new way of targeting based on GLIMPSE data is suggested in [Ellingsen (2007)]. Blind surveys, including a recent Arecibo survey by [Pandian et al. (2007)] led to the detection of many new maser sources in selected areas. A real breakthrough is expected after the completion of the blind survey within the MMB (Methanol Multibeam) project (see the paper by J. Green et al. in this volume).
Information on the Galactic distribution of class II methanol masers was presented in several papers which established that these masers mostly reside in the molecular ring of our Galaxy (for one of the most recent articles, see [Pestalozzi et al. (2005), Pestalozzi et al. 2005]). At present, class II masers were found only in high mass star-forming regions ([Minier et al. (2003), Minier et al. 2003]) and it is natural to expect that these sources should be concentrated in the spiral arms.
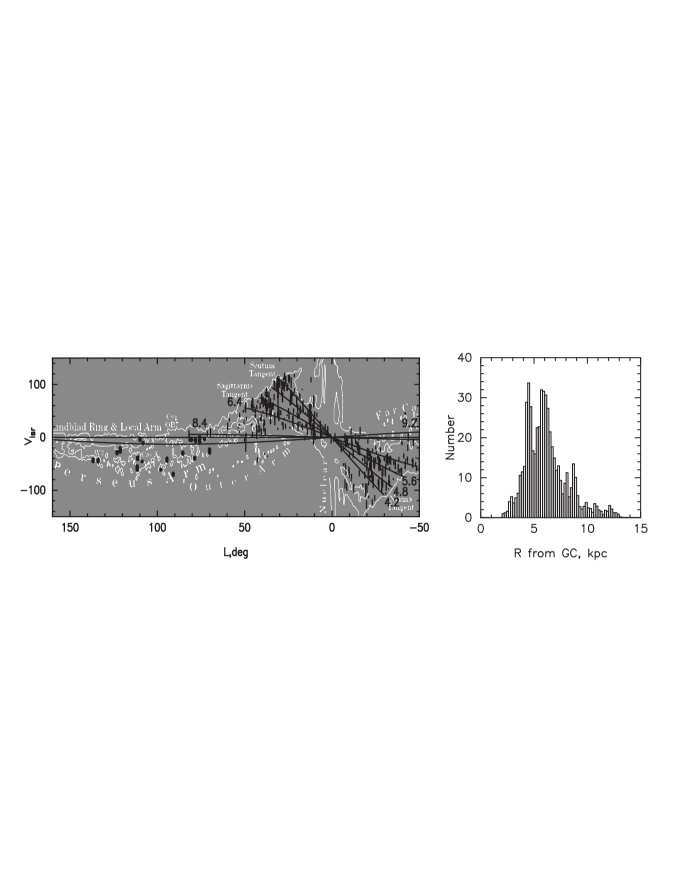
For the outer Galaxy, the concentration of methanol maser sources to the Perseus spiral arm is quite certain: the velocity-Galactic latitude () diagram shows that the masers mostly reside in spiral arms which are well outlined by CO emission (see figure 1). Evidence for a concentration of the methanol masers in the spiral arms is more difficult to prove in the tangled regions of the inner Galaxy and was first provided in [Sobolev et al. (2005)]. New maser sources were reported since then, mainly in [Pandian et al. (2007)] and [Ellingsen (2007)]. Figure 1 shows a diagram for the masers from the inner part of the Galaxy along with lines of equal Galactocentric distance, , and the distribution of the maser sources as a function of . The updated [Malyshev & Sobolev (2003)] catalogue and the [Brand & Blitz (1993)] rotation curve were used. The concentration of masers to certain ranges of Galactocentric distance is apparent. The values of correlate with the nearest spiral arm sections of the inner Galaxy. It is, however, not possible to conclude that all class II masers reside in the spiral arms. For the bulk of the sources there are only kinematic distances which are not accurate enough. Moreover, most of the distance estimates are based on velocities of 6.7 GHz maser peaks which are significantly scattered with respect to the systemic velocities of the clouds ([Malyshev & Sobolev (2003), Malyshev & Sobolev 2003] and [van der Walt, Sobolev & Butner (2007), van der Walt, Sobolev & Butner 2007]). So a sophisticated analysis of the Galactic methanol maser distribution requires a drastic improvement in the precision of distance estimates.
4 Masers in the Perseus Arm
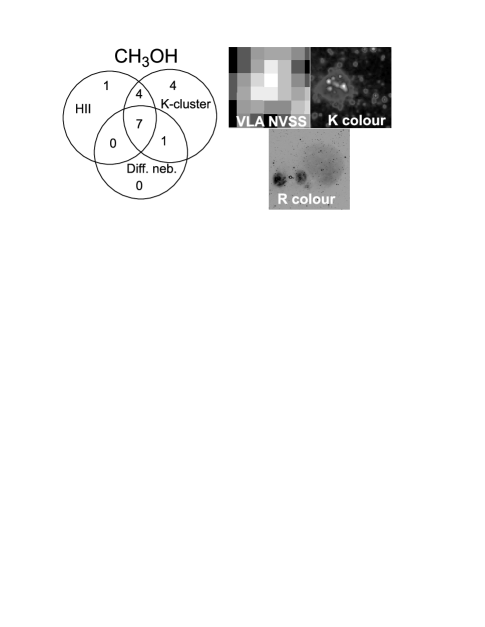
In this section we will discuss the association of methanol masers with the large scale constituents of star forming complexes in the Perseus arm. We confine ourselves to the Perseus Arm because these objects have relatively simple structure, most of them have no confusing and strong back- or foreground and the objects are relatively near. We realize that the Perseus Arm complexes are somewhat different from those residing in the other parts of the Galaxy but it is easier to start with the least complicated case. 28 sources were selected from the [Malyshev & Sobolev (2003)] catalogue on the basis of their position in the diagram. Using the SkyView virtual observatory (http://skyview.gsfc.nasa.gov/) we compiled an atlas of images of these sources displaying their association with developed Hii regions seen at optical wavelengths (R colour images), embedded star clusters revealed in near infrared (Ks colour images) and compact Hii regions detected in the NRAO VLA Sky Survey (NVSS). The numbers of maser sources associated with these types of objects are shown in figure 2. It is found that 57 % of the sources are associated with embedded clusters which means that these maser sites can be affected by several young stellar objects (YSOs). This is especially true for class I masers which are found apart from the YSOs. The fraction of cluster associations can be substantially higher since Ks colour images do not show very deeply embedded clusters revealed at submm and mm wavelengths. For 43 % of the targets we find an association with VLA sources which means that a considerable fraction of maser sources is associated with rather developed compact Hii regions around luminous YSOs. 29 % of the sources appear to be associated with optical Hii regions. We conclude that a considerable fraction of the methanol masers is triggered by the expansion of evolved Hii regions. Since the time duration of the methanol masing phase is quite short (see, e.g., [van der Walt (2005), van der Walt et al. 2005]) this means that contemporary massive star formation in the Perseus Arm is to a great extent controlled by local phenomena. A significant fraction of the sources (40 %, mostly the distant ones) did not show a clear association with the objects of our atlas.
5 Class II Methanol maser environments and pumping
The environment of class II methanol masers was discussed in many papers (see, e.g., [Ellingsen (2006), Ellingsen 2006], [Minier et al. (2005), Minier et al. 2005] and [Walsh et al. (2001), Walsh et al. 2001]) and talks at this symposium (review by V. Fish, talks by J. de Buizer, S. Ellingsen, T. Hill, S. Longmore, L. Moscadelli and others). Here we will instead emphasize two facts which are decisive for our understanding of the maser pumping: it is established that almost all of the maser sources are associated with mid-infrared (MIR) emission ([Walsh et al. (2001), Walsh et al. 2001]) and some of them are associated with submm sources without cm - IR counterparts ([Hunter et al. (2006), Hunter et al. 2006]).
5.1 Class II methanol maser pumping regime
Both observations and modelling of class II masers show that the 6.7 GHz transition always manifests the highest brightness temperature ([Malyshev & Sobolev (2003), Malyshev & Sobolev 2003]; [Sobolev et al. (1997), Sobolev et al. 1997]). Observations have not shown significant differences in the positions of the maser spots seen in different transitions (see, e.g., [Menten et al. (1992), Menten et al. 1992]; [Sutton et al. (2001), Sutton et al. 2001]). So, there is basically only one known pumping regime of class II masers. However, ratios of the brightnesses of different maser lines show considerable dependence on the values of the physical parameters. The hypothesis that the masers are pumped by MIR emission of the warm dust allows us to explain observed brightness temperatures and to determine physical parameters of several sources on the basis of multi-transitional observations (e.g., [Sutton et al. (2001), Sutton et al. 2001], [Cragg, Sobolev & Godfrey (2005), Cragg, Sobolev & Godfrey 2005]). A model of the “common” class II methanol maser source was constructed on the basis of extensive surveys (e.g., [Cragg et al. (2004), Cragg et al. 2004] and [Ellingsen et al. (2004), Ellingsen et al. 2004]). The results of such studies are summarized in [Sobolev et al. (2002)] and [Cragg, Sobolev & Godfrey (2005)] and will not be presented here.
5.2 Class II methanol maser variability
The response of the maser fluxes to changes in the physical parameters allows us to determine these parameters and their variation in time via detailed modelling. For example, interferometric studies of variability in the source G9.62+0.20 shows that different parts of the source are synchronized, suggesting a radiative origin for the variability ([Goedhart et al. (2005), Goedhart et al. 2005]). Monitoring observations have shown that this source is almost strictly periodical (see the papers by Goedhart & Gaylard and Gaylard & Goedhart in this volume). Periodicity is revealed in the variations of G9.62+0.20 in three maser transitions at 6.7, 12.2 and 107 GHz (van der Walt et al. in preparation). A possible cause for the synchronized variability might be a variation of the dust temperature in the region where maser is formed. Model calculations show that corresponding changes of fluxes can be reproduced by variations of the dust temperature by a few per cent which may follow variations in the brightness of the central YSO reflecting the character of the accretion process.
5.3 Class II methanol maser pumping in hypercompact Hii region environments
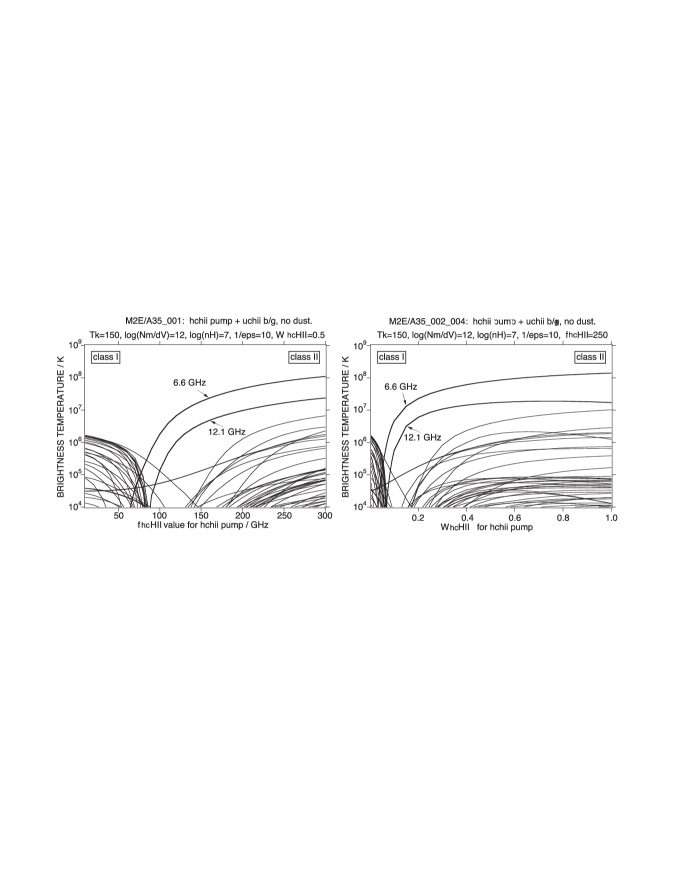
Recent observations have shown that the masers which were previously “hanging in nowhere” (e.g., the brightest 6.7 GHz masers in NGC6334F, [Ellingsen et al. (1996), Ellingsen et al. 1996]) are associated with submm emission ([Hunter et al. (2006), Hunter et al. 2006]) and have high chances to be formed in the vicinity of hypercompact Hii regions (hcHiis). These objects manifest strong free-free emission which in some cases dominates the dust emission up to frequencies as high as 300 GHz ([Kurtz (2005), Kurtz 2005]). We have undertaken model calculations in order to explore whether methanol masers can be pumped by free-free emission with high turnover frequency (i.e., high emission measure) without considerable dust content. Historically, first calculations of this kind were presented in the paper by ([Slysh et al. (2002), Slysh et al. 2002]) but these authors did not account for very powerful torsional transitions which are crucial for pumping, at least in terms of intensities. Our calculations are based on the most recent transition rates that were used in the model calculations presented in [Cragg, Sobolev & Godfrey (2005)]. The model parameters are close to those presented by [Cragg, Sobolev & Godfrey (2005)] with the major difference that the warm dust emission is substituted by the free-free emission from the hcHii. We have chosen the following set of parameters: gas temperature K, hydrogen number density cm-3, methanol specific column density cm-3 s, beaming factor , hcHii electron temperature K, turnover frequency GHz and hcHii dilution factor . The calculations show that bright class II masers are indeed produced.
Figure 3 presents results from two series of models. The left panel reveals variations of brightness temperature when modifying the turnover frequency. It is clearly seen that to pump bright class II masers free-free emission of hcHii should have GHz, i.e. it should posess a very high emission measure. The right panel demonstrates that the pumping of class II methanol masers takes place quite close to the hcHii where the free-free emission is not greatly diluted (). It is noteworthy that, when the distance from the hcHii increases (), some dense, warm and elongated clumps created by interaction of the hcHii with the ambient medium can give birth to rather strong class I methanol masers. This is one of the possible explanations of the fact that masers of different classes can reside close to each other (see, e.g., [Ellingsen (2005), Ellingsen 2005]).
5.4 Are weak masers really masing?
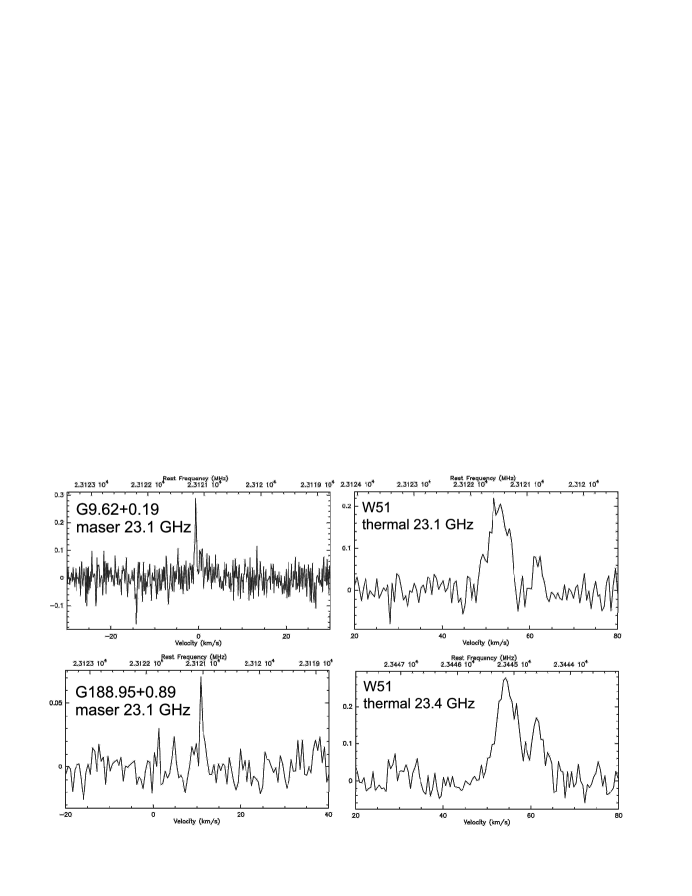
It was shown that important constraints on the models can be obtained through an evaluation of upper limits for the fluxes in particular maser lines. Within this context it is very important to know whether the weak lines are masers or whether a given transition is thermalized. In order to find a solution to this problem we conducted a very sensitive search for emission in the and lines at 23.1 and 23.4 GHz using the 100-m telescope at Effelsberg. The transitions at 23.1 and 23.4 GHz highly differ in their response to factors producing departures from LTE: e.g., W3(OH) is strongly masing at 23.1 GHz and shows absorption at 23.4 GHz ([Menten et al. (1986), Menten et al. 1986]).
In contrast to previous surveys at Parkes and Onsala the detection rate in the maser line at 23.1 GHz was rather high and we detected emission in 10 sources out of 20. The 23.1 GHz line in the sources W51, W75N, DR21(OH), Cep A and G12.91–0.26 showed linewidths comparable to those of corresponding “quasi-thermal” lines from these objects. In these sources, the 23.4 GHz line shows very similar intensities and line shapes (see the W51 spectra in figure 4) which means that the transitions are thermalized.
Toward the sources G9.62+0.19, G23.01+0.41 and G188.95+0.89 a clear detection of the 23.1 GHz line was not accompanied by 23.4 GHz emission. The detected lines are considerably narrower than “quasi-thermal” lines from these objects (see figure 4). Line narrowing is a property of unsaturated masers with considerable optical depth. So, we can state that we detected three new weak but real masers and that the weakness of masers does not necessarily mean that their amplification factors are low.
6 Class I methanol maser environments and pumping
The environment of class I masers is highly turbulent. Lines of the strong masers usually contain several spectral components and their spots form clusters. General characteristics of the maser images and spectra can be reproduced by modelling the turbulent velocity field ([Sobolev et al. (1998), Sobolev et al. 1998]). The existence of the interferometric data on the images and time variability of the J2 – J1E maser line series at about 25 GHz in OMC-1 ([Johnston et al. (1992), Johnston et al. 1992]) allow us to construct models constraining the characteristics of the turbulence in this source ([Sobolev et al. (1998), Sobolev et al. 1998]; [Sobolev et al. (2003), Sobolev et al. 2003]).
Class I methanol masers are less strong and widespread than class II ones. Most of them were found in the vicinity of class II maser sources (see, e.g., [Slysh et al. (1994), Slysh et al. 1994] and [Ellingsen (2005), Ellingsen et al. 2005]). There were extensive searches (e.g., [Slysh et al. (1994), Slysh et al. 1994] and [Val’tts et al. (2000), Val’tts et al. 2000]) for class I sources but no unified catalogues of these objects are published in the journals and no successful blind surveys were performed yet. There are several lines of evidence that class I masers trace dense parts of molecular outflows, probably locations where new stars might form (e.g., [Voronkov et al. (2006), Voronkov et al. 2006] and [Sutton et al. (2004), Sutton et al. 2004]) but generally the environment of class I sources is not well established yet.
Recently, sensitive and extensive surveys of the southern class I masers were conducted utilizing the unique capabilities of the Australia Telescope Compact Array (see the paper by Voronkov et al. in these proceedings). They allow us to draw some general conclusions on the class I maser pumping and identify four distinct regimes differing by the series of the brightest (in terms of brightness temperature) line.
The most frequently encountered maser regime shows the brightest lines which belong to the J-1 – (J–1)0E series. The 4E and 5E transitions at 36.1 and 84.5 GHz are weak masers under normal conditions of massive star forming regions. Usually, the maser nature of the lines in this regime is difficult to prove observationally. Nevertheless, there are cases where the line profiles contain narrow spikes and the maser nature is proved interferometrically. The sources Sgr B2, G30.8-0.1, and G1.6-0.025 can be considered as representatives of this maser regime ([Sobolev (1996), Sobolev 1996]).
In the second class I maser regime the lines of the J0 – (J–1)1A+ series become prevalent. Numerous sources show definitely maser lines arising in the 70 – 61A+ and 80 – 71A+ transitions at 44.1 and 95.2 GHz, respectively. Masers in the sources DR21W, NGC2264 and OMC-2 represent this regime ([Menten (1991)]). A preliminary theoretical analysis of the pumping shows that the lines of the J0 – (J–1)1A+ series become brightest in the models with rather high beaming () and moderate column densities ([Sobolev et al. (2005), Sobolev et al. 2005]).
The third maser regime is less widespread and is represented by the sources where the lines of the J2 – J1E series at about 25 GHz are the brightest. OMC-1 is the prototypical source ([Johnston et al. (1992), Johnston et al. 1992]) and some additional bright sources were found recently (Voronkov et al. these proceedings). Lines of this series become brightest in the models with high specific column densities ( [cms])) and require relatively high temperatures ( – K) and densities ( [cm – ).
The existence of the forth maser regime with the brightest lines from the J-2 – (J–1)-1E series was previously uncertain. Recent ATCA observations confirmed however, the existence of such a regime in the sources W33-Met and G343.12-0.06. Preliminary modelling shows that the 9-2 – 8-1E line at 9.9 GHz becomes brightest in models with specific column densities which are as high as required for the previously discussed regime. However, a smaller beaming angle and either lower densities or higher temperatures ( K) are also required.
References
- [Barrett et al. (1971)] Barrett, A.H., Schwartz, P.R., & Waters, J.W. 1971, ApJ 168, L101
- [Batrla et al. (1987)] Batrla, W., Matthews, H.E., Menten, K.M., & Walmsley, C.M. 1987, Nature 326, 49
- [Brand & Blitz (1993)] Brand, J. & Blitz, L. 1993, A&A 275, 67
- [Caswell et al. (1995)] Caswell, J.L., Vaile, R.A., Ellingsen, S.P. & Norris, R.P. 1995, MNRAS 274, 1126
- [Cragg et al. (2004)] Cragg, D.M., Sobolev, A.M., Caswell, J.L., et al. 2004, MNRAS 351, 1327
- [Cragg, Sobolev & Godfrey (2005)] Cragg, D.M., Sobolev, A.M. & Godfrey, P.D. 2005, MNRAS 360, 533
- [Dame et al. (2001)] Dame, T.M., Hartmann, D. & Thaddeus P. 2001, ApJ 547, 792
- [Ellingsen et al. (1996)] Ellingsen, S.P., Norris, R.P. & McCulloch, P.M. 1996, MNRAS 279, 101
- [Ellingsen et al. (2004)] Ellingsen, S.P., Cragg, D.M., Lovell, J.E.J., Sobolev, A.M., et al. 2004, MNRAS 354, 401
- [Ellingsen (2005)] Ellingsen S.P. 2005, MNRAS 359, 1498
- [Ellingsen (2006)] Ellingsen S.P. 2006, ApJ 638, 241
- [Ellingsen (2007)] Ellingsen S.P. 2007, MNRAS 377, 571
- [Goedhart et al. (2004)] Goedhart, S., Gaylard, M.J. & van der Walt, D.J. 2005, MNRAS, 355, 553
- [Goedhart et al. (2005)] Goedhart, S., Minier, V., Gaylard, M.J. & van der Walt, D.J. 2005, MNRAS, 356, 839
- [Hunter et al. (2006)] Hunter, T.R., Brogan, C.L., Megeath, S.T. et al. 2006, ApJ 649, 888
- [Johnston et al. (1992)] Johnston, K.J., Gaume, R., Stolovy, S., et al. 1992, ApJ 385, 232
- [Kogan & Slysh (1998)] Kogan, L. & Slysh, V. 1998, ApJ 497, 800
- [Kurtz (2005)] Kurtz S. 2005, ProcIAU 1, 111
- [Malyshev & Sobolev (2003)] Malyshev A.V. & Sobolev A.M. 2003, A&ATr 22, 1
- [Menten et al. (1986)] Menten, K.M., Walmsley, C.M., Henkel, C., Wilson, T.L. et al. 1986, A&A 169, 271
- [Menten (1991)] Menten K.M. 1991, ApJ (Letters) 380, L75
- [Menten et al. (1992)] Menten, K.M., Reid, M.J., Pratap, P., et al. 1992, ApJ (Letters) 401, L39
- [Minier et al. (2003)] Minier, V., Ellingsen, S.P., Norris, R.P. & Booth, R.S. 2003, A&A 403, 1095
- [Minier et al. (2005)] Minier, V., Burton, M.G., Hill, T. Pestalozzi, M.R. et al. 2005, A&A 429, 945
- [Pandian et al. (2007)] Pandian, J.D., Goldsmith, P.F. & Deshpande, A.A. 2007, ApJ 656, 255
- [Pestalozzi et al. (2005)] Pestalozzi M., Minier V. & Booth R. 2005, A&A 432, 737
- [Slysh et al. (1994)] Slysh, V.I., Kalenskii S.V., Val’tts I.E. & Otrupcek, R. 1994, MNRAS 268, 464
- [Slysh et al. (2002)] Slysh, V.I., Kalenskii S.V. & Val’tts I.E. 2002, Astron.Rep. 46, 49
- [Sobolev et al. (2002)] Sobolev, A.M., Ostrovskii, A.B., Malyshev, A.V., et al. 2002, ASP Conf.Ser. 206, 179
- [Sobolev (1996)] Sobolev, A.M. 1996, ASPC 102, 68
- [Sobolev et al. (1997)] Sobolev, A.M., Cragg, D.M. & Godfrey, P.D. 1997, MNRAS 288, 39
- [Sobolev et al. (1998)] Sobolev, A.M., Wallin, B.K. & Watson, W.D. 1998, ApJ 498, 763
- [Sobolev et al. (2003)] Sobolev, A.M., Watson, W.D. & Okorokov, V.A. 2003, ApJ 590, 333
- [Sobolev et al. (2005)] Sobolev A.M., Ostrovskii A.B., Kirsanova M.S., et al. 2005, ProcIAU 1, 174
- [Sutton et al. (2001)] Sutton, E.C., Sobolev, A.M., Ellingsen, S.P., et al. 2001, ApJ 554, 173
- [Sutton et al. (2004)] Sutton, E.C., Sobolev, A.M., Salii, S.V., et al. 2004, ApJ 609, 231
- [Val’tts et al. (2000)] Val’tts I.E., Ellingsen, S.P., Slysh, V.I., et al. 2000, MNRAS 317, 315
- [Voronkov et al. (2005)] Voronkov, M.A., Sobolev, A.M., Ellingsen, S.P., et al. 2005, Ap&SS 295, 217
- [Voronkov et al. (2006)] Voronkov, M.A., Brooks, K.J., Sobolev, A.M., et al. 2006, MNRAS 373, 411
- [Walsh et al. (2001)] Walsh, A.J., Bertoldi, F., Burton, M.G. & Nikola, T. 2001, MNRAS 326, 36
- [van der Walt (2005)] van der Walt, D.J. 2005, MNRAS 360, 153
- [van der Walt, Sobolev & Butner (2007)] van der Walt, D.J., Sobolev, A. M. & Butner, H. 2007, A&A 464, 1015
- [Xu, Zheng & Jiang (2003)] Xu Y., Zheng X.-W. & Jiang D.-R. 2003, ChJAA 3, 49