Comparative study of the inial spikes of SGR giant flares
in 1998 and 2004 observed with GEOTAIL:
Do magnetospheric instabilities trigger large scale fracturing
of magnetar’s crust?
Abstract
We present the unsaturated peak profile of SGR 1900+14 giant flare on 1998 August 27. This was obtained by particle counters of the Low Energy Particle instrument onboard the GEOTAIL spacecraft. The observed peak profile revealed four characteristic structures: initial steep rise, intermediate rise to the peak, exponential decay and small hump in the decay phase. From this light curve, we found that the isotropic peak luminosity was erg s-1 and the total energy was erg s-1 ( 50 keV), assuming that the distance to SGR 1900+14 is 15 kpc and that the spectrum is optically thin thermal bremsstrahlung with 240 keV. These are consistent with the previously reported lower limits derived from Ulysses and Konus-Wind observations. A comparative study of the initial spikes of SGR 1900+14 giant flare in 1998 and SGR 1806-20 in 2004 is also presented. The timescale of the initial steep rise shows the magnetospheric origin, while the timescale of the intermediate rise to the peak indicates that it originates from the crustal fracturing. Finally, we argue that the four structures and their corresponding timescales provide a clue to identify extragalactic SGR giant flares among short GRBs.
1 Introduction
Soft gamma-ray repeaters (SGRs) were first discovered as high-energy burst sources in the late 1970’s (Mazets & Golenetskii, 1981). Once SGRs enter burst active phases, they produce a lot of short-duration (0.1 s) energetic ( erg) soft gamma-ray bursts. These bursts were distinguished from cosmological gamma-ray bursts (GRBs) by the soft spectra and the repeated activities. Furthermore, as rare events, SGRs emit extremely bright giant flares (GFs). A GF lasts for several hundred seconds and its isotropic total energy amounts to 10 erg. So far, only three have been recorded. On 1979 March 5, the first GF was detected from SGR 0526-66 by Venela spacecraft (Mazets et al., 1979). The second GF was observed from SGR 1900+14 on 27 August 1998 (Hurley et al., 1999; Mazets et al., 1999; Feroci et al., 2001). Recently SGR 1806-20 emitted the third GF on 27 December 2004 (Terasawa et al., 2005; Hurley et al., 2005; Palmer et al., 2005; Mereghetti et al., 2005; Schwartz et al., 2005). The overall time profile of each GF is characterized by a very intense spectrally hard initial spike whose duration is 0.5 s, and a subsequent pulsating tail which has a softer spectrum and lasts for some hundred seconds. After the GFs, radio afterglows were observed from SGR 1900+14 (Frail et al., 1999) and from SGR 1806-20 (Gaensler et al., 2005; Cameron et al., 2005).
SGRs show the slow spin periods ( s) and rapid spin-down rates ( s s-1) (Kouveliotou et al., 1998, 1999). Assuming magnetic dipole radiation, we can estimate the magnetic fields of SGRs to be G and SGRs are recognized as magnetars (Duncan & Thompson, 1992; Thompson & Duncan, 1995, 1996). According to the magnetar model, the energy source of both recurrent bursts and GFs is the ultrastrong magnetic field: stored magnetic energy inside a magnetar is suddenly released via cracking of a magnetar’s crust, and the large scale crustal fracturing produces GFs. Similar to earthquakes, the power-law distribution of the radiated energy of the repeated burst and the lognormal distribution of waiting times between successive bursts are reported (Cheng et al., 1996; Göğüş et al., 2000). These observations also support the idea that SGR bursts originate from the starquakes.
In this paper, first, we focus on the SGR 1900+14 GF on 1998 August 27. This flare was detected by gamma-ray instruments on the Ulysses, Konus-Winds and BeppoSAX satellites (Hurley et al., 1999; Mazets et al., 1999; Feroci et al., 2001). However the flare was so intense that these instruments underwent severe dead-time or pulse pile-up problems. Consequently, the time profile during the most intense period was not obtained and only the lower limits of the peak flux intensity and fluence were reported (Hurley et al., 1999; Mazets et al., 1999). Here we present the clear peak profile of the SGR 1900+14 GF on 1998 August 27. The profile was recorded by the Low Energy Particle instrument (hereafter LEP) (Mukai et al., 1994) onboard the GEOTAIL spacecraft, whose principal objective is to study the Earth’s magnetosphere. The light curve for the first 350 ms of the GF is unsaturated and has a high time resolution of 5.58 ms. We also show the energetics of the flare.
Second, we present a comparative study of the initial spikes of SGR GFs in 1998 and 2004, the latter of which was also detected by the same instrument (Terasawa et al., 2005). From both of the light curves, we extract the characteristics of the initial spikes of SGR GFs, focusing on the timescales discovered during the initial spikes. Finally we argue that the observed timescales may provide a clue to identify extragalactic SGR giant flares among short GRBs.
2 Instrumentation and Observation
The LEP is designed to measure three-dimensional velocity distributions of the Earth’s magnetospheric ions and electrons. It consists of two nested sets of quadspherical electrostatic analyzers; one analyzer to select ions, and the other to select electrons. At the receving end of the ion and electron optics, seven microchannel plate detectors (MCPs) and seven channel electron multipliers (CEMs) are used, respectively. During the SGR 1806-20 GF in 2004, the peak flux was so intense that the MCPs were saturated during the first 150 ms. Alternatively the peak profile was derived from the CEMs, because the CEMs are much less sensitive to gamma-rays than the MCPs. After the most intense period, the MCPs recovered from the saturation and observed the decay profile clearly. On the other hand, during the SGR 1900+14 GF in 1998, we obtained the peak profile from the MCPs. The peak flux of the 1998 GF was about one-tenth of that of the 2004 GF (see below), and hence the MCPs did not suffer the severe saturation problem. The CEMs showed count increases ( 20) corresponding to those of the MCPs. However, since the background electron counts for CEMs were high (5080), we do not use the CEM data for the analysis of the SGR 1900+14 GF.
The LEP records the data every 15/8192 of the spacecraft spin period over 32 sequences, followed by a gap of 1/256 of the spin period. The spacecraft spin period was 3.046 s on 1998 August 27, leading to s ms time resolution. This is slightly different compared to a 5.48 ms time resolution of SGR 1806-20 GF observation in 2004, during which the spin period was 2.993 s.
In this report, we use the LEP calibration that the effective energy range and the detection efficiency are 50 keV and 1% against incident photons, respectively. Since the LEP was not designed to measure gamma-rays, this calibration was made after the launch of the GEOTAIL spacecraft through the analyses of solar flare photons for which the Hard X-ray Telescope onboard the Yohkoh satellite (Kosugi et al., 1991) provided photon energy spectra and intensities. Recently we have made (i) GEANT4 simulations based on the detailed mass model of the LEP, satellite structure and other instruments, and (ii) the laboratory measurements of the detection efficiency of the MCP (Tanaka et al., 2007), both of which have successfully reproduced what were obtained from the solar flare photon analyses. In addition, we found from the GEANT4 simulations that the effect of the rotation of the spacecraft was negligibly small around the spin phase angles corresponding to the two GFs.
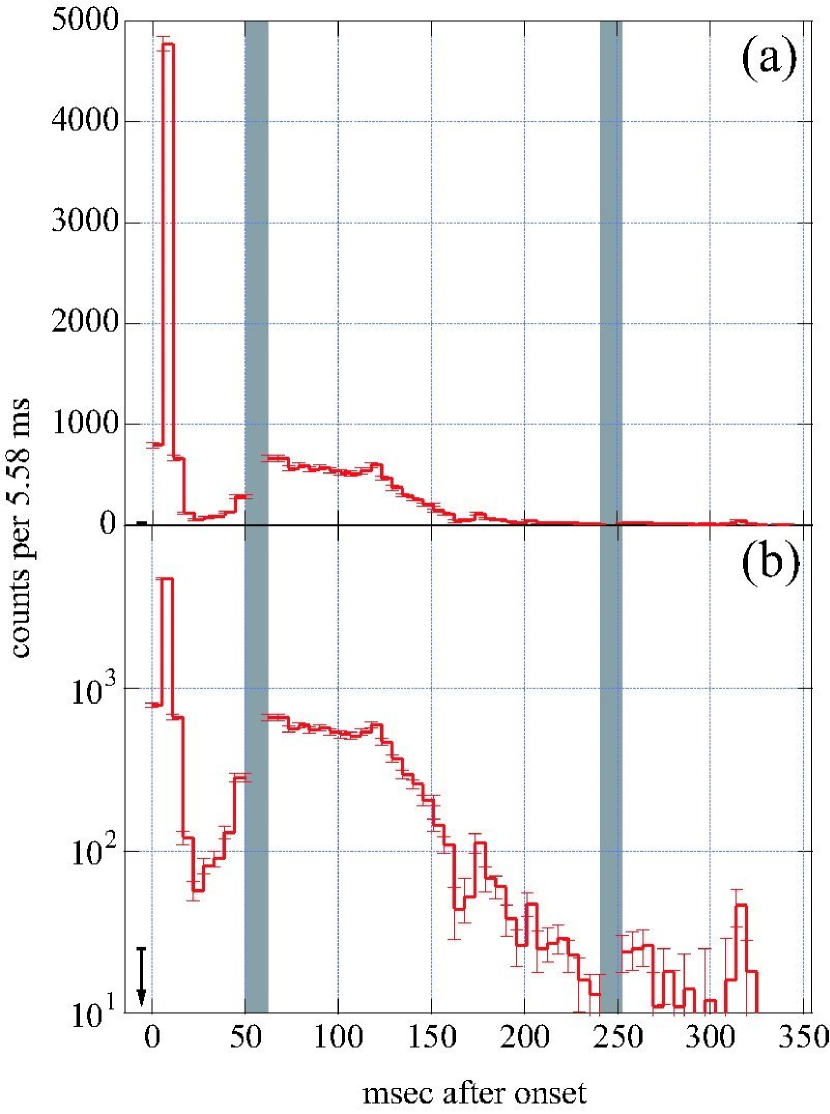
Fig. 1 shows the first 350 ms unsaturated peak profile of the GF from SGR 1900+14 on 27 August 1998. Dead time and saturation effects are negligible for the count rates smaller than 1000 counts per 5.58 ms: only the peak count at =5.58 ms was dead-time corrected. The shaded bars in Fig. 1 indicate the instrumental data gaps of 12 ms. The onset time (=0) was 10:22:15.47 UT, which coincided with the expected arrival time at the GEOTAIL position. Before the onset, the count was less than 25 counts per 5.58 ms (shown by a black arrow in Fig. 1(b)), i.e. the background level. Then it increased to 792 counts within 5.58 ms, and this rapid increase provided the upper limit of the e-folding time of the initial rise as 1.6 ms. After the onset, it reached a very sharp peak of 4776 counts at =5.58 ms. This increase yielded the e-folding time of the intermediate rise time to the peak as ms. Following the peak, it decayed rapidly. The exponential decay time was calculated as 2.90.2 ms from the counts for =5.622 ms. Note that the timing of the dip at =22 ms corresponds to the timing of the temporal count recovery from the total shut down of the Konus-Wind instrument (see Fig. 6 of Mazets et al. (1999)). After that, it increased again with e-folding time of 162.5 ms for =2250 ms and reached a flat-top second peak during 60120 ms. Finally the exponential decay was clearly observed and the decay time was obtained as 231.6 ms during =120160 ms. Note that a small hump was seen around 310 ms, which was also observed with the Konus-Wind instrument (Fig.6 of Mazets et al. (1999)).
To convert physical quantities such as an energy flux from the observed count rates, we need an assumption on the photon energy spectrum, because the LEP detected integrated photon numbers above 50 keV. We assume =240 keV optically thin thermal bremsstrahlung (OTTB) spectrum which was obtained from Ulysses observation (Hurley et al., 1999). Resultant physical quantities are tabulated in Table 1, combined with Venela observation of the SGR 0526-66 GF in 1979 (Mazets et al., 1999) and GEOTAIL observation of the SGR 1806-20 GF in 2004 (Terasawa et al., 2005). We found that the peak luminosity and the total emitted energy are erg s-1 and erg ( 50 keV), respectively. Here we assume that the distance to SGR 1900+14 is 15 kpc (Vrba et al., 2000) and . We also found that the total energy of this GF is about 130 times smaller than that of the 2004 December 27 GF from SGR 1806-20, although it is reported that the energy emitted during the pusating tail in each GF is comparable ( erg, see Table 1). (Hurley et al., 2005; Palmer et al., 2005; Mazets et al., 1999). Note that this difference by a factor of 130 is the same order of the radio observations: the radio afterglow of the SGR 1900+14 GF is approximately 500 times fainter than that of the SGR 1806-20 GF (Frail et al., 1999; Gaensler et al., 2005; Cameron et al., 2005).
3 Discussion
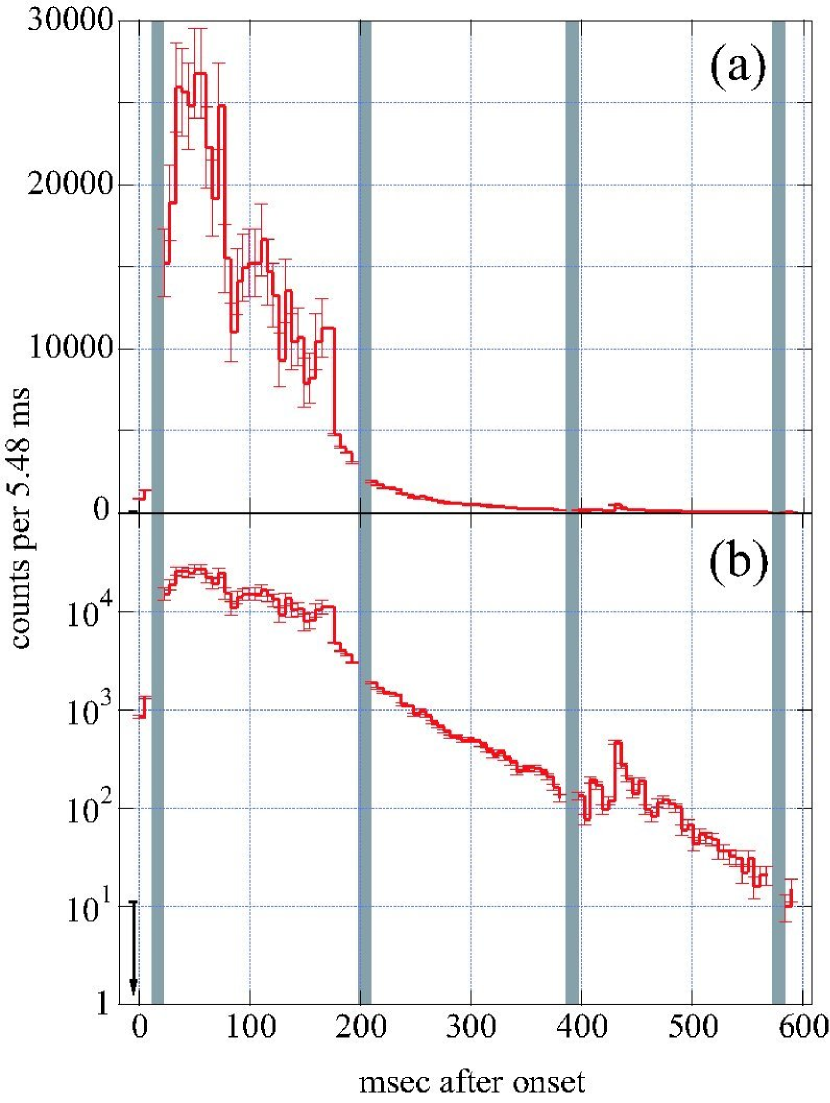
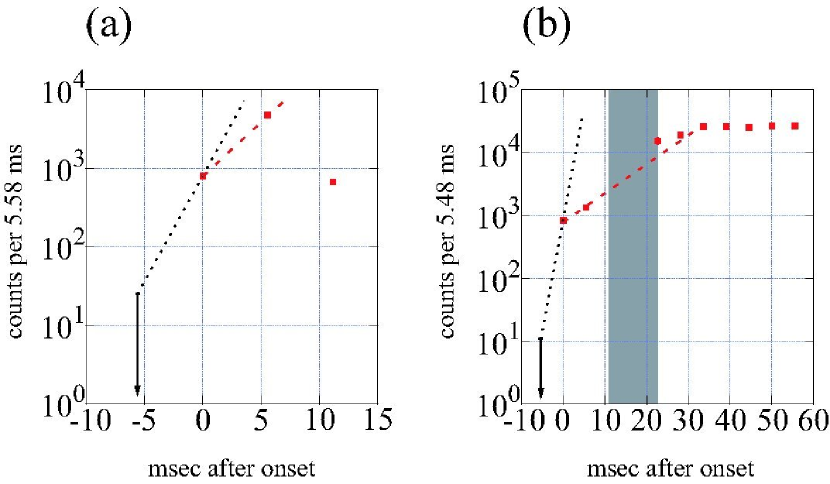
We observed two SGR GFs out of ever recorded three: from SGR 1900+14 in 1998 and SGR 1806-20 in 2004. Here we present a comparative study and extract characteristics of the initial spikes of the SGR GFs. Fig. 1 and Fig. 2 show the light curves of the initial spikes of SGR 1900+14 GF and SGR 1806-20 GF, respectively. Fig. 3 shows the detailed initial rise profiles of both GFs. From these light curves, we identify four common features: (1) initial steep rise (2) intermediate rise to the peak (3) exponential decay (4) small hump in the decay phase. The calculated e-folding times corresponding to the structures of (1)-(3) and the timing when we observed the structure (4) are tabulated in Table 1.
First, we focus on (1) initial steep rise. The observed initial rise time of SGR 1900+14 GF is ms. This is comparable to the initial rise time of ms observed in the SGR 1806-20 GF, implying the same physical mechanism producing the initial rapid energy release of these two GFs. Note that in the leading edge of the initial spike of SGR 1806-20 GF, Swift and Rhessi observed the similar timescale (Swift: 0.3 ms, Rhessi: ms) (Palmer et al., 2005; Boggs et al., 2006). These correspond to our observation of ms initial rise time. According to the reconnection model of GFs (Thompson & Duncan, 1995; Duncan, 2004), reconnection typically occurs at a fraction of the Alfven velocity (Thompson & Duncan, 1995; Duncan, 2004), and this interpretation leads to ms, where is the scale of the reconnection-unstable zone, and is the Alfven velocity in the magnetosphere. This theoretical timescale seems consistent with the observation of the initial rise time.
Next, we consider (2) intermediate rise to the peak. The observed e-folding rise time of the SGR 1900+14 GF is 3.1 ms, which is shorter than the 9.4 ms rise time observed in the SGR 1806-20 GF by factor of about 3.0. If this timescale is limited by the propagation of a fracture, we can infer the fracture size as (Thompson & Duncan, 2001). Using this, the fracture size of the SGR 1900+14 is estimated as 3.1 km, and that of the SGR 1806-20 is as km. It should be noted that our 9.4 ms rise time observed in the SGR 1806-20 GF differs by factor of 2 from 4.9 ms derived from the CLUSTER spacecraft observation of the same GF (Schwartz et al., 2005). The origin of the difference between these time scales is not understood, but could possibly attribute to the different energy coverages of the detectors. Unfortunately, since the energy response of the CLUSTER detectors against incoming X-ray and gamma-ray photons was not calibrated, further quantitative comparison between GEOTAIL and CLUSTER is not possible.
In the initial spike of the SGR 1900+14 GF in 1998, we found a deep dip and rebrightening following a sharp peak (Fig. 1). We propose that this dip explains the temporal recovery of the counter of the Konus-Wind (Mazets et al., 1999), since the dip and the recovery occurred nearly simultaneously. Note that Swift and Rhessi also detected a dip and rebrightening in the leading edge of the initial spike of the SGR 1806-20 GF (Palmer et al., 2005; Boggs et al., 2006), which could not be resolved by the GEOTAIL observation. This association implies that the dip and rebrightening are common features of the initial spikes of the SGR GFs, although theoretical interpretation is unclear.
Then, we concentrate on (3) exponential decay. The decay time of the SGR 1900+14 GF is 23 ms. This is shorter than the 66 ms decay time of the SGR 1806-20 GF by factor of 2.9, which roughly coincides with the factor 3.0 found in the intermediate rise times. From this similarity, we infer that the decay time is also proportional to the fracture size of a magnetar’s crust.
Finally, we focus on (4) small hump in the decay phase. Small humps are observed nearly at the same timing; 310 ms in 1998 and 430 ms in 2004 (note that the hump in 2004 GF was also observed with Swift satellite (Palmer et al., 2005)), although the total emitted energy differs by a factor of 130. This implies that the hump is caused by the continuing energy injections rather than the environmental interactions of the flare ejecta.
To conclude, the observed initial rise times imply that the onsets of both of the GFs result from magnetospheric instabilities. The intermediate rise times, on the other hand, are consistent with the idea that main energy release mechanism of the GFs is the large scale crustal fracturing. For this interpretation to be valid, magnetospheric instabilities should trigger the cracking of a magnetar’s crust. Further theoretical study is needed.
The above four structures discovered in the initial spikes may provide a clue to identify extragalactic SGR GFs among short GRBs. Recently, a possible detection of an extragalactic SGR GF is reported (Golenetskii et al., 2005). Bright short GRB 051103 was localized near the M81/M82 galaxy group by the interplanetary network. This association implies that the GRB 051103 is the SGR GF outside the local group. Furthermore, if the GRB 051103 is emitted from a SGR in M81, the isotropic total energy amounts to erg, which is the same order of the energy of SGR 1806-20 GF (Frederiks et al., 2006). Not only existence of star forming regions inside the IPN error quadrilateral of GRB 051103 but also no detection of optical and radio afterglow support the SGR hypothesis (Ofek et al., 2006). Here we investigate the hypothesis from the viewpoint of its light curve.
(1) The light curve of GRB 051103 observed by Konus-Wind showed a steep rise and the timescale is reported as 6 ms (Frederiks et al., 2006). This nearly corresponds to the intermediate rise time of a galactic SGR GF presented above, although we do not know whether the timescale observed by Konus-Wind represents an initial rise time or an intermediate rise time. Furthermore,(2) quasi-exponential decay was seen and the decay time is 55 ms (Frederiks et al., 2006). This timescale is also the same order of magnitude as the decay times presented above. These two similarities found in the light curves also support the SGR hypothesis. A hump in a decay phase was not seen in the light curve of GRB 051103. This is explicable in terms of the detector’s detection limit, because the flux of the humps, if exists, are expected to be about one hundredth of the peak flux.
References
- Boggs et al. (2006) Boggs et al. 2006, astro-ph/0611318
- Cameron et al. (2005) Cameron et al. 2005, Nature, 434, 1112
- Cheng et al. (1996) Cheng et al. 1996, Nature, 382, 518
- Duncan (2004) Duncan, R. C. 2004, in Cosmic explosions in three dimensions, ed. P. Höflich, P. Kumar, & J. C. Wheeler, 285–+
- Duncan & Thompson (1992) Duncan, R. C., & Thompson, C. 1992, ApJ, 392, L9
- Feroci et al. (2001) Feroci et al. 2001, ApJ, 549, 1021
- Frail et al. (1999) Frail et al. 1999, Nature, 398, 127
- Frederiks et al. (2006) Frederiks et al. 2007, Astronomy Letters, 33, 19
- Gaensler et al. (2005) Gaensler et al. 2005, Nature, 434, 1104
- Golenetskii et al. (2005) Golenetskii et al. 2005, GRB Coordinates Network, 4197, 1
- Göğüş et al. (2000) Göğüş et al. 2000, ApJ, 532, L121
- Hurley et al. (2005) Hurley et al. 2005, Nature, 434, 1098
- Hurley et al. (1999) Hurley et al. 1999, Nature, 397, 41
- Kosugi et al. (1991) Kosugi et al. 1991, Sol. Phys., 136, 17
- Kouveliotou et al. (1998) Kouveliotou et al. 1998, Nature, 393, 235
- Kouveliotou et al. (1999) Kouveliotou et al. 1999, ApJ, 510, L115
- Mazets et al. (1999) Mazets et al. 1999, Astronomy Letters, 25, 635
- Mazets & Golenetskii (1981) Mazets, E. P., & Golenetskii, S. V. 1981, Ap&SS, 75, 47
- Mazets et al. (1979) Mazets et al. 1979, Nature, 282, 587
- Mereghetti et al. (2005) Mereghetti et al. 2005, ApJ, 624, L105
- Mukai et al. (1994) Mukai et al. 1994, J. Geomag. Geoelectr., 46, 669
- Ofek et al. (2006) Ofek et al. 2006, ApJ, 652, 507
- Palmer et al. (2005) Palmer et al. 2005, Nature, 434, 1107
- Schwartz et al. (2005) Schwartz et al. 2005, ApJ, 627, 129
- Tanaka et al. (2007) Tanaka et al. 2007, Review of Scientific Instruments, 78, 034501
- Terasawa et al. (2005) Terasawa et al. 2005, Nature, 434, 1110
- Thompson & Duncan (1995) Thompson, C., & Duncan, R. C. 1995, MNRAS, 275, 255
- Thompson & Duncan (1996) —. 1996, ApJ, 473, 322
- Thompson & Duncan (2001) —. 2001, ApJ, 561, 980
- Vrba et al. (2000) Vrba et al. 2000, ApJ, 533, L17
- Woods & Thompson (2004) Woods, P. M., & Thompson, C. 2004, astro-ph/0406133
| SGR 1900+14 | SGR 1806-20 | SGR 0526-66 | |
| Initial Spike | |||
| E-folding initial rise time [ms] | |||
| E-folding intermediate rise time [ms] | 9.41.1 | - | |
| Exponential decay time [ms] | 231.6 | 6612 | |
| Timing of Small hump [ms] | 310 | 430 | - |
| Peak photon flux [photons cm-2 s-1] | - | ||
| Peak flux [erg cm-2 s-1] | |||
| Peak luminosity [erg s-1] | |||
| Fluence [erg cm-2] | |||
| Total Energy [erg] | |||
| Energy range | 50 keV | 50 keV | 30 keV |
| Pulsating Tail | |||
| Tail Energy [erg] | |||
| Energy range | 15 keV | 3100 keV | 30 keV |
| Reference | 1 | 2, 3 | 1 |