The Incidence of Highly-Obscured Star-Forming Regions in SINGS Galaxies
Abstract
Using the new capabilities of the Spitzer Space Telescope and extensive multiwavelength data from the Spitzer Infrared Nearby Galaxies Survey (SINGS), it is now possible to study the infrared properties of star formation in nearby galaxies down to scales equivalent to large H ii regions. We are therefore able to determine what fraction of large, infrared-selected star-forming regions in normal galaxies are highly obscured and address how much of the star formation we miss by relying solely on the optical portion of the spectrum. Employing a new empirical method for deriving attenuations of infrared-selected star-forming regions we investigate the statistics of obscured star formation on 500 pc scales in a sample of 38 nearby galaxies. We find that the median attenuation is 1.4 magnitudes in H and that there is no evidence for a substantial sub-population of uniformly highly-obscured star-forming regions. The regions in the highly-obscured tail of the attenuation distribution (A 3) make up only 4% of the sample of nearly 1800 regions, though very embedded infrared sources on the much smaller scales and lower luminosities of compact and ultracompact H ii regions are almost certainly present in greater numbers. The highly-obscured cases in our sample are generally the bright, central regions of galaxies with high overall attenuation but are not otherwise remarkable. We also find that a majority of the galaxies show decreasing radial trends in H attenuation. The small fraction of highly-obscured regions seen in this sample of normal, star-forming galaxies suggests that on 500 pc scales the timescale for significant dispersal or break up of nearby, optically-thick dust clouds is short relative to the lifetime of a typical star-forming region.
Subject headings:
galaxies: photometry – galaxies: ISM – stars: formation – H ii regions1. INTRODUCTION
Stars form enshrouded in their parent molecular clouds, but in time clusters of stars emerge from the obscuring dust and gas as H ii regions and disperse part of this natal material. In the simplest case, the emission that we observe from such systems should undergo a transition from being strongly attenuated in the optical and ultraviolet (UV) to being less attenuated as the stars begin to break free of their birth clouds.
In reality, the amount of obscuration observed in regions of star formation can vary widely depending on the environment. In nuclear starburst galaxies, V-band attenuations ()111The attenuation at a given wavelength is defined as where is the assumed reddening curve and is the color excess (e.g., Calzetti et al., 2001). For comparison purposes, in this paper we assume . as high as 10-100 magnitudes are commonplace. The most well-studied of all, M82, has a central starburst with A25-30 (Rieke et al., 1980; Puxley, 1991; Mattila & Meikle, 2001), and the central starbursts of NGC 253 and NGC 4945 show -band attenuations of 30-100 magnitudes (Genzel et al., 1998). In a number of well-studied dwarf and irregular galaxies, a few compact regions dominate the infrared flux of the galaxy but remain invisible in the optical: Henize 2-10 (Kobulnicky & Johnson, 1999; Vacca et al., 2002; Cabanac et al., 2005), NGC 5253 (Gorjian et al., 2001), SBS 0335-052 (Plante & Sauvage, 2002; Dale et al., 2001; Houck et al., 2004), and II Zw 40 (Beck et al., 2002). Soifer et al. (2001) found that more than half of the infrared luminosity in infrared-luminous starburst galaxies is generated in regions 100 pc–1 kpc in size, and in the Antennae merger system, Mirabel et al. (1998) found that the most intense star-forming region is located outside both galaxy nuclei in an 50 pc area that is entirely unremarkable at optical wavelengths.
In contrast to these highly obscured cases, most normal H ii regions show attenuations of only a few magnitudes. In the Large Magellanic Cloud, an magnitude is typical (Caplan & Deharveng, 1986; Bell et al., 2002). Balmer decrement measurements for optically-selected H ii regions in samples of spiral galaxies yield attenuations of A0.3-3.5 magnitudes (Zaritsky et al., 1994). The mean -band attenuation derived from radio continuum measurements for H ii regions in nearby galaxies is 1.7-2.0 magnitudes (Israel & Kennicutt, 1980; van der Hulst et al., 1988).
Probing to smaller scales in the Milky Way, we see examples of a highly-embedded phase of star formation in the form of compact, ultracompact, or even “superultracompact” H ii regions which range in size from 1 pc down to 0.01 pc (Kurtz, 2000). A study of the compact H ii region S88B measured attenuations of A along with attenuation gradients that suggested gaps in the molecular cloud had allowed optical emission to emerge alongside the thermal dust emission in the infrared (Goetz et al., 2003). Results from carbon recombination line studies of ultracompact H ii regions such as those in the W48 star-forming complex are consistent with being pressure-confined (Roshi et al., 2005a, b).
The new capabilities of the Spitzer Space Telescope (Werner et al., 2004) allow us to investigate the infrared properties of star formation within nearby galaxies down to scales as small as several hundred parsecs, the size of large H ii regions. We are thus able to ask the following question: what fraction of infrared-selected star-forming regions in normal galaxies are highly obscured? In other words, how much of the star formation in these galaxies have we been missing on these scales by only looking in the optical portion of the spectrum?
Spitzer also gives us a new way to investigate radial attenuation properties of nearby galaxies. Previous studies have found evidence for decreasing radial gradients in attenuation in samples of late-type galaxies using far-infrared to ultraviolet (FIR/UV) profiles and UV colors (Boissier et al., 2004, 2005; Popescu et al., 2005; Hill et al., 1997) and in highly-inclined galaxies using broadband optical and near-infrared colors (Jansen et al., 1994). In a detailed study of NGC 300, Roussel et al. (2005) found a decreasing radial gradient in total infrared to far-ultraviolet (TIR/FUV). They suggest that while variations in the metallicity, and presumably in the dust-to-gas ratio, may play a role in producing this gradient, other factors such as local variations in geometry or spectral energy distribution (SED) may be more important. In contrast, Zaritsky et al. (1994) found radial gradients in metallicity using optical spectra but saw only weak evidence for a gradient in attenuation. With the advent of Spitzer, these questions can now be investigated on the scale of individual star-forming regions.
Taking advantage of the improved mid- and far-infrared resolution and sensitivity of Spitzer, the Spitzer Infrared Nearby Galaxies Survey (SINGS) is a multiwavelength imaging and spectroscopic survey of 75 galaxies within 30 Mpc (Kennicutt et al., 2003). Designed to span the range of properties seen in nearby, normal galaxies, SINGS includes large spiral galaxies such as M51 and M81 as well as dwarf galaxies. In addition to the Spitzer MIPS, IRAC, and IRS datasets, SINGS boasts a suite of ancillary data from radio continuum, HI, and CO to ground-based , P, H, UV, and X-ray wavelengths. This combination of high resolution and multiwavelength coverage opens up the possibility of studying the attenuation properties of infrared-selected star-forming regions drawn from the local population of nearby galaxies.
In this work, we investigated the attenuation properties of infrared-selected star-forming regions drawn from a sample of SINGS galaxies using multiband photometry and an empirical method for deriving attenuations of infrared-selected star-forming regions. The paper is organized as follows. We describe our galaxy sample in Section 2 and the observation and reduction steps in Section 3. In Sections 4 and 5 we describe our method of multiband photometry and our treatment of H attenuation measurements. In Section 6 we present evidence of a paucity of large highly-obscured regions and of galaxy-wide radial trends in attenuation. We discuss the implications of these results for the lifetimes of star-forming regions in Section 7, and we conclude in Section 8.
2. THE GALAXY SAMPLE
The SINGS sample was selected to span the range of properties seen in nearby normal galaxies. While not numerically representative of the local volume (Kennicutt et al., 2007b), the survey was constructed to contain objects with the full range of morphological types, luminosities, and FIR/optical luminosity ratios (Kennicutt et al., 2003). The subset used in this work consists of 38 galaxies and represents nearly all of the galaxies in SINGS that have discrete infrared star-forming regions. For reference, Table 1 gives the list of galaxies included in this work along with pertinent information. The quoted magnitudes are total broadband magnitudes uncorrected for Galactic extinction and inclination and derive from the Third Reference Catalog of Bright Galaxies (de Vaucouleurs et al., 1991, hereafter RC3). The galaxy dimensions were taken from Kennicutt et al. (2003); the morphological types were taken from RC3. The inclinations were calculated using the quoted galaxy dimensions and position angles taken from the 2MASS Large Galaxy Atlas (Jarrett et al., 2003), and the following standard equation (Holmberg, 1958):
| (1) |
where and are the optical major and minor axis diameters, and where , the intrinsic optical axis ratio for an edge-on system, is set to 0.2 (Tully & Fisher, 1977). In the clearly edge-on cases – NGC 3190 and NGC 4631 – the inclination was set to 90∘, and the irregular galaxy NGC 6822 was set to an inclination of 0∘. While inclinations derived in this manner suffer from systematic errors due to warps and spiral arms, kinematically-derived inclination measurements exist for only a subset of the galaxies (The HI Nearby Galaxies Survey, THINGS: Walter et al., 2005). We have used the subset of our galaxy sample for which kinematically-derived inclinations exist in order to estimate the error in applying equation 1. The quoted error is the standard deviation of three measurements: the inclination derived from 2MASS ellipticities, an inclination derived by fitting an ellipse to the IRAC 3.6 m data, and the kinematically-derived inclination from THINGS. We quote the average error (7 degrees) for all other cases in which kinematically-derived inclinations are not available. The distances were taken from a number of sources with preference given to direct distance measurements from the literature; where direct measures were not available, we used flow-corrected estimates from Masters et al. (2007) (H km/s/Mpc).
3. OBSERVATIONS AND REDUCTIONS
The Spitzer images used in this work consist of the MIPS (Rieke et al., 2004) 24 m and the IRAC (Fazio et al., 2004) 3.6, 4.5, 5.8, and 8.0 m datasets obtained as part of the SINGS project. The MIPS data reduction is described in Gordon et al. (2005), the IRAC data reduction in Regan et al. (2004). The ground-based H and -band images were obtained at NOAO using the KPNO 2.1-meter and CTIO 1.5-meter telescopes between 2001 and 2003. A description of the SINGS observing strategy can be found in Kennicutt et al. (2003).
Prior to beginning our analysis, the images were aligned, resampled to the same pixel scale, and convolved to match the full-width-half-maximum (FWHM) of the MIPS 24 m point-spread-function (PSF) using SINGS_TOOL222SINGS_TOOL is an IDL program developed by Don Lindler (2006) for the SINGS Team for the automatic registration, alignment, resampling, and PSF-matching of multiwavelength images.. Convolving to the 24 m PSF mitigates some of the inconsistency that would result from comparing higher resolution ground-based optical data with lower resolution 24 m imaging where some fraction of the light from a given point source has spilled into neighboring regions. The 24 m PSF, however, has fairly large diffraction lobes that are not replicated during our simple Gaussian convolution; for this reason, aperture corrections are applied at all wavelengths as described in Section 4.
In order to correct the H images for the stellar continuum contribution, we subtracted off a scaled R-band image. The resultant images were corrected for [N ii]6548,6584Å emission and the transmission curve of the H filter; these methods are described in more detail in Kennicutt et al. (2007b). Where available, the applied [N ii]H ratios were taken from SINGS radial driftscan spectra, where available (Moustakas & Kennicutt, 2006). Otherwise the corrections are approximate values derived from the -band magnitude of the galaxy and the following empirical relation (Moustakas et al., 2007):
| (2) |
| (3) |
where . This relation is based on a sample of integrated spectra of galaxies (Moustakas & Kennicutt, 2006; Jansen et al., 2000) with the AGN component removed as described in Moustakas et al. (2006). Table 2 summarizes the correction factors used.
4. REGION SELECTION AND MULTIBAND PHOTOMETRY
Since most regions are unresolved at the 24 m resolution (6 arcseconds), we selected regions in the 24 m image using DAOfind, a point-source selection task included in the DAOphot stellar photometry package (Stetson, 1987). For the initial selection we set a detection threshold of 10, which corresponds to a typical infrared luminosity limit of 3 erg s-1); the infrared luminosity limits for each galaxy are given in Table 1. For reference, the lowest corresponding H luminosity limit is comparable to the luminosity of a few Orion-type H ii regions (erg s-1). The median 24 m luminosity of the region sample is 1040, corresponding to a median H luminosity of 21038 erg s-1 or a few tens of Orion-type H ii regions.
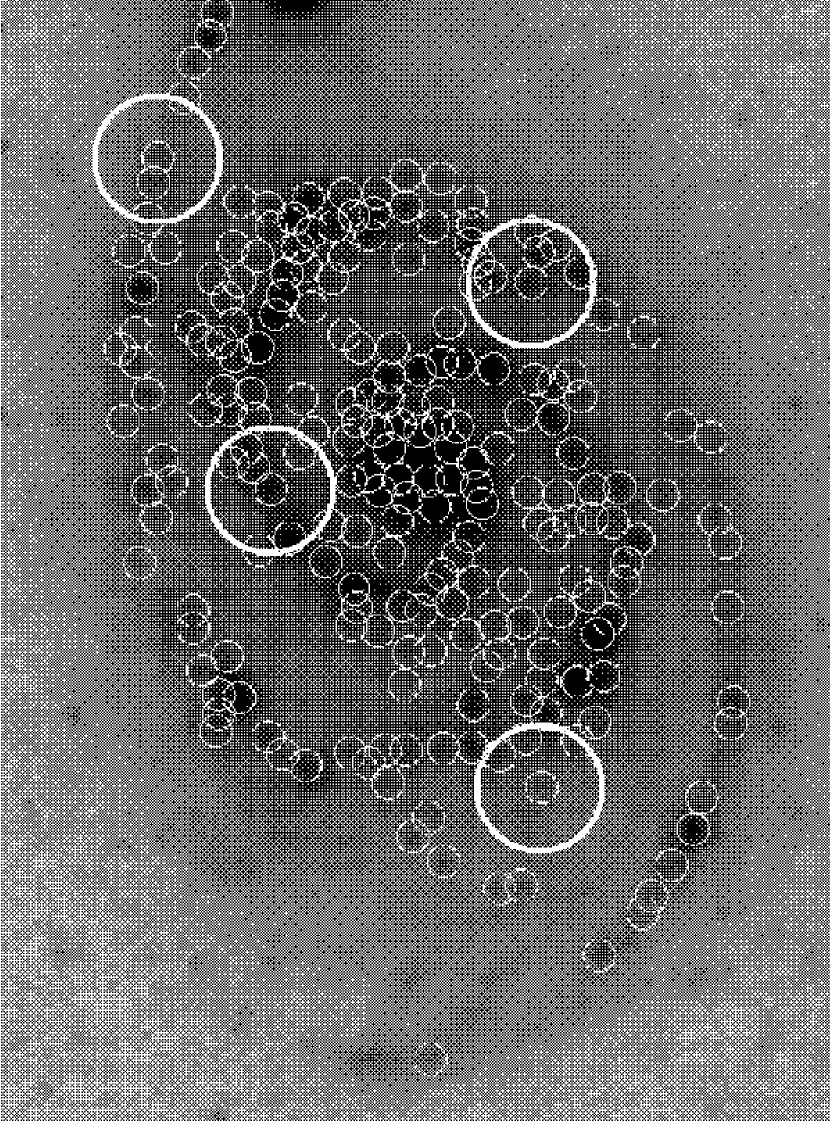
We measured region fluxes using 500 pc diameter circular apertures ( 13″ for a galaxy at 8 Mpc). While this aperture size is larger than a typical H ii region (100 pc), it was chosen as a compromise in order to accommodate the large 24 m PSF and to allow a comparison of regions of the same physical size between galaxies at different distances. As an example, in Figure 1 we show the 24 m image of NGC 5194 with the final region selection of 500 pc circular regions marked. In some cases, a 500 pc region was smaller than the FWHM of the 24 m PSF; the aperture corrections discussed below were used to address this issue.
Measuring robust fluxes for this work was complicated by the issue of how to determine the background value that should be subtracted from the raw region flux measurement. In addition to the sky background of the image, each 24 m source sits on top of a diffuse component associated with the overall galaxy profile and internal structures such as spiral arms. Simple aperture photometry methods dictate using an annulus around each aperture to get a measure of the local background; however at the 24 m resolution many star-forming regions lie within what would make up the sky annulus of a neighboring region, thereby contaminating the background estimate. On the other hand, ignoring the contribution of the diffuse component and subtracting only a global sky background is not entirely satisfactory either as it systematically overestimates the flux by 1–10% for regions on spiral arms or near the center of the galaxy.
For this study, therefore, we employed three separate methods of sky subtraction. First, we used a global sky subtraction method by subtracting a simple sky background defined as the -clipped mean value from two off-galaxy portions of the image. Second, we employed a local background subtraction method where we measured the background within large annuli (spanning from the measurement aperture to an outer radius equal to 4 times the measurement aperture radius) centered on each region using a -clipped mode or mean estimation technique. The large annuli are needed to minimize contamination due to the inclusion of neighboring IR-selected regions. To further reduce contamination, we removed pixels assigned to neighboring IR-selected regions prior to calculating the local background value. The success of this technique depends on the size of the background annuli used as well as properties of the galaxy such as the inclination, the spacing of the spiral arms, and the surface density of star-forming regions across the face of the galaxy. Figure 1 shows a small subset of the background annuli used in the case of NGC 5194. Finally, we applied a profile background subtraction method which involved dividing the galaxy into elliptical annuli according to the inclination and position angle and deriving a -clipped mean background value at each radius. As in the local background subtraction method, we removed pixels belonging to IR-selected regions prior to calculating the background value in order to reduce the effects of contamination. This method is less sensitive to neighbor contamination than the local background method, but it does assume azimuthal symmetry. Fortunately, a majority of the targets in our current study are spiral galaxies that do not deviate far from this assumption.
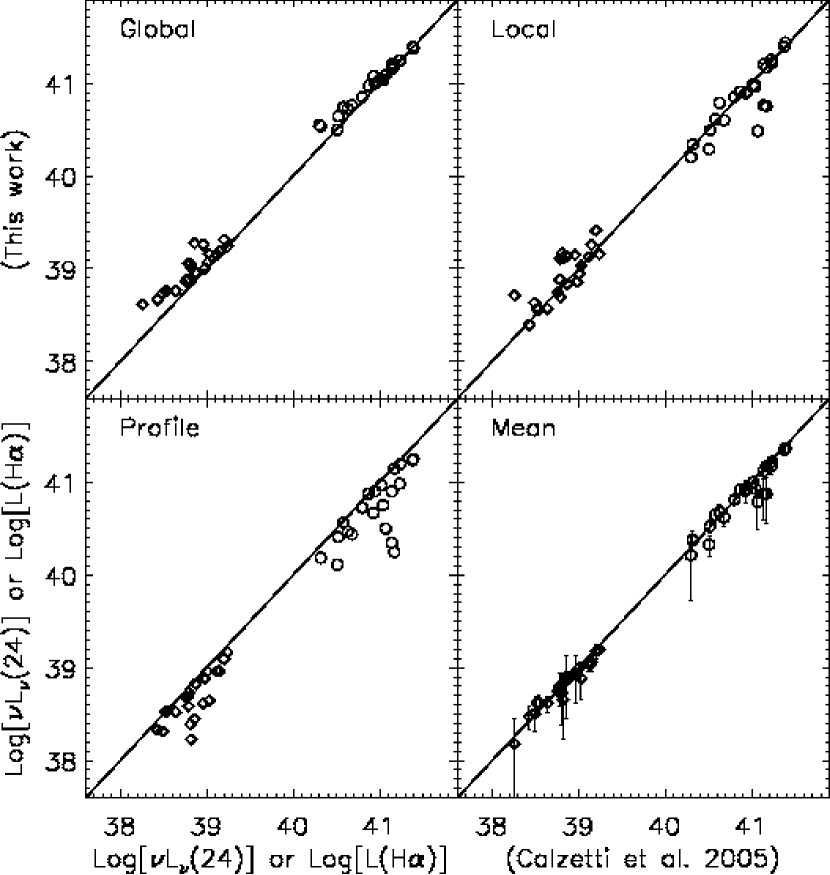
As an independent check on our background methods, we compared our flux measurements with those of Calzetti et al. (2005), a detailed multiwavelength study of NGC 5194. In that study background subtraction of region flux measurements was done using many rectangular background areas defined by hand with statistics computed on the portion of the background area appropriate to the region being measured. We make the assumption that the level of fine-tuning demonstrated in Calzetti et al. (2005) for NGC 5194 provides the closest approximation of the true local background for each region that one could achieve in treating each galaxy by hand. In the first three panels of Figure 2 we show a comparison between the 24 m and H luminosities measured with each of the three background methods versus those of Calzetti et al. (2005) for a matched sample of 13 arsecond (517 pc) regions in NGC 5194. We find that the most luminous regions are measured consistently regardless of the background subtraction method because the background flux makes up a very small fraction of the raw region measurement. For faint, low surface brightness regions, however, the background is a more considerable portion of the measurement and thus the final value is highly dependent on the method applied. The global sky subtraction systematically underestimates the background because it neglects the diffuse component of the galaxy. The local background subtraction using large sky apertures is robust in many cases but tends to fail in crowded areas. The profile background subtraction tends to overestimate the background in interarm regions and underestimate the background in the spiral arms. Taken together, there is no standard method for dealing with the complexity of these nearby galaxies that is not in some way biased by the assumptions made or by the manner in which it is applied. In this work, we have taken the average of these three methods as our best estimate of the flux and quote a standard error of the mean. In doing so, we reject individual measurements that are negative (i.e., the background was estimated to be higher than the source) as unphysical and average the remaining two measurements; this occured in only a small fraction (5%) of the region sample. The success of the average versus the results of Calzetti et al. (2005) is shown in the last panel of Figure 2.
We estimated aperture corrections using the available MIPS and IRAC PSFs333http://ssc.spitzer.caltech.edu/mips/psf.html; http://ssc.spitzer.caltech.edu/irac/psf.html as well as Gaussian PSF models derived from measurements of the H and images. Since the images are all convolved with a large Gaussian kernel in order to match the 24 m data, the resulting PSF profiles are nearly Gaussian, particularly in the ground-based data. However, the aperture corrections for the ground-based and IRAC images are higher than they would be for unconvolved data due to the fact that our convolution does not precisely replicate the 24 m diffraction lobes. The aperture corrections were independently derived for each galaxy depending on the aperture sizes used; Table 3 summarizes these corrections.
Contaminant sources that show up in the 24 m images arise from either the Rayleigh-Jeans emission of foreground stars or the redshifted emission of background galaxies. We flagged objects that are located at a distance greater than from the center of the galaxy or that are included in the USNO catalog (Monet et al., 1998) or 2MASS point source catalog (Skrutskie et al., 2006). We also removed the 24 m detections corresponding to the galaxy nucleus to avoid contamination of our region sample by embedded AGN. To verify the contaminant selection and ensure that the 2MASS catalog did not accidentally identify objects within the galaxy, we then did a visual inspection of the images to confirm or reject the flagged objects as contaminants based on morphology in the unconvolved IRAC and ground-based images.
Depending on the distance of the galaxy, and therefore the luminosity sensitivity limit, the output of DAOFIND may include many regions that, when measured with 500 pc apertures, are significantly overlapping. The net effect is that the same patch of a galaxy could be measured multiple times, and while this double-counting would not affect our results qualitatively, it would artificially boost the number of 500 pc regions measured in the nearest galaxies. To limit this problem, we culled the region sample, weighting by a region’s 24 m flux in order to remove cases that overlapped spatially with a nearby, brighter region by more than 20%.
5. H ATTENUATIONS
Most previous measurements of dust attenuations for H ii regions in normal galaxies have been based on Balmer decrements (e.g., H/H ratios) derived from optical spectra (e.g., McCall et al., 1985; Caplan & Deharveng, 1986; Zaritsky et al., 1994), or in a few instances P/H decrements (Quillen & Yukita, 2001; Scoville et al., 2001). However such studies are based on star-forming regions selected from optical or near-infrared emission lines, and since our primary interest is in very dusty regions, we need a method for estimating the nebular attenuations that is valid for regions with up to several magnitudes of visual attenuation. A few authors have used multi-frequency radio continuum maps together with H photometry to estimate thermal radio fluxes and H attenuations, but this method is limited to the brightest 10–30 H ii regions in the nearest galaxies (e.g., Kaufman et al., 1987; van der Hulst et al., 1988). Instead we use the combination of mid-infrared luminosities and H luminosities of the star-forming regions to derive attenuation estimates for an infrared-selected sample.
Our method is based on the recent work by Kennicutt et al. (2007a), who have generated a prescription for estimating H attenuations () of star-forming regions using measurements of the 24 m and H fluxes for individual star-forming regions. This empirically-derived method treats the 24 m flux of a region as a tracer of the obscured portion of the emission due to star formation and the uncorrected H flux as a tracer of the unobscured portion. The attenuation is then related to the ratio of the total [24m+H] emission relative to the unobscured emission:
| (4) |
where stands for the uncorrected H luminosity in erg s-1 and indicates the “monochromatic” 24 m luminosity also in erg s-1. The coefficient 0.038 in eq. 4 was calibrated using H/P attenuation measurements of 42 H ii regions in M51 from Calzetti et al. (2005).
As is emphasized in Kennicutt et al. (2007a), this method provides only an approximate estimate of the attenuation on an object by object basis, because the actual ratio of 24 m luminosity to H luminosity of a given object will depend on variable factors such as the geometry of the stars, dust, and gas and the ratio of ionizing flux to bolometric luminosity of the OB association, which in turn varies with the age and mass function of the embedded cluster. This scatter can be quantified by comparing attenuations derived from eq. 4 with independent measurements from the P/H decrements or other methods. Such comparisons have been carried out for large samples of H ii regions in M51 and M81 by Calzetti et al. (2005) and Pérez-González et al. (2006) and for 220 regions in 33 galaxies by Calzetti et al. (2007). Comparisons of attenuation-corrected H fluxes with those derived via this infrared method show dispersions of 0.3 dex, which corresponds to uncertainties in the individual H attenuation measurements of 0.60.8 magnitudes. This confirms that this method provides only a crude estimate of the H attenuation for any individual H ii region. However since the main aim of this paper is to identify strongly obscured regions ( magnitudes), this precision is more than adequate for our purposes. Nevertheless readers should bear in mind the uncertainties associated with individual attenuation measurements.
6. RESULTS
6.1. Distribution of Star-Forming Region Attenuations
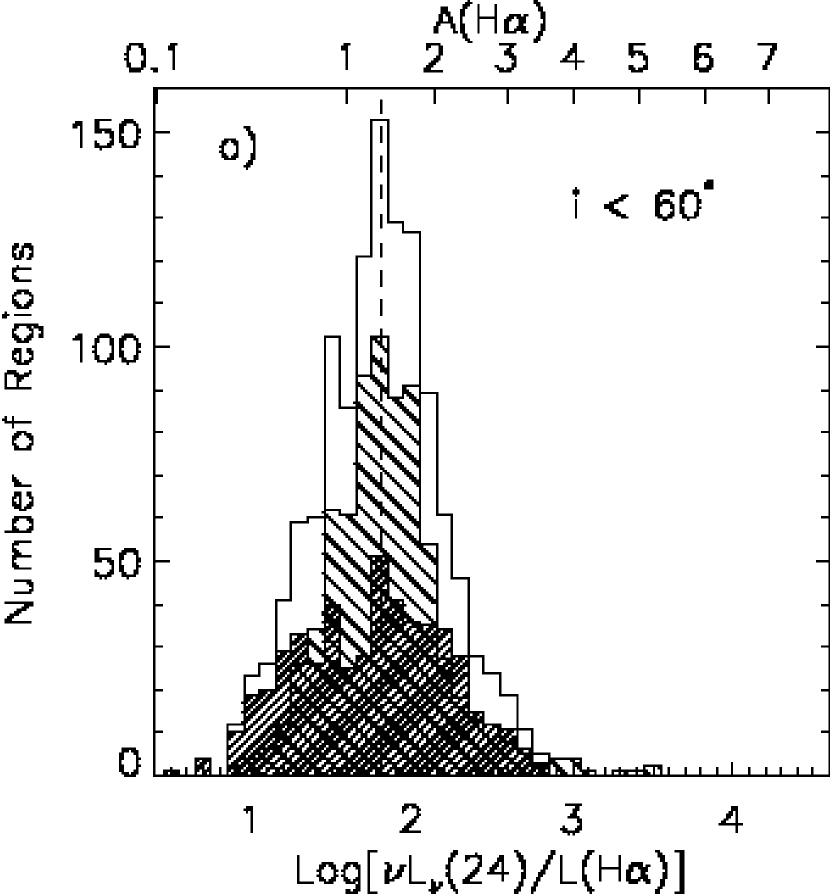
In order to address the question of how many infrared-selected regions are highly obscured, we used 24 m and H photometry to investigate the statistics of obscured star formation on 500 pc scales in a subset of SINGS galaxies. For our primary region sample, we identified a total of 1772 regions using the 24 m datasets as discussed above. In Figure 3a we show a histogram of Log[/L(H)] along with the corresponding H attenuations. From the distribution of attenuations it is immediately clear that we do not see a large sub-population of highly-obscured star-forming regions within this infrared-selected sample on 500 pc spatial scales. The median value is 1.8 which corresponds to an H attenuation of 1.4 magnitudes (A 1.7), and there is a slight tail to attenuations higher than 3-4 magnitudes (skew = 0.35). Contaminant sources such as foreground stars or background galaxies would also populate the high attenuation portion of parameter space; to address this concern, we carefully verified that contaminant sources had been removed from the sample using the approach described in Section 4. At this point, we must make clear what is meant by the “highly obscured population” or “subpopulation.” Our beam encompasses many tens or hundreds of massive stars (see Table 1, minimum luminosities) and entire giant molecular clouds (GMCs). If all the stars are uniformly attenuated, then in Figure 3 represents the attenuation to each star. However, if, as is likely, some of the stars lie outside the GMC (due to breakout, blister Hii regions, etc.) and some of the stars are embedded, then the represents an average attenuation, weighted heavily toward the unattenuated stars. In this study, we do not find evidence for any large subpopulation of uniformly highly-obscured star-forming regions on 500 pc scales; we discuss the question of smaller scales in Section 7.1.2.
Figure 3b presents the same data in the form of a cumulative histogram. For illustration, the cumulative distribution can be fit by a simple power law with an index of 1.4 with high significance () suggesting that the higher attenuation regions are simply an extension of a smooth distribution. To quantify the fraction of regions in the highly-obscured tail relative to the entire sample, we make a cut at Log[/L(H)] (A 3.3, A). This cut corresponds to 2 times the standard deviation of a Gaussian fit to the overall region distribution. By this definition, the number of regions in the sample found in this highly-obscured tail of the distribution is 69, 4% of the sample.
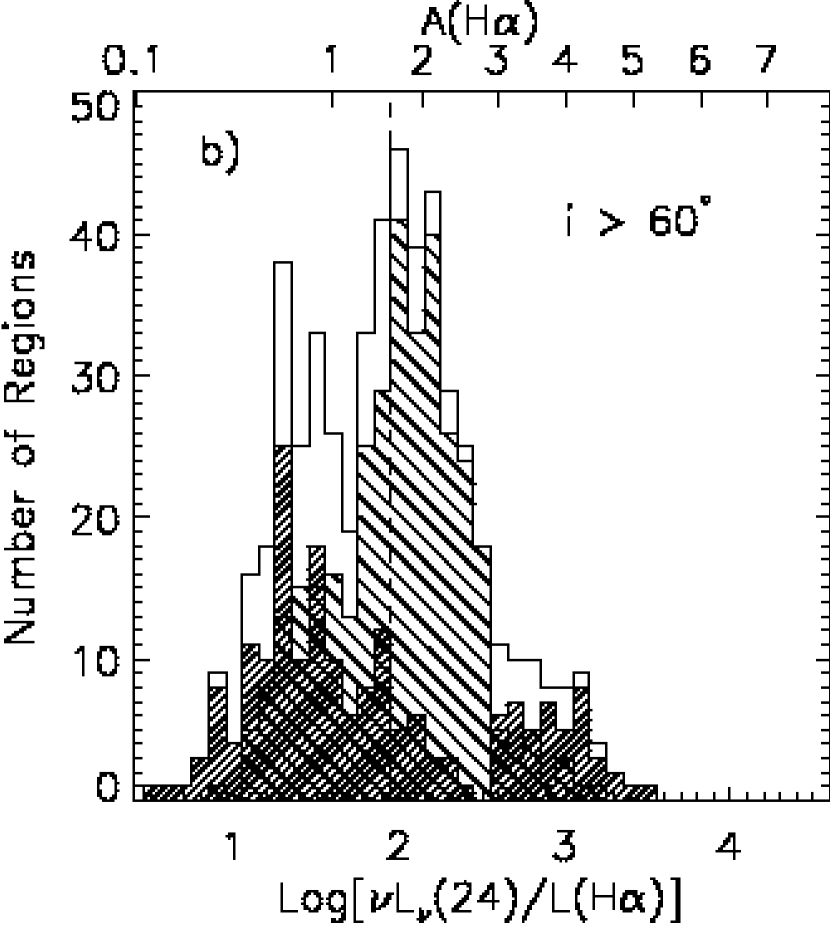
Thus far, we have treated the entire sample of regions as one; however, the attenuation distribution changes slightly if we divide the sample by inclination and luminosity. In Figure 4, we have split the sample into two panels by the inclination of the host galaxy, where high inclination is defined here as . The median Log[/L(H)] values from the low and high inclination subsets are essentially equal within the errors — 1.8 for the low inclination and 1.9 for the high inclination cases. More striking, however, is the difference in shape between the two distributions: the low inclination subsample distribution is more sharply peaked (kurtosis=0.71, with 0 signifying a normal distribution) than that of the high inclination subsample (kurtosis=-0.28). This likely reflects the fact that the use of our empirical attenuation method becomes more complicated at high inclination; measured attenuations may be boosted in some cases due to increased pathlength through the disk, causing larger scatter. In addition, at the highest inclinations the region selection will be affected by confusion, and there may be a bias towards selecting more regions from the near side of the galaxy. In each panel of Figure 4, we divide the subsample into two bins of total galaxy 24 m luminosity, divided at the region-weighted mean galaxy 24 m luminosity of the sample (8.41042 erg s-1). The region attenuation distributions are similar to that of the full sample, with minimal change in the median attenuation as a function of galaxy luminosity. Thus, highly-obscured regions are drawn from both high and low luminosity galaxies.
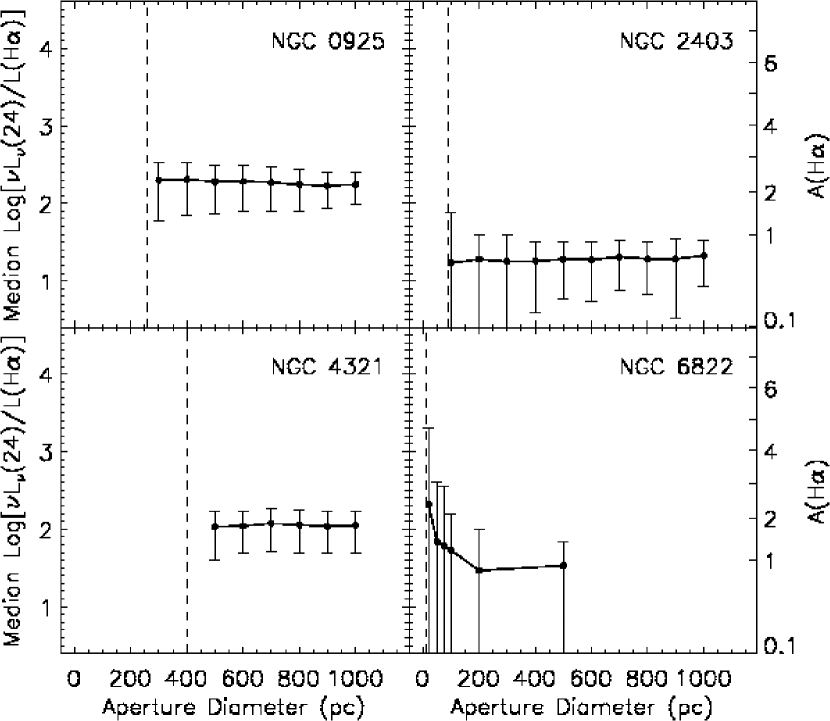
In this study we are interested in the attenuation properties of star-forming regions on large, 500 pc scales. It is important to note, however, that this aperture may be much larger than the size of a given star-forming region as viewed at 24 m. To get a sense of how the chosen aperture size affects our results, we have done photometry at scales spanning between roughly 200 and 1000 pc for most of the sample, between 100 and 1000 pc for NGC 2403 (a particularly nearby case at 3.2 Mpc), and down to 20 pc for NGC 6822 (a dwarf galaxy at 0.5 Mpc). In Figure 5 we plot the median galaxy 24m/H ratio versus aperture size for a representative set of 4 galaxies: NGC 0925, NGC 2403, NGC 4725, and NGC 6822. The vertical dashed line represents the point at which the aperture diameter is equal to the FWHM of the 24 m PSF, and below which the aperture measurement effectively undersamples the PSF. We see very little variation in the median attenuation down to 100 pc scales, while the scatter increases slightly over this range with decreasing aperture size. In our most nearby case, NGC 6822, we do see a significant rise in our measured attenuation as we probe below 100 pc, but at these scales we are also likely seeing the effects of the complex morphologies of H structures - shells and bubbles - that may be offset spatially from the brightest corresponding 24 m source. For the purposes of the current study, this analysis illustrates the fact that our application of the empirical method applies to large scales, i.e. greater than 100 pc, where the results are fairly insensitive to the particular aperture diameter chosen.
6.2. Infrared Colors of Star-Forming Regions
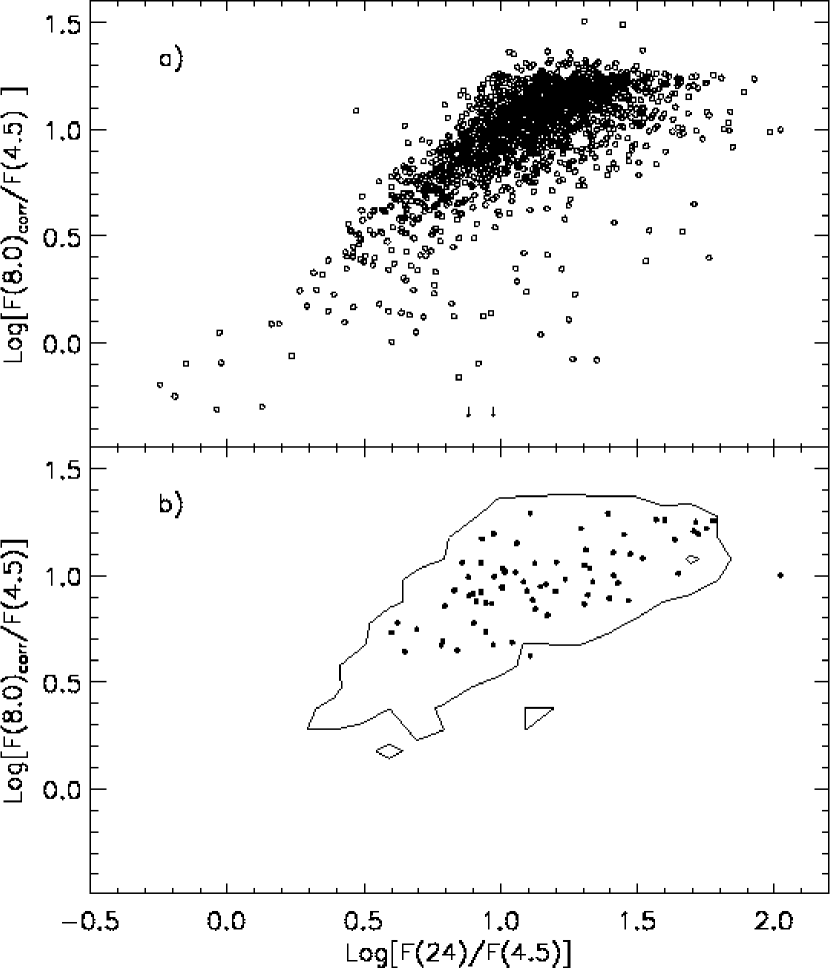
The infrared colors of the entire sample of regions are presented as flux density ratios in Figure 6. Following the discussion of Dopita et al. (2005) we have chosen F(8.0)/F(4.5) versus F(24)/F(4.5) as a representative pair of colors that include contributions from the stellar (4.5 m), PAH (8.0 m), and dust (24 m) components of a given region, although we note that the IRAC bands do not sample the 10 m silicate feature. We have corrected the 8.0 m flux densities for the contribution of stellar emission using the following relation:
| (5) |
where F(8.0)corr is the corrected 8.0 m flux density, F(8.0) is the observed value, and F(3.6) is the 3.6 m stellar flux density (Helou et al., 2004). The contribution of dust emission to the 3.6 and 4.5 m bands is assumed to be negligible for the purposes of this work. We have not applied any additional correction for the complex scattering that occurs when light from extended sources is incident on the IRAC focal plane444http://ssc.spitzer.caltech.edu/irac/calib/extcal/ and that cause flux measurements to be systematically overestimated. The effect is negligible for the more distant galaxies in the sample, but even for the nearby cases the magnitude of the shift is less than 0.11 dex in Log[F(8.0)/F(4.5)] and less than 0.03 dex in Log[F(24)/F(4.5)]; this offset does not affect our conclusions. The contour encloses 95% of the total sample of regions, and the open and filled circles represent the individual regions and the highly-obscured subset, respectively. We can see that the highly-obscured regions do not stand out from the rest of the region sample in terms of their infrared colors. The positive correlation seen between the F(8.0)/F(4.5) and F(24)/F(4.5) appears to plateau at Log[F(8.0)/F(4.5)]1.25. This behavior is seen in the region sample as a whole as well as in some of the individual galaxies. One plausible explanation is that at low fluxes, both the 8 m PAH emission and the 24 m emission are excited by single optical/UV photons and are therefore proportional to the number of absorbed stellar photons. This would imply that at low values of one would expect a linear correlation of to , as is observed. As the 24 m emission increases, however, larger grains could be sufficiently heated to provide a contribution to 24 m emission from the Wien tail of this steady state warm dust. This then, may provide the plateau (increasing 24 m emission versus constant 8 m emission).
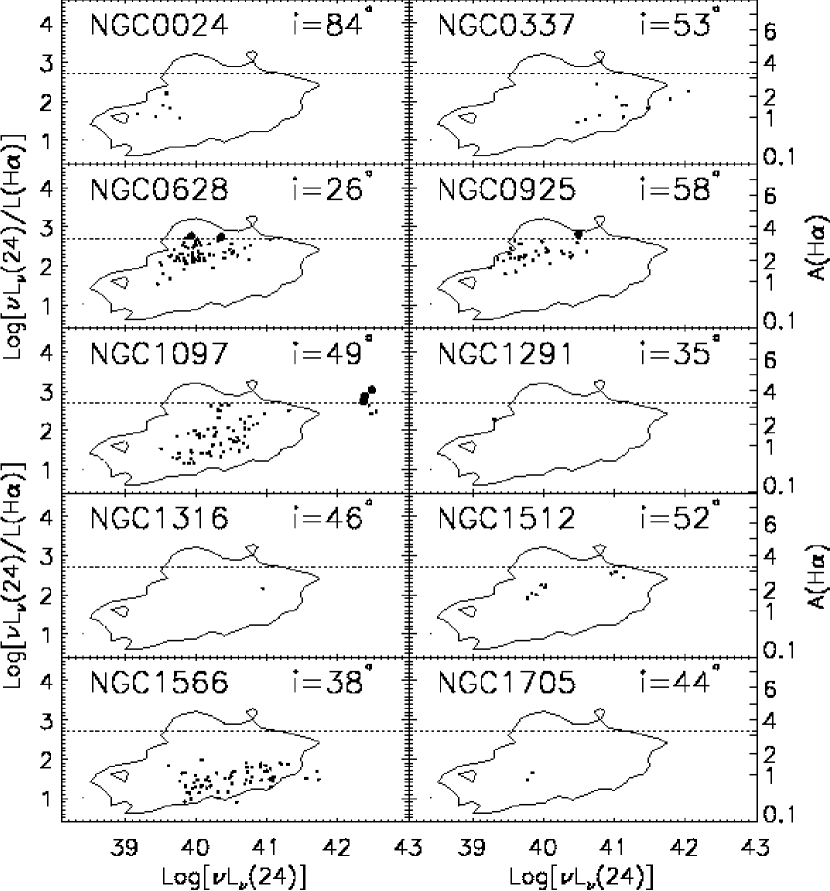
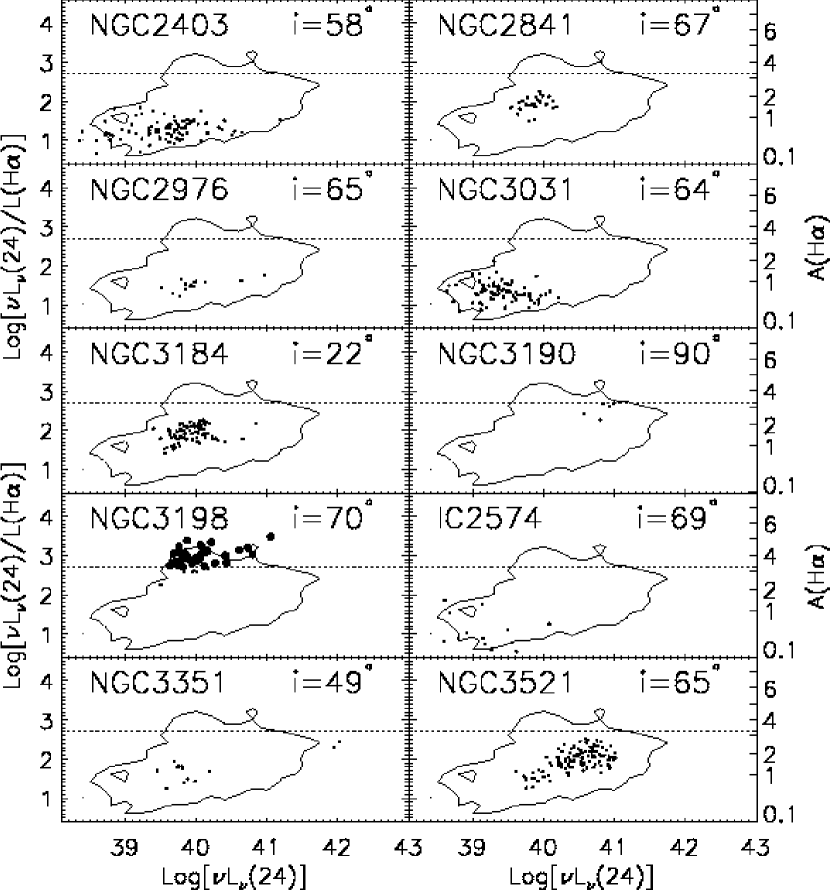
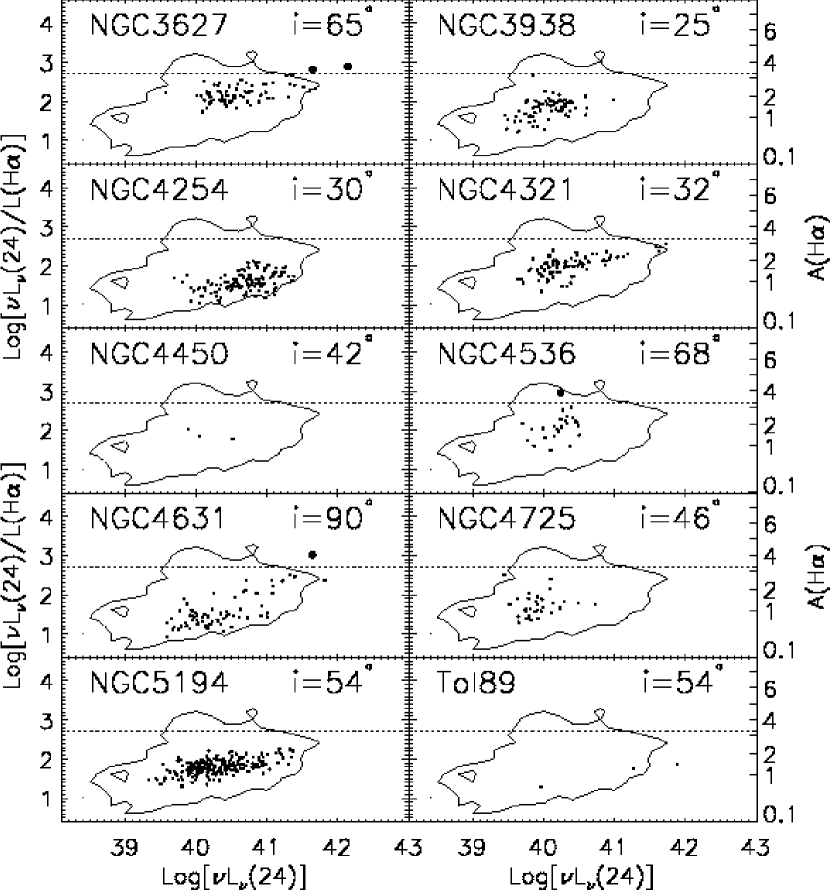
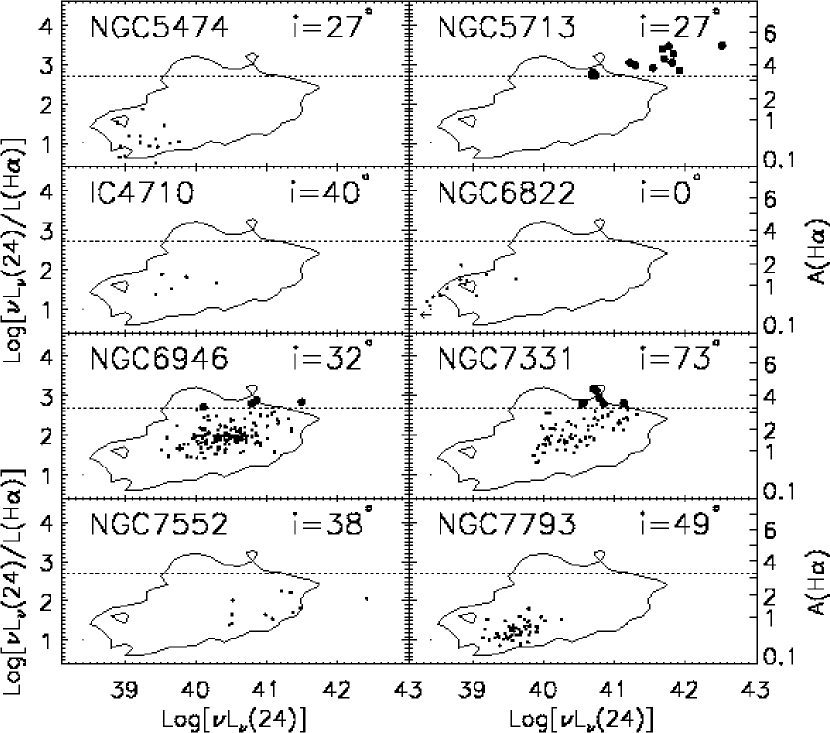
In Figures 7-10, we plot the measured 24m/H attenuation versus the region 24 m luminosity, again using a 95% contour to represent the entire region sample; the dotted line represents the subsample defined by attenuation in the previous section (A). In the entire sample, we see a general trend for more attenuated regions to be more luminous, a trend that is roughly reproduced within individual galaxies, with a few exceptions like NGC 3031.
6.3. Properties of the Most Obscured Regions
In applying the arbitrary cut from Section 6.1 (A), we were aiming to illustrate the relative paucity of uniformly highly obscured regions in the sample (4%), but we did not mean to imply that they are physically distinct from the rest of the population. To demonstrate this fact we have further characterized the regions that make up the tail of the attenuation distribution (see Figure 3). In Table 1, we list for each galaxy the total number of regions selected, the 24 m luminosity of the faintest region measured, and the number of highly-obscured regions using our arbitrary definition. The number of such regions in a galaxy is typically small, and there are many galaxies with none. The exceptions are NGC 5713 and NGC 3198, in which all but a handful of the measured regions qualify as highly obscured by our definition. As discussed in the next section, these two cases show globally high attenuation relative to the rest of the galaxy sample.
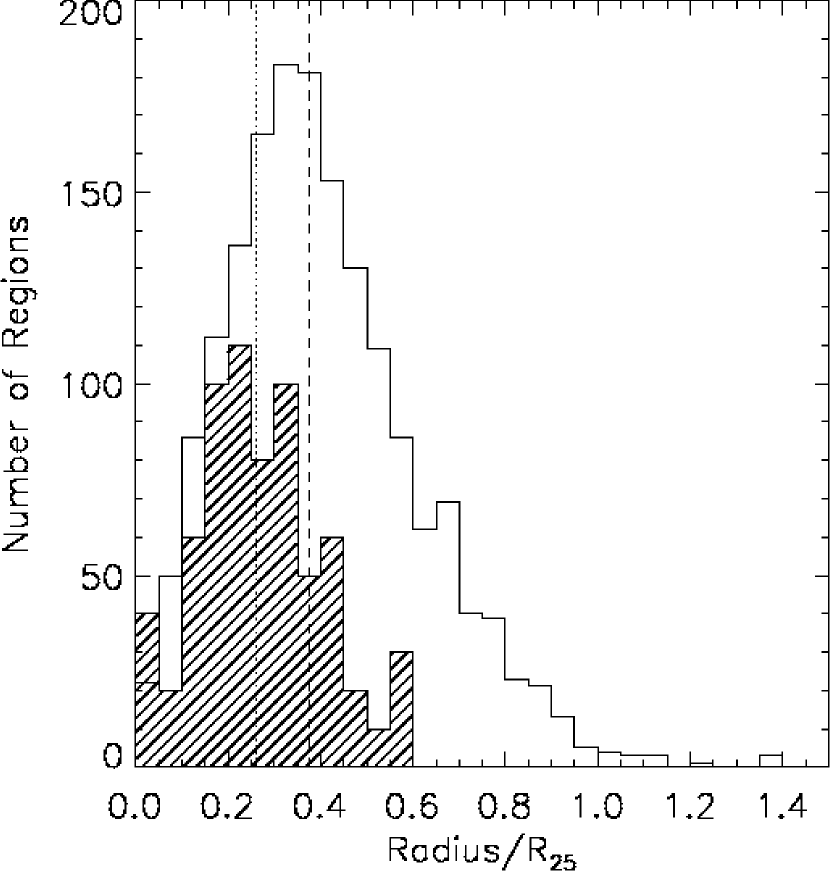
The first question we ask is where the more highly-obscured regions are located within the host galaxy. In Figure 11 we present a histogram of the deprojected radius of the more highly-obscured regions within the host galaxy compared with the entire region sample (excluding the edge-on cases NGC 4631 and NGC 3190). The histogram for the full sample extends out to 1.38 and has a median radius around 0.38 . In contrast, the population in the highly-obscured tail is only found within 0.59 with a median position of 0.26 R25. Thus, the highly-obscured subset is drawn primarily from the inner parts of the host galaxies. To characterize these regions further, we investigate the colors of the highly-obscured tail compared with those of the rest of the regions in the host galaxy and with those of the entire region sample. Returning to Figure 6, we see that for the most part, the highly-obscured cases do not stand out in terms of infrared colors, but instead are scattered throughout the rest of the region color distribution of the host galaxy. In Figures 7-10, we see that the loose trend between region luminosity and attenuation means that the regions which make up the tail of the attenuation distribution tend to also be more luminous. These comparisons all suggest that the more highly obscured regions in our sample are not a distinct sub-population; rather, they are simply the bright, central regions of their host galaxies.
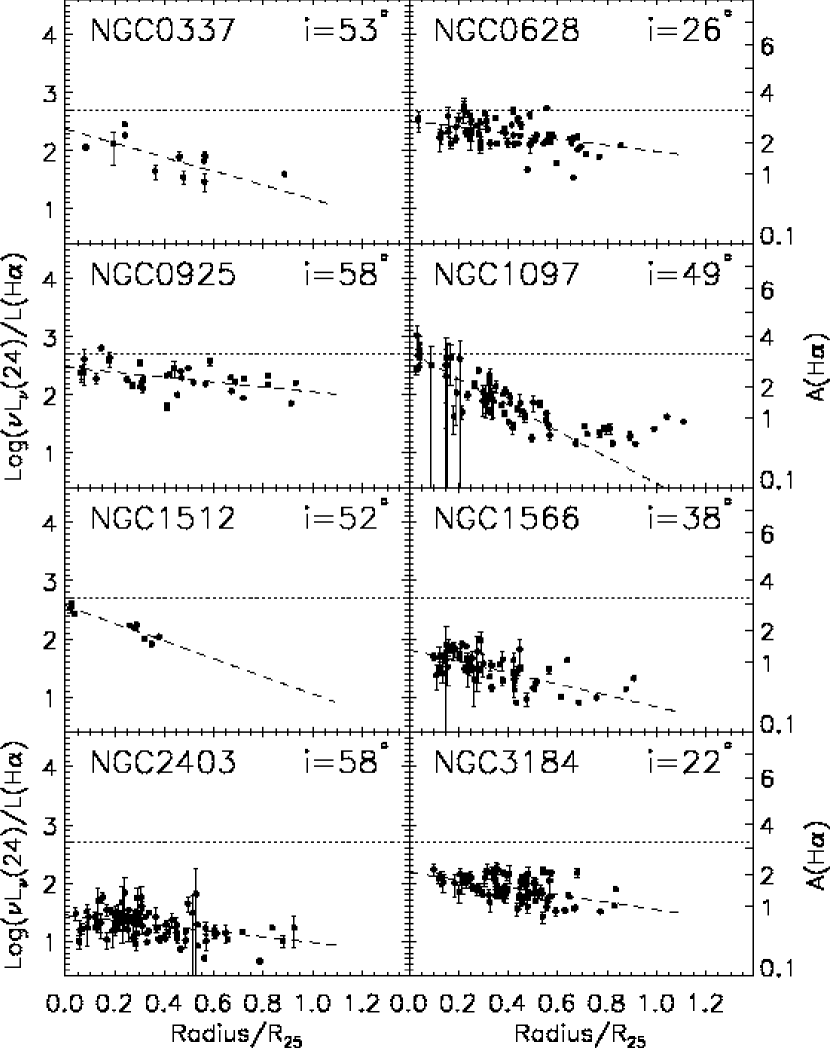
6.4. Radial Attenuation Gradients
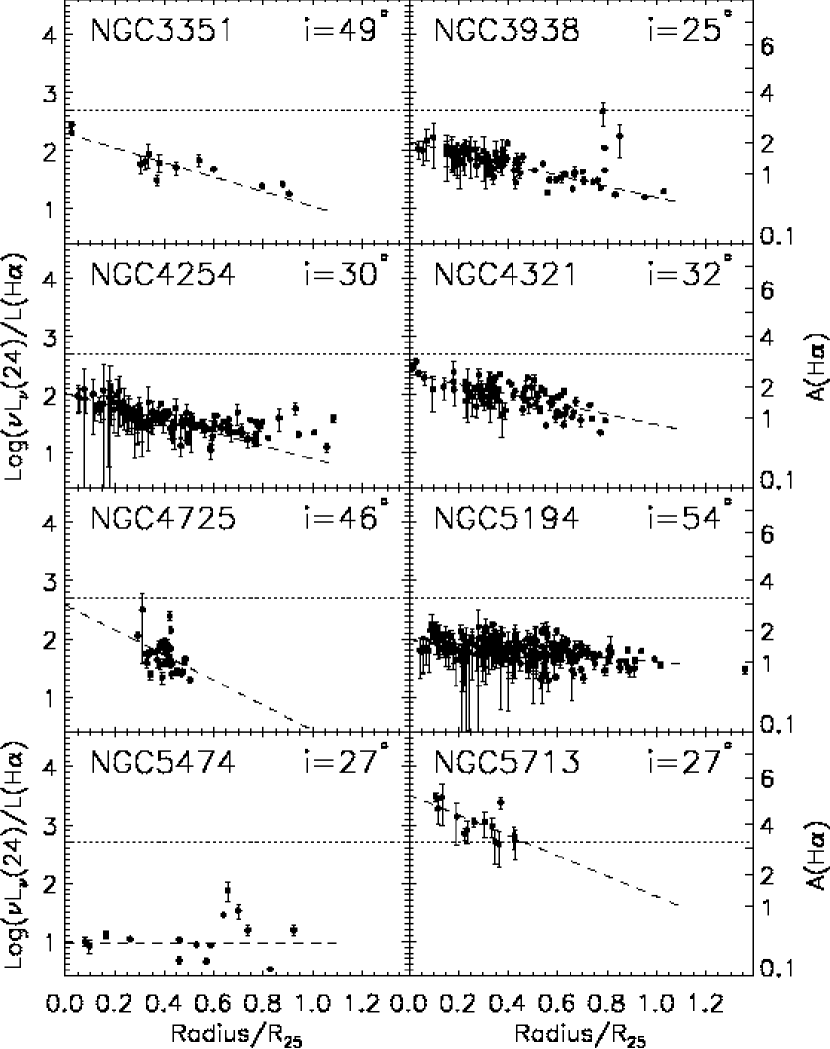
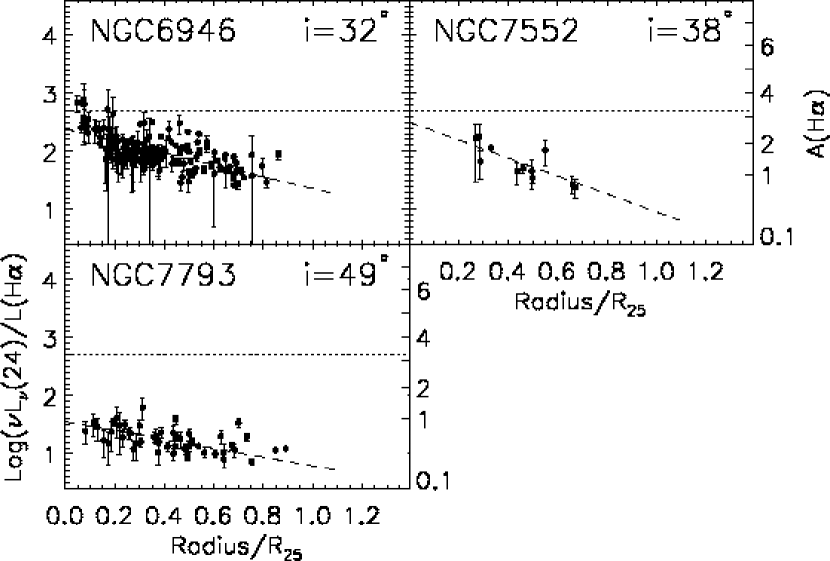
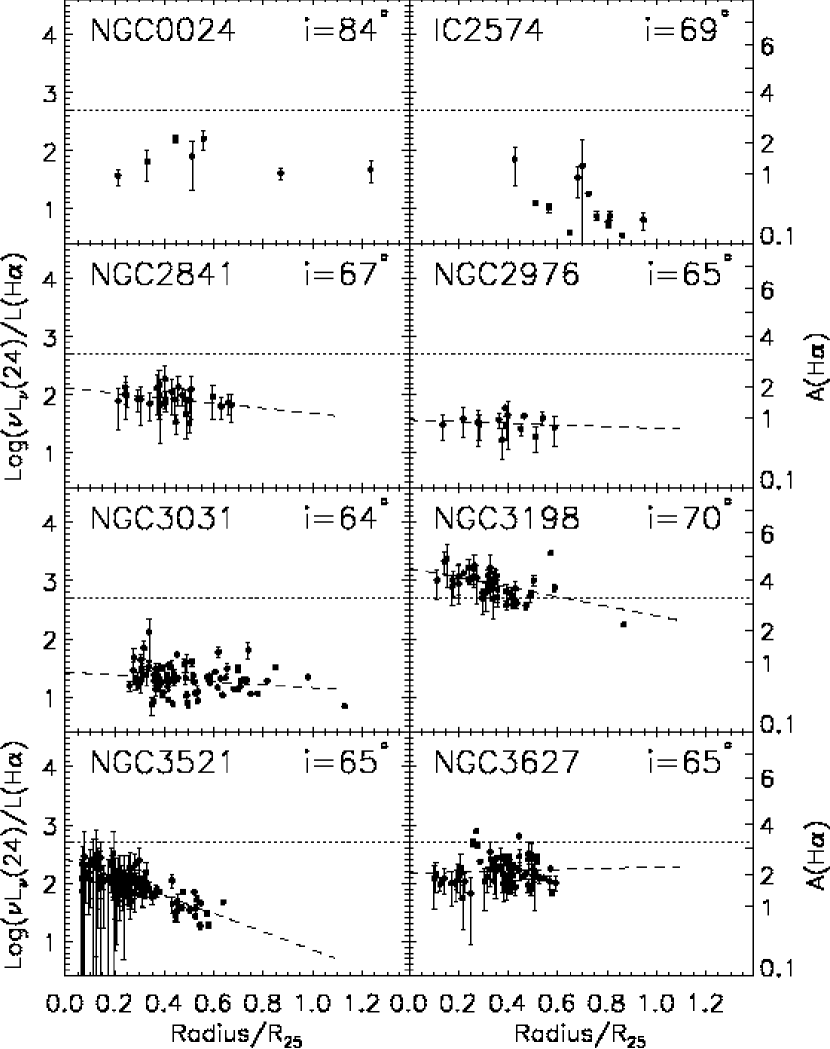
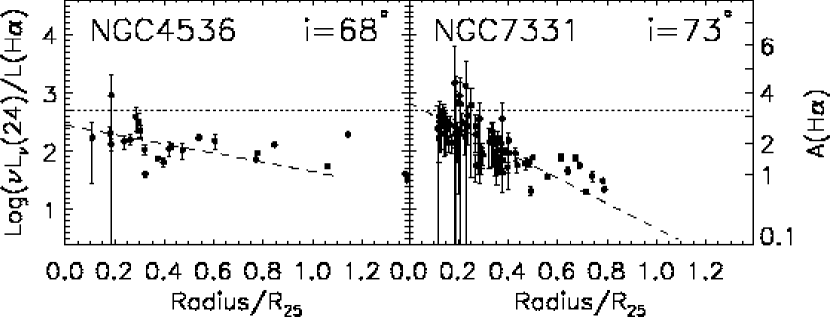
Looking at the global properties of our galaxy sample, we find that a majority of the galaxies show a distinct and nearly linear decreasing radial trend in 24m/H, a finding consistent with other studies (Boissier et al., 2004, 2005; Popescu et al., 2005; Roussel et al., 2005). Figures 12-16 illustrate this result by showing the 24m/H ratio versus deprojected radius for each galaxy, with the galaxy sample split into two groups by inclination. The error bars are the standard errors of the mean derived using the three different background measurements described in Section 4. Galaxies that do not contain enough regions to determine the extent of a radial trend are not shown (NGC 1291, NGC 1316, NGC 1705, NGC 4450, Tololo 89, IC 4710); NGC 6822 is similarly excluded due to complicated morphology. The edge-on nature of NGC 4631 and NGC 3190 preclude an accurate radial deprojection. In cases where the region profile is well-described by linear regression we have shown the best linear fit to the radial range 0.0–0.65 . In a few cases, the region profile is not adequately described by a linear fit due to more complex structure (e.g. bends in the profile); we will discuss this further in Section 7.2.
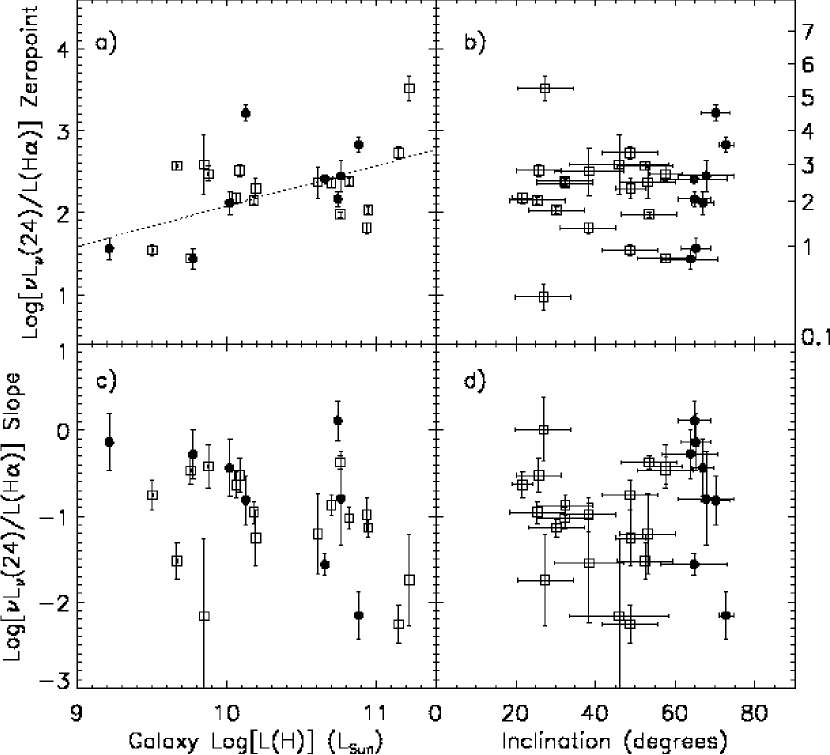
In using the empirical conversion outlined in Section 5, we are making the assumption that attenuation is the only mechanism responsible for varying the 24m/H ratio. We will proceed with this assumption here but will return to the question of what else could be causing the observed radial gradients in Section 7.2. Using an unweighted, linear least-squares fit to the radial profiles we have investigated the relationship between these gradients and global galaxy properties of luminosity and inclination. We use the zeropoint, the linear extrapolation of the attenuation at the galaxy center, as a typical attenuation measure for each galaxy, and in Figure 17 we plot the best fit attenuation slope and zeropoint against galaxy -band luminosity (Jarrett et al., 2003) and inclination. We find no strong trends; a tentative correlation appears to exist between the attenuation zeropoint and the galaxy -band luminosity and is corroborated by a similar trend between MB and zeropoint. Dale et al. (2007) studied the global total infrared-to-ultraviolet (TIR/UV) ratios, often used as a proxy for attenuation, within the entire SINGS sample and found that TIR/UV increases with increasing -band luminosity. Our data are consistent with this result, though the relationship between attenuation zeropoint and galaxy -band luminosity is not as strong. The galaxy inclination does not appear to regulate either the observed slope or zeropoint of the attenuation profile, consistent with findings by Dale et al. (2007) on global TIR/UV ratios. In terms of morphology, we see a weak tendency for early type galaxies with bars to show somewhat steeper slopes that early type galaxies without bars; no such relation is seen for late types. We note that most of the highly-obscured regions in our sample are found in barred galaxies, consistent with other studies that have found an association between bars and circumnuclear star-forming regions (Regan et al., 2006; Kennicutt, 1998).
In the two overlapping cases between this work and Boissier et al. (2004) (NGC 5194 and NGC 3031) we find similar results. Boissier et al. (2004) used FUV/IR ratios to derive UV attenuation estimates and compared these with AHα measured from Balmer decrements of H ii regions. In NGC 5194, they see a radial gradient of roughly 1 magnitude in H attenuation over the optical radius of the galaxy, compared with 0.9 magnitudes in our study. In NGC 3031, they see a much shallower attenuation profile with a radial drop of 0.1 magnitudes, comparable to our result (A0.2 magnitudes).
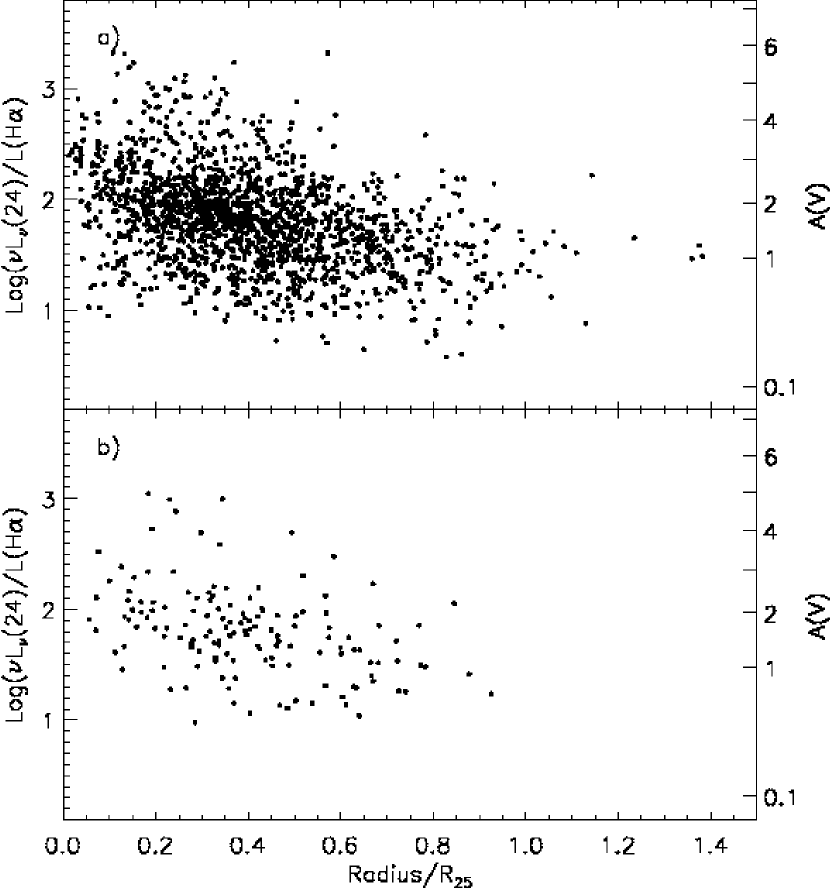
Zaritsky et al. (1994) looked at the subject of attenuation gradients using optical spectra of a sample of 159 H ii regions from 14 galaxies. They found only weak evidence for a radial trend in attenuation (see their Figure 7c). However, we can interpret this result within the context of our study by noting that due to their more limited sample, they plotted the AV of the entire region sample versus fractional isophotal radius. Since we find that the attenuation zeropoint can vary from galaxy to galaxy, viewing the region sample as a whole tends to wash out a radial signature. Figure 18a shows our version of their Figure 7c; a radial gradient is evident, although it is much less clear than what is seen in any individual galaxy. When we randomly select 159 regions from our sample to match the sample size of Zaritsky et al. (1994), we obtain a result that is qualitatively indistinguishable from Zaritsky et al. (1994) Figure 7c (Figure 18b).
In view of the range in attenuation zeropoints found within the sample and the fact that our targets display decreasing radial attenuation gradients, we can return to the question of the nature of the tail of the attenuation distribution. In defining a global attenuation cut, we selected the central regions of galaxies with the highest attenuation zeropoints. To visualize that this is indeed the case, we have included in Figures 12-16 a dotted line corresponding to the attenuation cut applied in Section 6.1. Regions that fall above the dotted line are preferentially the central regions of galaxies with overall high attenuation. This discussion underscores the fact that the highly-obscured fraction we quoted initially is quite arbitrary and dependent on the particular galaxy sample. Nonetheless, while the precise value of the highly-obscured fraction is dependent on the sample, the statement that only 4% of the regions in this particular set of galaxies have 24m/H attenuations higher than 2.7 (A 3.3) is representative of the robust result that these galaxies are not hosting a large number of 500 pc regions in which the vast majority of luminous stars are highly obscured.
In a few galaxies there are a handful of regions that stand out relative to the rest of the regions in the host galaxy. These regions are not necessarily highly-obscured in a global sense – that is, they are not part of the highly-obscured tail of the global attenuation distribution – but they do have higher attenuations than the rest of the region population of the host galaxy near that radius. NGC 3938 and NGC 5474 are examples, with a few of these local outlier regions at 0.6-0.8 R25. Future work will be needed to look into the question of whether these regions are in some way exceptional or whether they simply reflect the stochasticity of the disk at large radii.
7. DISCUSSION
7.1. Obscured Star Forming Regions
The main purpose of this study was to characterize the attenuation distribution of infrared-selected star-forming regions as measured on large scales. In other words, the goal was to determine what fraction of bright infrared sources have H counterparts and what fraction could be defined as highly obscured. The median attenuation we found (A1.4 magnitudes) indicates that roughly 72% of the H emission is typically “missing” from a 500 pc region, but cases where the H is attenuated by more than 3 magnitudes are quite rare (4% of our sample). A complementary picture has been seen in direct measurements of mid-infrared silicate absorption within kiloparsec-sized regions in normal galaxies where most do not show foreground dust screen attenuation greater than (Smith et al., 2006). Similarly, optical nuclear spectra of SINGS galaxies show an average (Dale et al., 2006). However, the fact that we see such a small fraction of uniformly highly-obscured regions could be due to a number of possible scenarios.
7.1.1 Timescales
While dramatic examples of highly-obscured sources do exist in the local Universe on a variety of size scales, the main result of this study is that the fraction of such regions in normal, star-forming disk galaxies is small on 500 pc scales. Equivalently, we can say that the vast majority of current star formation in these galaxies is not hidden from view at optical wavelengths. If we were to make the very simple assumptions that all large star-forming regions go through a highly-embedded phase and that a single star cluster dominates on 500 pc scales, we can estimate the lifetime of such an obscured period. Taking a typical H ii region lifetime to be 5-10 Myr, our observed obscured fraction of 4% implies that a region would spend only years being obscured by more than 3.3 magnitudes in H ( magnitudes). One could also account for these statistics if only a small fraction of the star-forming regions undergo a more lengthy obscured phase. These short time scales are in rough agreement with those inferred for the lifetime and dynamical timescales of Young Stellar Object (YSO) outflows in nearby Galactic molecular clouds, (e.g., Quillen et al., 2005; Zhang et al., 2005; Bontemps et al., 1996). Furthermore, our sample consists of large 500 pc regions perhaps containing hundreds of stars which should shorten the time for sufficient cloud disruption even further.
That said, in the above estimate we have envisioned simplified regions in which all stars are uniformly obscured. In reality, each 500 pc region potentially encompasses many highly-obscured, compact infrared knots as well as emerged clusters which, when blended together in the large beam, would yield a lower average attenuation. We will return to this issue in the following section, but we note here that the observed highly-obscured fraction could also be explained by envisioning a toy model in which each 500 pc region half of the massive stars are embedded while half have broken out of one side of the giant molecular cloud in which they formed. Roughly half of the emerged cases have broken out on the opposite side of the cloud, and thus remain obscured from the point of view of an observer over the short lifetime of massive stars. The net H absorption in this case would be of order 75% (A), similar to the measured median attenuation in our sample. This suggests breakout times of order one half of the massive star lifetime, or roughly 1 Myr. In either scenario, the small fraction of regions with nearly all of their stars highly-obscured indicates that breakout times must be less than the typical lifetime of a star-forming region and also less than or of order of the main sequence lifetime of the dominant sources of luminosity.
Although we have shown that infrared-luminous star-forming regions with relatively faint optical counterparts are very rare in the extended disks of the SINGS spirals, we have also seen that they are considerably more common in the circumnuclear regions of the galaxies. This difference may reflect the higher interstellar pressures in the nuclear regions, which will act to slow the expansion of H ii regions and prolong the lifetime of any dust-embedded phase, as modeled, for example, by Dopita et al. (2005). These regions are also characterized by much larger mean gas column densities, however, so we would expect higher dust opacities even without the dynamical effects of the higher pressure environment. More detailed studies of individual regions will be needed to separate these effects.
The strong association that we find between 24 m sources and optical H ii regions also provides interesting contraints on the maximum lifetimes of the star forming clouds. If the molecular/atomic clouds and their associated dust remained intact for lifetimes much longer than that of the H ii regions, we would expect many of the 24m-bright H ii regions to be associated with the older clusters and OB associations, coincident with ultraviolet-bright regions. Since the dust can be heated by non-ionizing stars such regions would stand out as having anomalously high 24m/H ratios, effectively masquerading as highly obscured regions. While the obscured fraction that we find (4%) is therefore an upper limit, the scarcity of regions with high 24m/H ratios means that 24m-bright clusters older than 5–10 Myr are even more rare. This suggests that the dust and gas clouds surrounding the star clusters/associations must largely dissipate on this time scale. Independent evidence for such time scales comes from observations of expansion lifetimes of HI giant shells in the LMC and SMC, which also show an absence of objects with expansion ages of more than 10 Myr (e.g., Kim et al., 1999; Hatzidimitriou et al., 2005).
7.1.2 Size scales
Our results do not preclude the presence of embedded protostars or ultra-compact H ii regions within the larger complexes that we have studied. In this work we have presented attenuation measurements for large, 500 pc apertures. A common aperture size allowed us to compare the same spatial scale between galaxies at distances ranging from 3 to 25 Mpc; however, a 500 pc aperture corresponds to a larger scale than that of a typical H ii region, let alone a compact H ii region (1 pc). In every aperture applied to the 24 m data, we are potentially summing together a number of smaller infrared star-forming knots with varying attenuations; the net result of this blending is that the attenuation measured is an average for the region. This situation is of course only exacerbated in global star formation studies at high redshift in which measurements are necessarily averaged over an entire galaxy. In Section 6.1, we addressed the question of whether probing to smaller scales would have drastically changed the fraction of highly obscured sources. Based on these tests we do not expect our results on the highly-obscured fraction to change dramatically down to 100 pc scales. When we repeat our analysis on similar datasets for the Antennae galaxies, for example, we are able recover the highly-obscured case despite the blending that occurs due to our large aperture. The region itself is 50 pc with an attenuation of 9-10 magnitudes in V derived from NIR spectra (Gilbert et al., 2000); our empirically-calibrated photometric attenuation measurement is 4.8 in V ( 3.9) using a 500 pc aperture, with the region being a clear (8) outlier from the rest of the regions in the system. Thus, if a large sub-population of similarly luminous and embedded regions existed in our sample of SINGS galaxies, we should have found them in this study.
This is not to suggest the absence of much smaller or less luminous embedded infrared sources. We know from studies of the Milky Way that ultracompact and compact H ii regions exist on scales of 0.1 - 1 pc with TIR luminosities of erg s-1 (Crowther, 2005; Akabane & Kuno, 2005). Star-forming regions in our sample are typically at least 100 times more luminous than a compact H ii region just in the 24m-band ( erg s-1). No doubt a multitude of such regions exist within each galaxy in our sample, but they are not large enough or luminous enough to be studied with the current data.
7.2. Radial Gradients
The fact that we see few highly-obscured cases and such smooth radial gradients suggests that the measured attenuations on these scales are dictated to a greater extent by the global properties of the galaxy such as metallicity, gas surface density, inclination, geometry, or gradual changes in the region SED than by region-to-region fluctuations. Since metallicity is related to dust content and since decreasing gradients in metallicity are observed in many galaxies, it is reasonable to expect it to contribute to the attenuation properties of star-forming regions in a manner that varies with radius (Zaritsky et al., 1994). In contrast to previous work (Boissier et al., 2004, 2005), a preliminary comparison of the metallicity and attenuation gradients for the low inclination galaxies in our sample did not suggest any correlation between the two. However, this is perhaps not surprising as our sample does not cover a wide baseline in metallicity, and gradients in gas column density in galaxies may play a larger role in the global attenuation profiles. Roussel et al. (2005) found a similar radial gradient in FUV/TIR in NGC 300 and noted that while the dispersion in FUV/TIR ratios of individual regions was at least a factor of 2 (0.30 dex), the standard deviation of abundances was only 0.11 dex. From this they suggested that metallicity was likely not the only factor responsible for the gradient. The inclination of the galaxy is a consideration since distributed dust seen along a line-of-sight through the disk may cause additional attenuation of the region’s H flux. In this sample, however, galaxy inclination does not appear to play a dominant role in regulating either the slope or the zeropoint of the global attenuation profile. Instead, the situation appears to be more complicated and may depend strongly on properties of an individual galaxy such as the thickness and morphology of dust lanes and the dust and gas scale heights.
It is interesting to note that while the majority of the sample show linear radial trends in 24m/H, there are two cases (NGC 1097 and NGC 4254) that show a bend in the profile at roughly 0.6 R25. Since metallicity presumably plays a role in the dust-to-gas ratio, it is reasonable to ask whether a bend in the attenuation profile could be related to a bend in the abundance profile of a galaxy. Previous work by numerous authors presented examples of bends in abundance gradients and discussed the question of whether they were real or simply an artifact of the method used to determine (O/H) (Zaritsky et al., 1994, and references therein). Pilyugin (2003) argued strongly that the bends were in fact artificial, that they were due to either an inappropriate application to low metallicity regions of the high-metallicity relationship between oxygen abundace and strong lines or due to a gradient in the excitation parameter within the disk. While beyond the scope of this paper, it is interesting to note that we find examples of bends in attenuation gradients using a completely different technique. This leads to the question of whether these bends could be related to gradients in the [N ii]/H ratio or systematics inherent to the empirical method of estimating attenuation, or whether they represent a real change in the attenuation properties of the disk.
The results summarized above assume that all of the radial trends observed in the 24m/H ratios of the H ii regions arise from changes in dust attenuation. However it is possible that some of the radial trends that we observe are produced by systematic changes in the infrared SED of the emitting regions with galactocentric radius, independent of extinction. For example, if the diameter of H ii regions becomes systematically larger with galactocentric radius, this would lower the characteristic intensity of the heating radiation field at larger radii and tend to lower the mean dust temperatures and the fraction of total dust luminosity emitted in the 24-m band. Spatially-resolved measurements of the infrared spectral energy distributions of SINGS galaxies show little evidence for such radial gradients in infrared SED shape (Bendo et al., 2006; Dale et al., 2005; Pérez-González et al., 2006), but we cannot exclude the possibility that there is at least some small contribution from this effect to the gradients that we observe in Figures 12-16.
8. CONCLUSIONS
In this work, we have studied the incidence of obscured star formation and the distribution of attenuation properties for infrared-selected star-forming regions measured on large scales (500 pc) in a sample of 38 SINGS galaxies. We have made use of an empirical method for deriving H attenuations which combines the 24 m and H datasets (Kennicutt et al., 2007a). Under the assumption that the 24m/H ratio can be used as a proxy for attenuation, our main results are as follows:
-
1.
We do not find a distinct sub-population of uniformly highly-obscured regions on large (500 pc) scales. Instead our data suggest a continuous distribution of attenuations (power law index of 1.4) within the entire sample of 1772 regions.
-
2.
With a few exceptions, those regions that do have higher obscuration (A) are the bright, central regions of luminous galaxies with high global attenuation. The regions in the tail of the attenuation distribution represent a small fraction (4%) of the region population.
-
3.
Most galaxies show a decreasing radial trend in 24m/H; the current sample shows a range of slopes and zeropoints. A weak correlation may exist between the attenuation zeropoint and the galaxy luminosity, consistent with previous studies, but the galaxy inclination does not appear to play a dominant role in either the observed slope or zeropoint of the profile.
-
4.
This study reports on the attenuation (AHα) properties of large (500 pc) star-forming regions, but does not comment on the prevalence of embedded infrared sources that no doubt exist on smaller scales and at lower luminosities similar to compact and ultracompact Hii regions in the Milky Way.
-
5.
A more general conclusion of our work is the high degree of spatial correlation between 24 m and H emission in SINGS galaxies. In agreement with other studies (e.g., Pérez-González et al., 2006), this work suggests that for every bright 24 m source in a normal galaxy there is a visible H counterpart, a fact which opens the door not only to attenuation studies but also to the possibility of using the empirical [24m+H] combination as a new measure of star-formation rates in galaxies.
References
- Akabane & Kuno (2005) Akabane, K., & Kuno, N. 2005, A&A, 431, 183
- Beck et al. (2002) Beck, S. C., Turner, J. L., Langland-Shula, L. E., Meier, D. S., Crosthwaite, L. P., & Gorjian, V. 2002, AJ, 124, 2516
- Bell et al. (2002) Bell, E. F., Gordon, K. D., Kennicutt, R. C., Jr., & Zaritsky, D. 2002, ApJ, 565, 994
- Bendo et al. (2006) Bendo, G. J., et al. 2006, ApJ, 652, 283
- Boissier et al. (2004) Boissier, S., Boselli, A., Buat, V., Donas, J., & Milliard, B. 2004, A&A, 424, 465
- Boissier et al. (2005) Boissier, S., et al. 2005, ApJ, 619, L83
- Bontemps et al. (1996) Bontemps, S., Andre, P., Terebey, S., & Cabrit, S. 1996, A&A, 311, 858
- Buat & Xu (1996) Buat, V., & Xu, C. 1996, A&A, 306, 61
- Buat et al. (2005) Buat, V., et al. 2005, ApJ, 619, L51
- Burstein & Heiles (1982) Burstein, D., & Heiles, C. 1982, AJ, 87, 1165
- Cabanac et al. (2005) Cabanac, R. A., Vanzi, L., & Sauvage, M. 2005, ApJ, 631, 252
- Calzetti et al. (2001) Calzetti, D.. 2001, PASP, 113, 1449
- Calzetti et al. (2005) Calzetti, D., et al. 2005, ApJ, 633, 871
- Calzetti et al. (2007) Calzetti, D., et al. 2007, in preparation
- Caplan & Deharveng (1986) Caplan, J., & Deharveng, L. 1986, A&A, 155, 297
- Crowther (2005) Crowther, P. A. 2005, IAU Symposium, 227, 389
- Dale et al. (2001) Dale, D. A., Helou, G., Neugebauer, G., Soifer, B. T., Frayer, D. T., & Condon, J. J. 2001, AJ, 122, 1736
- Dale et al. (2005) Dale, D. A., et al. 2005, ApJ, 633, 857
- Dale et al. (2006) Dale, D. A., et al. 2006, ApJ, 646, 161
- Dale et al. (2007) Dale, D. A., et al. 2007, ApJ, 655, 863
- de Vaucouleurs et al. (1991) de Vaucouleurs, G., de Vaucouleurs, A., Corwin, H. G., Buta, R. J. Paturel, G., & Fouque, P. 1991, Third Reference Catalogue of Bright Galaxies (Volume 1-3, XII, 2069 pp. 7 figs. Springer-Verlag Berlin Heidelberg New York)
- Dopita et al. (2005) Dopita, M. A., et al. 2005, ApJ, 619, 755
- Drozdovsky & Karachentsev (2000) Drozdovsky, I. O., & Karachentsev, I. D. 2000, A&AS, 142, 425
- Fazio et al. (2004) Fazio, G. G., et al. 2004, ApJS, 154, 10
- Freedman et al. (2001) Freedman, W. L., et al. 2001, ApJ, 553, 47
- Genzel et al. (1998) Genzel, R., et al. 1998, ApJ, 498, 579
- Giovanelli et al. (1995) Giovanelli, R., Haynes, M. P., Salzer, J. J., Wegner, G., da Costa, L. N., & Freudling, W. 1995, AJ, 110, 1059
- Gilbert et al. (2000) Gilbert, A. M., et al. 2000, ApJ, 533, L57
- Goetz et al. (2003) Goetz, J. A., Gutermuth, R., Pipher, J. L., Forrest, W. J., & Howard, E. M. 2003, ApJ, 599, 1173
- Gordon et al. (2005) Gordon, K. D., et al. 2005, PASP, 117, 503
- Gorjian et al. (2001) Gorjian, V., Turner, J. L., & Beck, S. C. 2001, ApJ, 554, L29
- Hatzidimitriou et al. (2005) Hatzidimitriou, D., Stanimirovic, S., Maragoudaki, F., Staveley-Smith, L., Dapergolas, A., & Bratsolis, E. 2005, MNRAS, 360, 1171
- Helou et al. (2004) Helou, G., et al. 2004, ApJS, 154, 253
- Hill et al. (1997) Hill, J. K., et al. 1997, ApJ, 477, 673
- Holmberg (1958) Holmberg, E. 1958, Meddelanden fran Lunds Astronomiska Observatorium Serie II, 136, 1
- Houck et al. (2004) Houck, J. R., et al. 2004, ApJS, 154, 211
- Israel & Kennicutt (1980) Israel, F. P., & Kennicutt, R. C. 1980, Astrophys. Lett., 21, 1
- Jansen et al. (1994) Jansen, R. A., Knapen, J. H., Beckman, J. E., Peletier, R. F., & Hes, R. 1994, MNRAS, 270, 373
- Jansen et al. (2000) Jansen, R. A., Fabricant, D., Franx, M., & Caldwell, N. 2000, ApJS, 126, 331
- Karachentsev et al. (2000) Karachentsev, I. D., Sharina, M. E., & Huchtmeier, W. K. 2000, A&A, 362, 544
- Karachentsev et al. (2002) Karachentsev, I. D., et al. 2002, A&A, 383, 125
- Karachentsev et al. (2003a) Karachentsev, I. D., et al. 2003a, A&A, 398, 479
- Karachentsev et al. (2003b) Karachentsev, I. D., et al. 2003b, A&A, 404, 93
- Kaufman et al. (1987) Kaufman, M., Bash, F. N., Kennicutt, R. C., Jr., & Hodge, P. W. 1987, ApJ, 319, 61
- Kennicutt (1998) Kennicutt, R. C., Jr. 1998, ARA&A, 36, 189
- Kennicutt et al. (2003) Kennicutt, R. C., et al. 2003, PASP, 115, 928
- Kennicutt et al. (2007a) Kennicutt, R. C., et al. 2007, (The Global Schmidt Law), in preparation
- Kennicutt et al. (2007b) Kennicutt, R. C., et al. 2007, (The 11 Mpc H and Ultraviolet Galaxy Survey), in preparation
- Kim et al. (1999) Kim, S., Dopita, M. A., Staveley-Smith, L., & Bessell, M. S. 1999, AJ, 118, 2797
- Kobulnicky & Johnson (1999) Kobulnicky, H. A., & Johnson, K. E. 1999, ApJ, 527, 154
- Kurtz (2000) Kurtz, S. E. 2000, Revista Mexicana de Astronomia y Astrofisica Conference Series, 9, 169
- Jarrett et al. (2003) Jarrett, T. H., Chester, T., Cutri, R., Schneider, S. E., & Huchra, J. P. 2003, AJ, 125, 525
- Leonard et al. (2002) Leonard, D. C., et al. 2002, AJ, 124, 2490
- Macri et al. (2001) Macri, L. M., Stetson, P. B., Bothun, G. D., Freedman, W. L., Garnavich, P. M., Jha, S., Madore, B. F., & Richmond, M. W. 2001, ApJ, 559, 243
- Masters et al. (2007) Masters, K. L. et al. 2007, in preparation
- Mattila & Meikle (2001) Mattila, S., & Meikle, W. P. S. 2001, MNRAS, 324, 325
- McCall et al. (1985) McCall, M. L., Rybski, P. M., & Shields, G. A. 1985, ApJS, 57, 1
- Miller & Mathews (1972) Miller, J. S., & Mathews, W. G. 1972, ApJ, 172, 593
- Mirabel et al. (1998) Mirabel, I. F., et al. 1998, A&A, 333, L1
- Monet et al. (1998) Monet, D., Bird A., Canzian, B., Dahn, C., Guetter, H., Harris, H., Henden, A., Levine, S., Luginbuhl, C., Monet, A. K. B., Rhodes, A., Riepe, B., Sell, S., Stone, R., Vrba, F., Walker, R. 1998, The USNO-A2.0 Catalogue, (U.S. Naval Observatory, Washington DC)
- Moustakas & Kennicutt (2006) Moustakas, J., & Kennicutt, R. C., Jr. 2006, ApJS, 164, 81
- Moustakas et al. (2006) Moustakas, J., Kennicutt, R. C., Jr., & Tremonti, C. A. 2006, ApJ, 642, 775
- Moustakas et al. (2007) Moustakas, J. et al., 2007, in preparation
- Pérez-González et al. (2006) Pérez-González, P. G., et al. 2006, ApJ, 648, 987
- Pietrzyński et al. (2004) Pietrzyński, G., Gieren, W., Udalski, A., Bresolin, F., Kudritzki, R.-P., Soszyński, I., Szymański, M., & Kubiak, M. 2004, AJ, 128, 2815
- Pilyugin (2003) Pilyugin, L. S. 2003, A&A, 397, 109
- Plante & Sauvage (2002) Plante, S., & Sauvage, M. 2002, AJ, 124, 1995
- Popescu et al. (2005) Popescu, C. C., et al. 2005, ApJ, 619, L75
- Puxley (1991) Puxley, P. J. 1991, MNRAS, 249, 11P
- Quillen & Yukita (2001) Quillen, A. C., & Yukita, M. 2001, AJ, 121, 2095
- Quillen et al. (2005) Quillen, A. C., Thorndike, S. L., Cunningham, A., Frank, A., Gutermuth, R. A., Blackman, E. G., Pipher, J. L., & Ridge, N. 2005, ApJ, 632, 941
- Regan et al. (2004) Regan, M. W., et al. 2004, ApJS, 154, 204
- Regan et al. (2006) Regan, M. W., et al. 2006, ApJ, 652, 1112
- Rieke et al. (1980) Rieke, G. H., Lebofsky, M. J., Thompson, R. I., Low, F. J., & Tokunaga, A. T. 1980, ApJ, 238, 24
- Rieke et al. (2004) Rieke, G. H., et al. 2004, ApJS, 154, 25
- Roshi et al. (2005a) Roshi, D. A., Balser, D. S., Bania, T. M., Goss, W. M., & De Pree, C. G. 2005a, ApJ, 625, 181
- Roshi et al. (2005b) Roshi, D. A., Goss, W. M., Anantharamaiah, K. R., & Jeyakumar, S. 2005b, ApJ, 626, 253
- Roussel et al. (2005) Roussel, H., Gil de Paz, A., Seibert, M., Helou, G., Madore, B. F., & Martin, C. 2005, ApJ, 632, 227
- Schlegel et al. (1998) Schlegel, D. J., Finkbeiner, D. P., & Davis, M. 1998, ApJ, 500, 525
- Scoville et al. (2001) Scoville, N. Z., Polletta, M., Ewald, S., Stolovy, S. R., Thompson, R., & Rieke, M. 2001, AJ, 122, 3017
- Shapley et al. (2001) Shapley, A., Fabbiano, G., & Eskridge, P. B. 2001, ApJS, 137, 139
- Skrutskie et al. (2006) Skrutskie, M. F., et al. 2006, AJ, 131, 1163
- Smith et al. (2006) Smith, J. D. T., et al. 2006, in press (astro-ph/0610913)
- Soifer et al. (2001) Soifer, B. T., et al. 2001, AJ, 122, 1213
- Stetson (1987) Stetson, P. B. 1987, PASP, 99, 191
- Tonry et al. (2001) Tonry, J. L., Dressler, A., Blakeslee, J. P., Ajhar, E. A., Fletcher, A. B., Luppino, G. A., Metzger, M. R., & Moore, C. B. 2001, ApJ, 546, 681
- Tosi et al. (2001) Tosi, M., Sabbi, E., Bellazzini, M., Aloisi, A., Greggio, L., Leitherer, C., & Montegriffo, P. 2001, AJ, 122, 1271
- Tully & Fisher (1977) Tully, R. B., & Fisher, J. R. 1977, A&A, 54, 661
- Vacca et al. (2002) Vacca, W. D., Johnson, K. E., & Conti, P. S. 2002, AJ, 123, 772
- Valentijn (1994) Valentijn, E. A. 1994, MNRAS, 266, 614
- van der Hulst et al. (1988) van der Hulst, J. M., Kennicutt, R. C., Crane, P. C., & Rots, A. H. 1988, A&A, 195, 38
- Walter et al. (2005) Walter, F., Brinks, E., de Blok, W. J. G., Thornley, M. D., & Kennicutt, R. C. 2005, Extra-Planar Gas, 331, 269
- Wang & Heckman (1996) Wang, B., & Heckman, T. M. 1996, ApJ, 457, 645
- Werner et al. (2004) Werner, M. W., et al. 2004, ApJS, 154, 1
- Zaritsky et al. (1994) Zaritsky, D., Kennicutt, R. C., & Huchra, J. P. 1994, ApJ, 420, 87
- Zhang et al. (2005) Zhang, Q., Hunter, T. R., Brand, J., Sridharan, T. K., Cesaroni, R., Molinari, S., Wang, J., & Kramer, M. 2005, ApJ, 625, 864
| Galaxy | Distance | MB | D25 | Type | i | NReg | Log[(24)] | NHO | Slope | Zeropoint |
|---|---|---|---|---|---|---|---|---|---|---|
| Limit | ||||||||||
| (1) | (2) | (3) | (4) | (5) | (6) | (7) | (8) | (9) | (10) | (11) |
| NGC 0024 | 7.32.3 (i) | -17.140.13 | 5.8 1.3 | SA(s)c | 84 7 | 7 | 39.1738.52 | 0 | - | - |
| NGC 0337 | 22.42.3 (i) | -19.690.13 | 2.9 1.8 | SB(s)d | 53 7 | 11 | 40.4839.94 | 0 | -1.210.47 | 2.370.19 |
| NGC 0628 | 7.31.5 (k) | -19.370.10 | 10.5 9.5 | SA(s)c | 26 6 | 70 | 39.4638.40 | 2 | -0.530.20 | 2.510.07 |
| NGC 0925 | 9.10.2 (b) | -19.110.11 | 10.5 5.9 | SAB(s)d | 58 4 | 35 | 39.2437.95 | 1 | -0.420.25 | 2.470.09 |
| NGC 1097 | 17.12.3 (i) | -20.930.07 | 9.3 6.3 | (R)SB(r)b | 49 7 | 66 | 39.5038.29 | 3 | -2.250.22 | 2.730.08 |
| NGC 1291 | 10.82.3 (i) | -20.780.04 | 9.8 8.1 | (R)SB(l)0/a | 35 7 | 1 | 39.3037.52 | 0 | - | - |
| NGC 1316 | 24.32.3 (i) | -22.510.08 | 12.0 8.5 | (R)SAB(s)0 | 46 7 | 1 | 40.9440.10 | 0 | - | - |
| NGC 1512 | 11.82.3 (i) | -19.230.10 | 8.9 5.6 | SB(r)ab | 52 7 | 9 | 39.7738.87 | 0 | -1.520.21 | 2.570.05 |
| NGC 1566 | 20.32.3 (i) | -21.210.03 | 8.3 6.6 | (R)SAB(rs)bc | 38 7 | 62 | 39.6139.17 | 0 | -0.980.20 | 1.810.07 |
| NGC 1705 | 5.10.6 (m) | -15.770.13 | 1.9 1.4 | SA0 pec | 44 7 | 2 | 39.7738.91 | 0 | - | - |
| NGC 2403 | 3.20.2 (b) | -18.610.07 | 21.912.3 | SAB(s)cd | 58 7 | 88 | 38.3637.18 | 0 | -0.470.16 | 1.450.05 |
| NGC 2841 | 14.11.5 (h) | -20.660.10 | 8.1 3.5 | SA(r)b | 67 1 | 28 | 39.5338.87 | 0 | -0.440.33 | 2.120.14 |
| NGC 2976 | 3.60.4 (d) | -16.940.13 | 5.9 2.7 | SAc pec | 65 3 | 14 | 39.5139.18 | 0 | -0.140.33 | 1.560.13 |
| NGC 3031 | 3.60.1 (b) | -19.910.03 | 29.614.1 | SA(s)ab | 64 4 | 81 | 38.6437.32 | 0 | -0.280.29 | 1.430.13 |
| NGC 3184 | 11.12.0 (g) | -19.870.10 | 7.4 6.9 | SAB(rs)cd | 22 3 | 80 | 39.4038.77 | 0 | -0.630.15 | 2.180.06 |
| NGC 3190 | 20.92.3 (i) | -19.480.10 | 4.4 1.5 | SA(s)a pec | 90 7 | 5 | 40.5739.71 | 0 | - | - |
| NGC 3198 | 13.70.5 (b) | -19.810.10 | 8.5 3.3 | SB(rs)c | 70 3 | 43 | 39.5038.28 | 35 | -0.820.28 | 3.220.10 |
| IC 2574 | 4.00.4 (e) | -17.220.19 | 13.2 5.4 | SAB(s)m | 69 3 | 13 | 38.5937.43 | 0 | - | - |
| NGC 3351 | 9.30.4 (b) | -19.320.10 | 7.4 5.0 | SB(r)b | 49 4 | 13 | 39.4638.79 | 0 | -1.250.32 | 2.300.12 |
| NGC 3521 | 10.12.3 (i) | -20.180.10 | 11.0 5.1 | SAB(rs)bc | 65 8 | 100 | 39.6139.08 | 0 | -1.560.13 | 2.410.04 |
| NGC 3627 | 9.40.1 (b) | -20.210.13 | 9.1 4.2 | SAB(s)b | 65 4 | 71 | 39.5739.26 | 2 | 0.110.23 | 2.170.09 |
| NGC 3938 | 13.32.3 (i) | -19.730.10 | 5.4 4.9 | SA(s)c | 25 7 | 77 | 39.4638.66 | 0 | -0.960.12 | 2.150.04 |
| NGC 4254 | 16.62.0 (i*) | -20.660.08 | 5.4 4.7 | SA(s)c | 30 7 | 119 | 39.6939.19 | 0 | -1.130.10 | 2.030.04 |
| NGC 4321 | 14.30.5 (l) | -20.730.08 | 7.4 6.3 | SAB(s)bc | 32 7 | 87 | 39.6439.40 | 0 | -0.870.13 | 2.360.05 |
| NGC 4450 | 16.62.0 (i*) | -20.200.08 | 5.2 3.9 | SA(s)ab | 42 7 | 3 | 39.8939.03 | 0 | - | - |
| NGC 4536 | 14.40.3 (b) | -19.640.08 | 7.6 3.2 | SAB(rs)bc | 68 7 | 25 | 39.7038.84 | 1 | -0.800.54 | 2.450.19 |
| NGC 4631 | 8.12.3 (i) | -19.780.16 | 15.5 2.7 | SB(s)d | 90 7 | 68 | 39.5939.00 | 1 | - | - |
| NGC 4725 | 11.90.3 (b) | -20.270.13 | 10.7 7.6 | SAB(r)ab pec | 46 7 | 32 | 39.4438.96 | 0 | -2.160.89 | 2.580.36 |
| NGC 5194 | 7.82.3 (i) | -20.490.06 | 11.2 6.9 | SA(s)bc pec | 5412 | 217 | 39.3339.08 | 0 | -0.380.08 | 1.980.03 |
| Tololo 89 | 16.72.3 (i) | -18.330.17 | 2.8 1.7 | SB(rs)dm | 54 7 | 3 | 39.9638.83 | 0 | - | - |
| NGC 5474 | 6.81.4 (a) | -17.880.15 | 4.8 4.3 | SA(s)cd pec | 27 7 | 15 | 38.9037.78 | 0 | 0.010.37 | 0.970.16 |
| NGC 5713 | 29.42.3 (i) | -20.500.15 | 2.8 2.5 | SAB(rs)bc pec | 27 7 | 14 | 40.6840.41 | 13 | -1.740.53 | 3.520.16 |
| IC 4710 | 9.02.3 (i) | -17.260.20 | 3.6 2.8 | SB(s)m | 40 7 | 5 | 39.4438.37 | 0 | - | - |
| NGC 6822 | 0.50.0 (j) | -14.030.06 | 15.513.5 | IB(s)m | 0 7 | 13 | 37.7037.45 | 0 | - | - |
| NGC 6946 | 6.81.4 (c) | -19.550.10 | 11.5 9.8 | SAB(rs)cd | 32 9 | 158 | 39.5138.94 | 4 | -1.020.13 | 2.380.05 |
| NGC 7331 | 14.50.6 (b) | -20.460.10 | 10.5 3.7 | SA(s)b | 73 2 | 77 | 39.8638.78 | 7 | -2.150.27 | 2.830.09 |
| NGC 7552 | 21.02.3 (i) | -20.360.13 | 3.4 2.7 | (R)SB(s)ab | 38 7 | 11 | 40.4740.05 | 0 | -1.550.70 | 2.500.29 |
| NGC 7793 | 3.80.4 (f) | -18.280.05 | 9.3 6.3 | SA(s)d | 49 3 | 48 | 39.1437.80 | 0 | -0.760.17 | 1.550.07 |
Note. — Col. (1) Galaxy name; Col. (2) Distance (Mpc) with associated reference; Col. (3) Absolute B magnitude from de Vaucouleurs et al. (1991) (RC3); Col. (4) Major and minor axis diameters at the 25 magnitude isophote from RC3 (arcmin); Col. (5) Morphological type from RC3; Col. (6) Inclination derived using eq. 1 (degrees); Col. (7) Number of infrared-selected regions included in this study; Col. (8) Log of the 24m luminosity of the faintest region (erg s-1); Col. (9) Number of highly obscured regions, as defined in Section 6.1; Col (10) Slope of radial attenuation gradient as defined in Section 6.4 (dex/kpc); Col (11) Zeropoint of radial attenuation gradient as defined in Section 6.4 (dex).
References. — (a) Drozdovsky & Karachentsev (2000); (b) Freedman et al. (2001); (c) Karachentsev et al. (2000); (d) Karachentsev et al. (2002); (e) Karachentsev et al. (2003a); (f) Karachentsev et al. (2003b); (g) Leonard et al. (2002); (h) Macri et al. (2001); (i) Masters et al. (2007); (j) Pietrzyński et al. (2004); (k) Shapley et al. (2001); (l) Tonry et al. (2001); (m) Tosi et al. (2001)
| [N ii] 6584/H | Final Correction | |
|---|---|---|
| Galaxy | Ratioaa[N ii] (6584,6548)/H ratios were derived as discussed in Section 3. The assumed [N ii] 6548/[N ii] 6584 ratio is 0.335, consistent with other studies (Calzetti et al., 2005). | Factor |
| NGC 0024 | 0.2680.008 | 0.89470.0028 |
| NGC 0337 | 0.1970.002 | 0.98190.0002 |
| NGC 0628 | 0.4970.014 | 0.96450.0009 |
| NGC 0925 | 0.2330.006 | 0.78140.0035 |
| NGC 1097 | 0.4850.004 | 0.73230.0017 |
| NGC 1291 | 1.0600.157 | 0.94870.0051 |
| NGC 1316 | 2.4890.126 | 0.66460.0103 |
| NGC 1512 | 0.4810.012 | 0.97130.0005 |
| NGC 1566 | 0.5070.004 | 0.97370.0002 |
| NGC 1705 | 0.0650.002 | 0.95600.0012 |
| NGC 2403 | 0.2310.002 | 0.76790.0012 |
| NGC 2841 | 0.8660.027 | 0.49720.0059 |
| NGC 2976 | 0.2690.004 | 0.74240.0020 |
| NGC 3031 | 0.360.30bbRatio derived using eq. 2. The standard deviation of this relation is estimated to be 0.30. | 0.670.12 |
| NGC 3184 | 0.4390.009 | 0.65710.0036 |
| NGC 3190 | 0.9580.091 | 0.45940.0206 |
| NGC 3198 | 0.3480.008 | 0.71250.0036 |
| IC 2574 | 0.110.30bbRatio derived using eq. 2. The standard deviation of this relation is estimated to be 0.30. | 0.870.18 |
| NGC 3351 | 0.4580.004 | 0.62920.0017 |
| NGC 3521 | 0.4260.004 | 0.68020.0016 |
| NGC 3627 | 0.4950.005 | 0.63810.0018 |
| NGC 3938 | 0.3100.009 | 0.74600.0040 |
| NGC 4254 | 0.3070.002 | 0.70960.0012 |
| NGC 4321 | 0.3960.005 | 0.82850.0014 |
| NGC 4450 | 0.8730.043 | 0.47770.0095 |
| NGC 4536 | 0.4320.005 | 0.80600.0015 |
| NGC 4631 | 0.340.30bbRatio derived using eq. 2. The standard deviation of this relation is estimated to be 0.30. | 0.710.12 |
| NGC 4725 | 1.2610.077 | 0.56270.0105 |
| NGC 5194 | 0.5240.004 | 0.60230.0013 |
| Tololo 89 | 0.180.30bbRatio derived using eq. 2. The standard deviation of this relation is estimated to be 0.30. | 0.900.09 |
| NGC 5474 | 0.150.30bbRatio derived using eq. 2. The standard deviation of this relation is estimated to be 0.30. | 0.830.17 |
| NGC 5713 | 0.4180.003 | 0.65650.0011 |
| IC 4710 | 0.120.30bbRatio derived using eq. 2. The standard deviation of this relation is estimated to be 0.30. | 0.990.01 |
| NGC 6822 | 0.030.30bbRatio derived using eq. 2. The standard deviation of this relation is estimated to be 0.30. | 1.000.03 |
| NGC 6946 | 0.310.30bbRatio derived using eq. 2. The standard deviation of this relation is estimated to be 0.30. | 0.710.13 |
| NGC 7331 | 0.5070.007 | 0.64330.0025 |
| NGC 7552 | 0.440.30bbRatio derived using eq. 2. The standard deviation of this relation is estimated to be 0.30. | 0.970.01 |
| NGC 7793 | 0.2870.005 | 0.98220.0002 |
Note. — The final correction factor multiplies the raw flux measurement and corrects for the [N ii] (6584,6548)/H ratios as well as the H filter transmission. Quoted errors are formal measurement errors only and do not include physical uncertainties, e.g., due to variations in the [N ii] (6584,6548)/H ratio within the galaxy.
| Galaxy | H | 3.6m | 4.5m | 5.8m | 8.0m | 24m |
|---|---|---|---|---|---|---|
| NGC 0024 | 1.03 | 1.02 | 1.02 | 1.02 | 1.03 | 1.64 |
| NGC 0337 | 4.46 | 4.94 | 4.94 | 5.18 | 5.69 | 5.85 |
| NGC 0628 | 1.02 | 1.04 | 1.04 | 1.05 | 1.07 | 1.64 |
| NGC 0925 | 1.09 | 1.07 | 1.07 | 1.07 | 1.08 | 1.72 |
| NGC 1097 | 2.56 | 2.95 | 2.95 | 3.08 | 3.37 | 3.21 |
| NGC 1291 | 1.16 | 1.23 | 1.23 | 1.25 | 1.31 | 1.88 |
| NGC 1316 | 4.21 | 4.94 | 4.94 | 5.18 | 5.69 | 5.85 |
| NGC 1512 | 1.47 | 1.61 | 1.61 | 1.67 | 1.78 | 2.21 |
| NGC 1566 | 2.61 | 2.95 | 2.95 | 3.08 | 3.37 | 3.21 |
| NGC 1705 | 1.00 | 1.00 | 1.00 | 1.00 | 1.00 | 1.34 |
| NGC 2403 | 1.00 | 1.00 | 1.00 | 1.00 | 1.00 | 1.34 |
| NGC 2841 | 1.55 | 1.61 | 1.61 | 1.67 | 1.78 | 2.21 |
| NGC 2976 | 1.00 | 1.00 | 1.00 | 1.00 | 1.00 | 1.34 |
| NGC 3031 | 1.00 | 1.00 | 1.00 | 1.00 | 1.00 | 1.34 |
| NGC 3184 | 1.16 | 1.23 | 1.23 | 1.25 | 1.31 | 1.88 |
| NGC 3190 | 4.41 | 4.94 | 4.94 | 5.18 | 5.69 | 5.85 |
| NGC 3198 | 1.47 | 1.61 | 1.61 | 1.67 | 1.78 | 2.21 |
| IC 2574 | 1.00 | 1.00 | 1.00 | 1.00 | 1.00 | 1.34 |
| NGC 3351 | 1.10 | 1.15 | 1.15 | 1.17 | 1.21 | 1.72 |
| NGC 3521 | 1.16 | 1.23 | 1.23 | 1.25 | 1.31 | 1.88 |
| NGC 3627 | 1.15 | 1.23 | 1.23 | 1.25 | 1.31 | 1.88 |
| NGC 3938 | 1.49 | 1.61 | 1.61 | 1.67 | 1.78 | 2.21 |
| NGC 4254 | 2.60 | 2.95 | 2.95 | 3.08 | 3.37 | 3.21 |
| NGC 4321 | 1.47 | 1.61 | 1.61 | 1.67 | 1.78 | 2.21 |
| NGC 4450 | 2.20 | 2.11 | 2.10 | 2.15 | 2.22 | 3.21 |
| NGC 4536 | 1.48 | 1.61 | 1.61 | 1.67 | 1.78 | 2.21 |
| NGC 4631 | 1.08 | 1.07 | 1.07 | 1.07 | 1.08 | 1.72 |
| NGC 4725 | 1.49 | 1.61 | 1.61 | 1.67 | 1.78 | 2.21 |
| NGC 5194 | 1.02 | 1.04 | 1.04 | 1.05 | 1.07 | 1.64 |
| Tololo 89 | 2.63 | 2.95 | 2.95 | 3.08 | 3.37 | 3.21 |
| NGC 5474 | 1.01 | 1.01 | 1.01 | 1.01 | 1.01 | 1.55 |
| NGC 5713 | 4.26 | 4.94 | 4.94 | 5.18 | 5.69 | 5.85 |
| IC 4710 | 1.11 | 1.15 | 1.15 | 1.17 | 1.21 | 1.72 |
| NGC 6822 | 1.00 | 1.00 | 1.00 | 1.00 | 1.00 | 1.34 |
| NGC 6946 | 1.01 | 1.01 | 1.01 | 1.01 | 1.01 | 1.55 |
| NGC 7331 | 1.49 | 1.61 | 1.61 | 1.67 | 1.78 | 2.21 |
| NGC 7552 | 4.28 | 4.94 | 4.94 | 5.18 | 5.69 | 5.85 |
| NGC 7793 | 1.00 | 1.00 | 1.00 | 1.00 | 1.00 | 1.34 |
Note. — Raw flux measurements are multiplied by these aperture correction factors to produce the corrected values.