Three Types of Galaxy Disks
Abstract
We present our new scheme for the classification of radial
stellar surface brightness profiles for disk galaxies. We summarize
the current theoretical attempts to understand their origin and give an
example of an application by comparing local galaxies with their
counterparts at high redshift ().
1Kapteyn Astronomical Institute, University of Groningen, NL-9700 AV Groningen, The Netherlands
2Max-Planck-Institut für extraterrestrische Physik, D-85748 Garching, Germany
3Instituto de Astrofísica de Canarias, E-38200 La Laguna, TF, Spain
1. Eclectic Introduction
Galaxy formation and evolution is one of the most fascinating topics in astrophysical research today. Along several main pathways we are trying to answer the question of how galaxies are formed and how they evolve over time within a cosmological framework for structure formation. Theoretically this is often done via numerical N-body/SPH simulations (e.g. Governato et al. 2007) or semi-analytical modelling (e.g. Somerville & Primack 1999). According to Freeman & Bland-Hawthorn (2002) the associated observational part could be divided into doing near-field cosmology, i.e. looking for the fossil records of the galaxy formation and evolution process by observing local galaxies in detail, or doing far-field cosmology, i.e. looking at distant objects for the progenitors of modern-day galaxies.
Although it is now observationally possible to obtain spatially resolved kinematics and emission-line measurements as a function of radius out to a redshift of (Weiner et al. 2006), surface photometry is still a valuable source of information. By modelling the surface-brightness distribution of a galaxy and thereby parametrising the individual components, we can obtain a common ground to measure, compare, and sort large samples of galaxies. The structures we observe, our fossil records, should be linked to the galaxy assembly.
2. Sample, Data, and Profile Classification
To create a local reference data set for comparison with high redshift galaxies we have collected imaging data for two large, complementary samples of face-on to intermediate inclined disk galaxies. The first is a diameter and distance limited sample of early-type galaxies (S0-Sb) split into two subsamples: 66 strong- or weakly barred galaxies (Erwin, Beckman & Pohlen 2005, 2007) and 45 unbarred galaxies (Aladro et al., this volume) both drawn from the UGC catalog. The images are obtained with a variety of different telescopes including the Sloan Digital Sky Survey (SDSS, DR5). The second sample is a volume limited sample (Mpc) down to a limiting magnitude (B-mag) of late-type (Sb-Sdm) galaxies by Pohlen & Trujillo (2006). It comprises all selected galaxies from the LEDA on-line catalog having useful imaging data available in the SDSS (DR2), the sole data source for this study. Details about the extraction of the analyzed surface brightness profiles can be found in the cited papers.
In our analysis we concentrated not only on providing statistics on the exponential disk as given by de Jong (1996) or MacArthur et al. (2004), but rather study the shape of the profiles, as not all –indeed only the minority– are well described with a single exponential fitting function. To do so, we revised and extended the classification of surface brightness profiles introduced in the pioneering paper by Freeman (1970) including the so called truncation of the stellar population at the edge of the disk discovered by van der Kruit (1979).
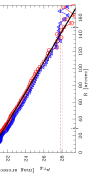
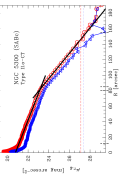
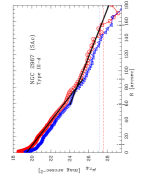
We identified three basic classes of surface brightness profiles depending on an apparent break feature or lack of one (cf. Fig.1): 1) The well known Freeman Type I that has an exponential profile, with no break. 2) Type II with a ’downbending break’, now including the truncations. 3) A completely new class, called Type III, also described by a broken exponential but with an upbending profile, shallower beyond the break. The latter, discovered by Erwin et al. (2005), is also termed anitruncated since showing the opposite behavior to the well known truncated profiles.
We have taken great care in ensuring that the critical sky subtraction is done properly, therefore always providing lower levels down to where we trust our profiles (cf. Fig.1). It turns out that the uncertainty in our sky subtraction, in almost all cases, does not interfere with the basic classification of a galaxy. Nevertheless, it is worth noting that there are now completely independent measurements (from resolved star counts) of three local counterparts for each of our main types. There is NGC 300 (Bland-Hawthorn et al. 2005), where an unchanging exponential has been detected out to as far as ten scalelengths, M 33 (Ferguson et al. 2006), where the profile is well fitted by a broken exponential with a downbending break, and M 31 (Ibata et al. 2005), which could be regarded as a Type III (antitruncated) disk.
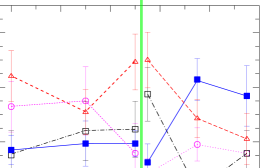
In order to address the origin of the different types we have introduced an interpretative subclassification scheme for our profiles. For example, we distinguish between those Type II profiles possibly associated with a bar resonance, called Type II.o-OLR, and those probably related to a star-formation threshold, called classical truncation or Type II-CT (see next section, as well as Erwin et al. and Aladro et al., this volume). Evidence about the origin may come from the trends we observed with Hubble type (see Fig.2). Any model of galaxy formation and evolution should be able to explain why we find for example more Type II-CT cases in late-type than early-type galaxies, whereas the trend is the other way around for the Type I galaxies.
3. Origin and Implications
Our basic classification is simply morphological in nature. We do pure taxonomy similar to grouping galaxies along the Hubble sequence. But what is the physical background for the different types, what does theory tell us about surface brightness profiles? It turn out our current physical picture lags behind the observational evidence. The origin of purely exponential disks (Type I) in itself is not fully understood, although well known since the 1940-50’s. One of the most successful attempts to show that an exponential disk can arise naturally out of disk formation conditions was by Yoshii & Sommer-Larson (1989) who showed that an exponential disk will form if the viscosity time scale and the star formation time scale are comparable. The currently favored model ascribes the classical truncations (Type II-CT) to the effect of a star formation threshold in disk column density as the edge is approached (Kennicutt 1989; Schaye 2004; Elmegreen & Hunter 2006; Li et al. 2006). On the other hand, using purely collisionless -body simulations Debattista et al. (2006) find downbending breaks appearing in the disk profile as a resonance phenomenon, which may be associated to our Type II.o-OLR breaks. Observationally, there is circumstantial evidence that some of the galaxies with Type III profiles are associated with recent mergers (e.g. M31), supported now by the new N-body/SPH simulations of Younger et al. (2007) showing that minor mergers could produce upbending stellar profiles in the remnant galaxy. On the other hand, by a small change of the input gas density Elmegreen & Hunter (2006) are also able to produce Type III profiles within their evolutionary model of an isolated galaxy with star formation.
Once the nature of the galactic stellar disk is determined it will be fully justified to use the shape of the profiles and the position of the breaks for comparison of galaxies at various redshifts as done by Pérez (2004), Trujillo & Pohlen (2005) or Tamm & Tenjes (2006). For example, Trujillo & Pohlen (2005) presented a first direct application of the new classification scheme by exploring the Hubble Ultra Deep Field. Using the position of the truncation as a direct estimator of the size of the stellar disk it becomes possible to observe inside-out growth of galactic disks –inherent in the current galaxy formation and evolution models– comparing the local late-type Type II galaxies with their counterparts at high-z (i.e. ) in a straightforward manner. Although still uncertain because of the small number of galaxies analyzed, their results suggest that the radial position of the truncation has increased with cosmic time by kpc in the last Gyr indicating a small to moderate () inside-out growth of the disk galaxies since .
Acknowledgments.
M.P. would like to thank the organisers and the Kapteyn Instituut for
their generous financial support. P.E. was supported by DFG Priority
Program 1177. This work was supported by grant AYA2004.08251-CO2-01 of
the Spanish Ministry of Education and Science, and project P3/86 of
the IAC.
References
- Bland-Hawthorn et al. (2005) Bland-Hawthorn, J., Vlajić, M., Freeman, K. C., & Draine, B. T. 2005, ApJ, 629, 239
- Debattista et al. (2006) Debattista, V. P., Mayer, L., Carollo, C. M., Moore, B., Wadsley, J., & Quinn, T. 2006, ApJ, 645, 209
- de Jong (1996) de Jong, R. S. 1996, A&A 313, 45
- Elmegreen & Hunter (2006) Elmegreen, B. G., & Hunter, D. A. 2006, ApJ, 636, 712
- Erwin et al. (2005) Erwin, P., Beckman, J.E., & Pohlen, M. 2005, ApJL, 626, 81
- Erwin et al. (2007) Erwin, P., Pohlen, M., & Beckman, J.E. 2007, AJ, sub.
- Ferguson et al. (2006) Ferguson, A., Irwin, M., Chapman, S., Ibata, R., Lewis, G., & Tanvir, N. 2006, astro-ph/0601121
- Freeman (1970) Freeman K.C. 1970, ApJ, 160, 811
- Freeman & Bland-Hawthorn (2002) Freeman, K., & Bland-Hawthorn, J. 2002, ARA&A, 40, 487
- Governato et al. (2007) Governato, F., et al. 2007, MNRAS, 374, 1479
- Ibata et al. (2005) Ibata, R., Chapman, S., Ferguson, A. M. N., Lewis, G., Irwin, M., & Tanvir, N. 2005, ApJ, 634, 287
- Kennicutt (1989) Kennicutt, R.C., 1989, ApJ, 344, 685
- Li et al. (2006) Li, Y., Mac Low, M.-M., & Klessen, R. S. 2006, ApJ, 639, 879
- MacArthur et al. (2004) MacArthur, L. A., Courteau, S., Bell, E., & Holtzman, J. A. 2004, ApJS, 152, 175
- Pérez (2004) Pérez, I. 2004, A&A, 427, L17
- Pohlen & Trujillo (2006) Pohlen, M., & Trujillo, I. 2006, A&A, 454, 759
- Schaye (2004) Schaye, J. 2004, ApJ 609, 669
- Somerville & Primack (1999) Somerville, R. S., & Primack, J. R. 1999, MNRAS, 310, 1087
- Tamm & Tenjes (2006) Tamm, A., & Tenjes, P. 2006, A&A, 449, 67
- Trujillo & Pohlen (2005) Trujillo, I., & Pohlen, M. 2005, ApJL, 630, L17
- van der Kruit (1979) van der Kruit, P. C., 1979, A&AS 38, 15
- Weiner et al. (2006) Weiner, B. J., et al. 2006, ApJ, 653, 1027
- Yoshii & Sommer-Larson (1989) Yoshii Y., & Sommer-Larson J. 1989, MNRAS 236, 779
- Younger et al. (2007) Younger, J.D., T. J. Cox,T.J., Anil C. Seth,A.C., & Hernquist, L., 2007, ApJ, sub.