The Kinematically Measured Pattern Speeds of NGC 2523 and NGC 4245
Abstract
We have applied the Tremaine-Weinberg continuity equation method to derive the bar pattern speed in the SB(r)b galaxy NGC 2523 and the SB(r)0/a galaxy NGC 4245 using the Calcium Triplet absorption lines. These galaxies were selected because they have strong inner rings which can be used as independent tracers of the pattern speed. The pattern speed of NGC 2523 is 26.4 6.1 km s-1 kpc-1, assuming an inclination of 49.7∘ and a distance of 51.0 Mpc. The pattern speed of NGC 4245 is 75.5 31.3 km s-1 kpc-1, assuming an inclination of 35.4∘ and a distance of 12.6 Mpc. The ratio of the corotation radius to the bar radius of NGC 2523 and NGC 4245 is 1.4 0.3 and 1.1 0.5, respectively. These values place the bright inner rings near and slightly inside the corotation radius, as predicted by barred galaxy theory. Within the uncertainties, both galaxies are found to have fast bars that likely indicate dark halos of low central concentration. The photometric properties, bar strengths, and disk stabilities of both galaxies are also discussed.
1 Introduction
The presence of barred structures in disk galaxies is fairly common. The fraction of spiral galaxies containing a strong bar is 30 in the optical (de Vaucouleurs 1963) and is nearly double that when counted in the near-infrared (Eskridge et al. 2000; Hernandez et al. 2005). The bar pattern speed (), or the rate at which the bar rotates, is one of the main factors influencing the morphology and dynamical structure of the host galaxy. Although this parameter is important in the secular evolution of galaxies (e.g., Lynden-Bell & Kalnajs 1972; Kalnajs 1991; Kormendy & Kennicutt 2004), it has only been determined for a small number of galaxies. The common methods of determining pattern speed involve either identifying morphological features, such as rings, with resonance radii (Buta & Combes 1996), looking for residual patterns in the velocity field (Canzian 1993; Purcell 1998), looking for phase crossings of and -band spirals (Puerari & Dottori 1997) or H and CO arms (Egusa et al. 2006), or recreating the observed morphology through dynamical models (e.g., Salo et al. 1999; Rautiainen, Salo, & Laurikainen 2005). A new method based on the theoretically-predicted azimuthal phase shift between the potential and density in a galaxy with a global, self-consistent mode has been proposed by Zhang & Buta (2007), who also summarize other methods to locate corotation and estimate pattern speeds.
Most of these methods give only indirect estimates of the bar pattern speed, either through model assumptions or because they locate resonances directly and require a rotation curve to estimate a pattern speed. A more direct approach is through the kinematic method derived by Tremaine & Weinberg (1984, hereafter TW). TW determined that the pattern speed of a bar can be estimated from the luminosity weighted mean line-of-sight velocities, , and luminosity weighted mean positions, , of a tracer that obeys the continutity equation. These quantities are to be measured along lines parallel to a barred galaxy’s major axis. The galaxy’s inclination, , is also required to determine . The quantities are related as follows,
| (1) |
A requirement of the TW method is that the continuity equation be satisfied. This led to SB0 galaxies being the first objects to which the method was applied (e.g., Merrifield & Kuijken 1995; Gerssen et al. 1999). These galaxies can have strong bar patterns but lack the dust and star formation that complicate similar measurements for later-type systems. Since the continuity equation requires that the tracer be something that is neither created nor destroyed, significant star formation would violate the equation. This is the reason that applications to spirals have been more limited. Hernandez et al. (2005) discuss the application of the TW method to atomic, molecular, and ionized gas phases in spiral galaxies.
The main goal of previous SB0 studies was to use the TW method to measure the ratio of the corotation radius (where the circular angular velocity = ) to the bar radius. If the ratio is between 1.0 and 1.4, a bar is said to be ”fast,” while if greater than 1.4, a bar is said to be ”slow”. Debattista & Sellwood (2000) argued that fast bars exist in halos with a low central concentration since the bar rotation rate would rapidly decrease due to dynamical friction with the halo. Certain galaxy models from Athanassoula (2003) also show this correlation between fast bars and halos of low central concentration. A drawback of SB0 galaxies is their simplicity. Apart from the ill-defined ”ends” of the bar, there are no gaseous features that might be tied to the pattern speed that could be used to evaluate other implications of the method.
Ringed SB0/a galaxies offer SB0-like galaxies with conspicuous rings of gas that can be tied to specific resonances through numerical models. In addition, application of the TW method at longer wavelengths than previous studies allows the possibility of measuring pattern speeds even in intermediate-type spirals which are more affected by dust. If such spirals also have rings, then the resonance idea can be tested in them as well.
The goal of our study is to determine the pattern speed of two resonance ring galaxies by applying the TW method in order to examine the central concentration of the dark matter halo as well as the possible resonance identifications of the rings. This paper details our TW analysis of the barred galaxies NGC 2523 and NGC 4245, two excellent cases which show strong inner rings. The observations are summarized in section 2. The subsequent analysis of the data is described in section 3, while the measured pattern speeds and their significance is discussed in section 4. Section 5 discusses the potential testing of barred spiral theory in the future using the findings from this paper.
2 Observations
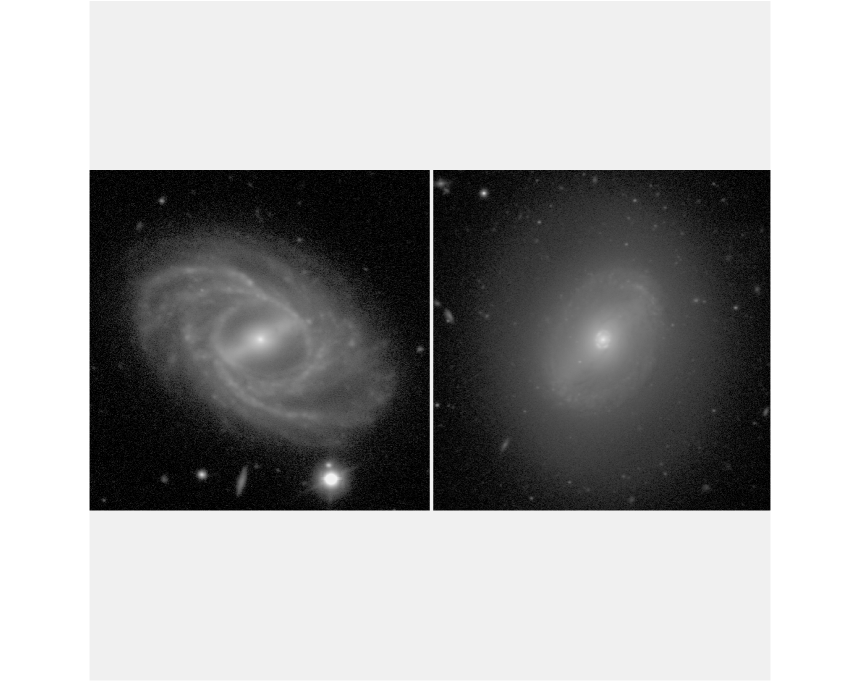
The barred galaxies, NGC 2523 and NGC 4245, were selected for this project because of their strong inner ring features, accessibility, inclination, and preferential orientation of the bar axis to the galaxy major axis. Figure 1 shows -band images obtained with the Nordic Optical Telescope in 2003 January and 2004 January, respectively (Laurikainen et al. 2005). The images are in the units of mag arcsec-2 used in the de Vaucouleurs Atlas of Galaxies (Buta, Corwin, & Odewahn 2007, hereafter BCO). NGC 2523 is a member of a small nearby group called LGG 154, whose mean redshift is 3674 km s-1 (Garcia 1993). The distance we adopt for NGC 2523 is 51.0 Mpc (Kamphuis et al. 1996) with a Hubble constant of 70 km s-1 Mpc-1. It has an absolute -band magnitude of 21.6 (derived from BCO) and a revised de Vaucouleurs type of SB(r)b. The inner ring of this galaxy is a conspicuous closed feature, a rare true ring rather than a pseudoring. Outside the inner ring, the spiral pattern is multi-armed and no outer pseudoring is formed. NGC 4245 is a low luminosity member of the Coma I galaxy group, known to harbor a significant number of HI deficient galaxies (García-Barreto et al. 1994). The group (LGG 279) includes 17 galaxies listed by García (1993) and has a mean redshift of 974 km s-1. The distance we adopt for NGC 4245 is 12.6 Mpc (García-Barreto et al. 1994) with an H0 value of 70 km s-1 Mpc-1. NGC 4245 has an absolute -band magnitude of 18.0 (derived from BCO) and a revised de Vaucouleurs type of SB(r)0/a. In addition to a gaseous inner ring made of tightly wrapped spiral arms, NGC 4245 has a very regular nuclear ring, but lacks an outer ring that is often present in such a galaxy. García-Barreto et al. (1994) found that NGC 4245 is one of the more HI deficient members of the Coma I group, suggesting that its lack of an outer ring is due to gas stripping.
In each galaxy, the bar is well-defined and the inner ring deprojects into an intrinsic elliptical shape aligned parallel to the bar (BCO). The deprojected ring major axis radii and axis ratios are 35.3 (8.7 kpc) and 0.74 for the inner ring of NGC 2523, 40.6 (2.5 kpc) and 0.77 for the inner ring of NGC 4245, and 4.8 (0.29 kpc) and 0.92 for the nuclear ring of NGC 4245. Color index maps (also in BCO) indicate that the rings are narrow zones of star formation. The inner ring of NGC 2523 has a somewhat asymmetric star formation distribution, while the inner and nuclear rings of NGC 4245 are both well-defined symmetric regions of enhanced blue colors. In the near-infrared, the star forming rings of NGC 4245 are much less conspicuous and the galaxy very much resembles an SB0 galaxy. These observed characteristics of the galaxies’ rings are similar to those of gaseous resonance rings formed in test-particle simulations of barred galaxies (see review by Buta & Combes 1996). For this reason, NGC 2523 and NGC 4245 are ideal for our test.
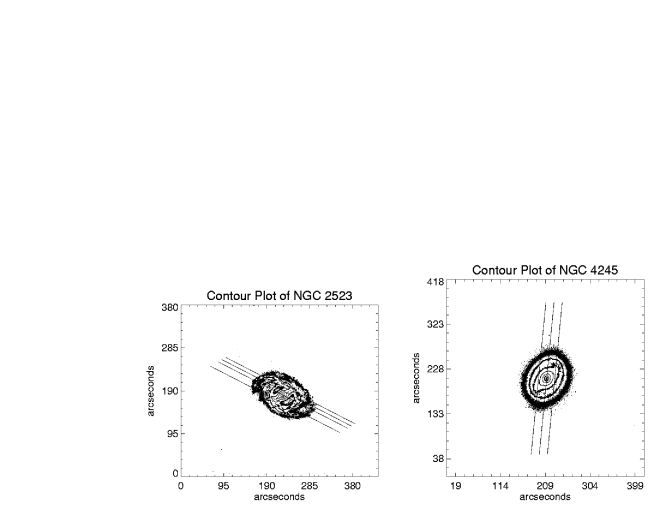
We obtained long-slit spectra of NGC 2523 and NGC 4245 on the nights of 2006 January 18 and 19 using the RC Spectrograph on the KPNO Mayall 4 meter telescope. The T2KB CCD was used as a detector and was configured with the KPC-18C grating and a 2 x 5.4 slit which provided a spectral resolution of 2.44. The region encompassing the Calcium Triplet (8498, 8542, 8662 rest wavelengths; Dressler 1984) was observed. The benefits of observing in this region are the reduced influence of extinction and the strength of the absorption lines. The main disadvantage is that there are a significant number of night sky emission lines in the same wavelength domain. The long-slit positions were set both coincident with and offset parallel to the major axis of each galaxy (see Figure 2). The total exposure time for each offset slit position was 9000 seconds. The exposure times for positions along the major axis of NGC 2523 and NGC 4245 were 6000 and 7500 seconds, respectively (see Table 1). Spectra were also taken of two K-giant stars, HD 106278 and HD 109281, which served as velocity standards. The spectra were reduced, combined, and sky-subtracted using standard IRAF111IRAF is distributed by the National Optical Astronomy Observatories, which are operated by AURA, Inc., under cooperative agreement with the National Science Foundation. routines. The sky levels were determined from rows in the outer parts of the slit in each case. Imperfect subtraction of the night sky lines is a significant source of uncertainty mainly for NGC 2523, due to its unfavorable redshift. It should be noted also that the atmospheric observing conditions were less than ideal during our two observing nights due to intermittent cloud cover and high wind speeds that required the dome to be closed on one occasion. As a result, more observing time was spent to reduce noise on the outer spectral positions than the central positions. The outer positions correspond to the endpoints of a line fitted to data plotted in the - plane. Accuracy in the endpoints provides a more accurate slope determination of a line fit to the points.
In addition to the spectra, we have used 2.15m -band images, as well as standard and -band images, obtained with the 2.5-m Nordic Optical Telescope (NOT) for some of our analysis. Details of these observations are provided by Laurikainen et al. (2005) and Buta et al. (2006).
3 Analysis
3.1 Bar, Bulge, and Disk Properties
Detailed isophotal analysis of the deep NOT and -band images was used to derive photometric orientation parameters of the two galaxies listed in Table 2. The -band image is not as deep as the optical images in each case, and thus the optical parameters were used to deproject the -band images. Deprojection was facilitated by two-dimensional decomposition using the approach outlined by Laurikainen et al. (2004, 2005). This is a multicomponent code, which for our purposes was used with a Sersic function to parametrize the bulge, an exponential to parametrize the disk, and a Ferrers function to parametrize the bar. For the bulge, =4 corresponds to a de Vaucouleurs law while =1 corresponds to an exponential. The decomposition parameters listed in Table 2 for NGC 4245 are from Laurikainen et al. (2005). In both galaxies, the Sersic index is close to 1.0, implying bulges that more exponential-like than the de Vaucouleurs profile.
Bar strengths were estimated using the gravitational torque approach (Laurikainen & Salo 2002), where denotes the maximum of the tangential force normalized to the mean axisymmetric radial force. This approach uses a deprojected -band image that is converted to a gravitational potential assuming a constant mass-to-light ratio. The deprojections were performed by subtracting the bulge model from the total image, deprojecting the residual bar and disk components, and then adding the bulge back as a spherical component. The spiral arm torques are small for NGC 4245, so a bar-spiral separation analysis was not needed to determine the bar strength . In this case, can be taken as the total nonaxisymmetry strength in the galaxy given by Laurikainen et al. (2005). For NGC 2523, it was necessary to do a bar-spiral separation analysis in order to remove the effects of spiral arm torques. The procedure we used for this is outlined by Buta, Block, & Knapen (2003) and Buta et al. (2005). We found that a single Gaussian represents the radial relative Fourier intensity profiles of the bar of NGC 2523 fairly effectively, allowing a clean separation of the bar from the spiral. For NGC 4245, Buta et al. (2006) show that the relative Fourier intensity profiles of the bar require a double gaussian fit, owing to the coexistence of the primary bar with an aligned oval.
The resulting bar strengths listed in Table 2 are 0.55 for NGC 2523 and 0.18 for NGC 4245, assuming the vertical density profile is exponential. For NGC 2523, we assumed a vertical scale height of , while for NGC 4245, we assumed , based on the empirical correlation derived by de Grijs (1998) between and morphological type. The bar in NGC 2523 is clearly exceptional in strength, while that in NGC 4245 barely merits the SB classification.
3.2 Mean Positions and Line-of-Sight Velocities Along the Slit
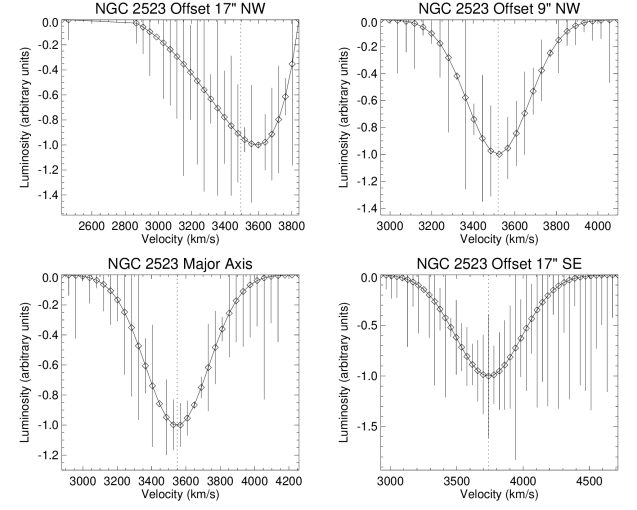
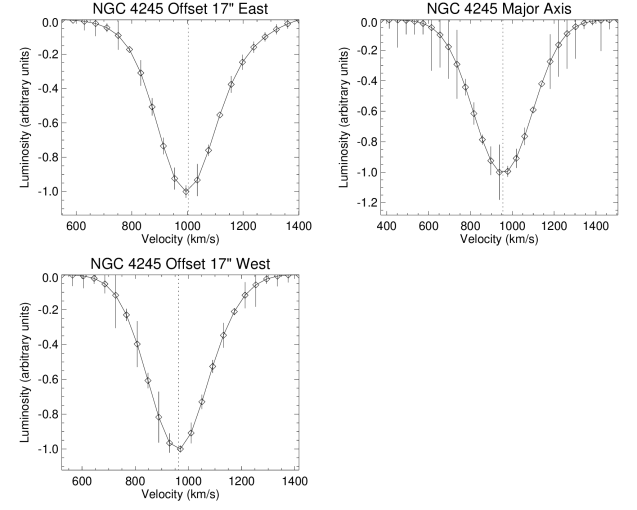
The luminosity weighted mean position along each slit position was determined by summing the two-dimensional data in the spectral direction. The resulting luminosity profiles versus slit position are shown in the upper panels of Figures 3 and 4. The mean positions were calculated from these profiles and are marked on the figures (vertical dashed lines) as well as recorded in Table 1. The errors in are negligible compared with those in .
The lower panels of Figures 3 and 4 show the line of sight velocity profiles versus the slit position . The radial velocities for each slit position were determined by cross correlating the galaxy spectra with the spectra of the standard stars using the IRAF routine XCOR (e.g. Tonry & Davis 1979) and applying a heliocentric correction. The XCOR cross correlation routine assumes a galaxy spectrum is a convolution of a stellar spectrum with a Gaussian which describes the line-of-sight velocity dispersion of the galaxy’s stars. A stellar template spectrum is cross correlated with the galaxy spectrum to produce a function with a peak at the redshift of the galaxy and with a width corresponding to the dispersion of the galaxy. Peaks in the cross correlation function are identified and fitted by parabolas to obtain their position and width. XCOR was used instead of FQUOT, a Fourier quotient routine, because it was more stable for our purposes. Due to the strength and number of night sky emission lines in the galaxy spectra, each absorption line in the Calcium Triplet was individually cross correlated to the corresponding line found in the standard star spectra. This was possible because the Calcium Triplet lines are well-separated and can be treated individually.
The horizontal dashed lines in Figures 3 and 4 show the luminosity-weighted mean velocities for each slit position for NGC 4245 and three of the slit positions for NGC 2523. The results for NGC 2523 were especially difficult to extract because of the stronger night sky emission line contaminations in that case, due to the higher redshift as noted. The luminosity-weighted mean velocities of each slit position for both galaxies are also listed in Table 1. The systemic velocities we find for both galaxies agree with published estimates within the errors (i.e. Catinella et al. 2005; Springob et al. 2005).
In Figures 5 and 6, we show examples of line profiles derived from co-adding the 8542 rest wavelength spectra for each offset position of each galaxy. The line profiles were derived by fitting four Gaussian components to the observed profile, similar to what has been done in previous TW studies (e.g. Merrifield & Kuijken 1995; Gerssen et al. 1999). The luminosity-weighted mean velocities derived from these example profiles (see captions in Figures 5 and 6) support the same sense of rotation as those derived from XCOR, though they are found to be larger than the XCOR derived velocities (Table 1). In a TW analysis of four galaxies, Gerssen et al. (2003) concluded that the obtained pattern speeds did not differ significantly when either technique was applied to determine . An advantage of using XCOR is that velocities and velocity dispersions are determined along each slit, allowing the derivation of rotation curves and the evaluation of disk stability properties.
3.3 Circular Velocities, Velocity Dispersions, and Disk Stability
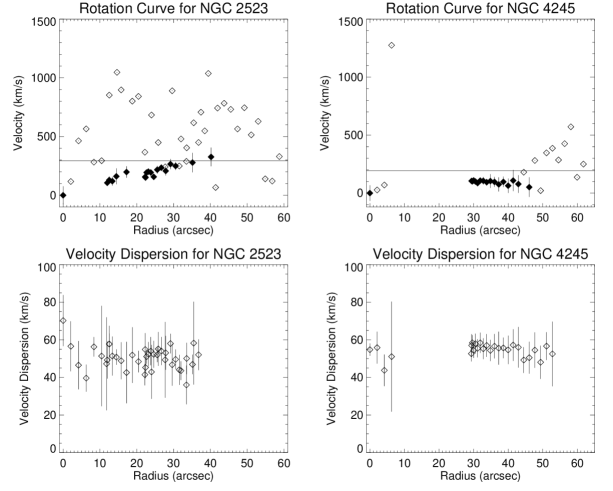
Rotation curves of the two galaxies can be easily derived from the velocities extracted by XCOR of the different slit positions. The deprojected circular velocities were determined with the assumption that NGC 2523 has an inclination of 49.7∘ and NGC 4245 has an inclination of 35.4∘ [derived from in Table 2 and assuming an intrinsic oblate spheroid axis ratio () of 0.2 (Schommer et al. 1993)]. These rotation curves are shown in Figure 7 along with published estimates of the maximum gaseous rotation velocities in each case (horizontal lines). We notice that the inner 20 of our rotation curve for NGC 2523 resembles that of Héraudeau et al. (1999), which was determined through Mg absorption spectroscopy. The velocity dispersions outputted by XCOR were corrected for an instrumental dispersion of 30 km s-1 and are shown in Figure 7 as well. We have assumed that == in which case the observed velocity dispersion is equal to . The velocity dispersions we measure in NGC 2523 are approximately a third of those found by Héraudeau et al. (1999) in the same radial range. We find that the velocity dispersions in NGC 4245 appear constant across the observed portions of the galaxy. This behaviour is not unprecedented in SB0 galaxies. Constant velocity dispersion values were also found across the SB0 galaxy NGC 4596 (Bettoni & Galetta 1997). If we assume that , =0, and the observed velocity dispersion is , then the velocity dispersions plotted in Figure 7 would be increased by a factor of 1/ for each galaxy. For the inclinations we assume, this corresponds to an increase in the velocity dispersions by a factor of 1.31 for NGC 2523 and 1.73 for NGC 4245.
The stability of the galaxy disks can be evaluated with knowlege of the velocity dispersions and a few estimated parameters. Toomre (1964) showed that a two-dimensional galaxy disk is stable against axisymmetric perturbations when
| (2) |
where is the radial velocity dispersion, is the epicyclic frequency, is the gravitational constant, and is the surface mass density of the disk.
Gaseous rotation curves are needed to determine since they do not suffer from the same effects of velocity dispersion support as stellar rotation curves. Because gaseous rotation curves of these galaxies are not available, we assume that the rotation velocity of the gas component is constant and equal to the maximum gaseous rotational velocity () obtained in the literature from observed HI line widths (i.e. Kamphuis et al. 1996; García-Barreto et al. 1994). In this case, is equal to .
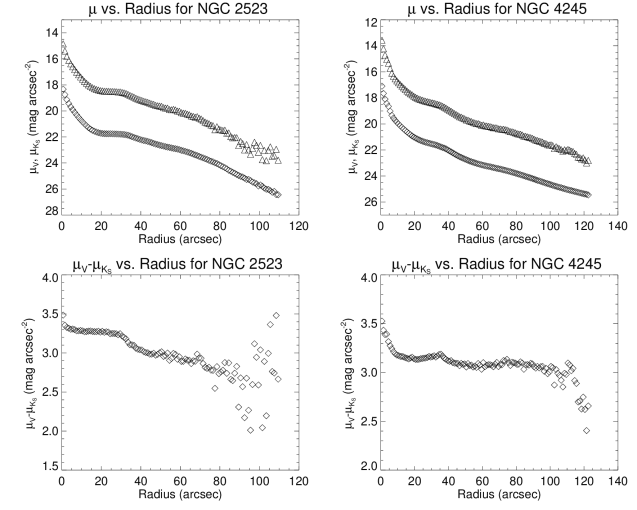
In order to derive Toomre for the stellar component alone, we have used surface brightness profiles in conjunction with a color-dependent mass-to-light ratio formula from Bell & de Jong (2001) to estimate . We used the NOT and -band images to obtain azimuthally averaged surface brightness profiles of the galaxies (Figure 8). Published photoelectric aperture photometry from Longo & de Vaucouleurs (1983) was used to calibrate the -band images, while 2MASS photometry within a 14 aperture from the NASA/IPAC Extragalactic Database (NED) was used to calibrate the -band images. Mass-to-light ratios were derived from the color profiles after correction for Galactic extinction values from NED and using from Table 1 of Bell & de Jong (2001). (This ignores the generally small difference between and .) Surface mass density profiles were derived by converting the azimuthally-averaged surface brightness profiles into solar luminosities per square parsec using an absolute magnitude =3.33 from Worthey (1994), and multiplying the values by .
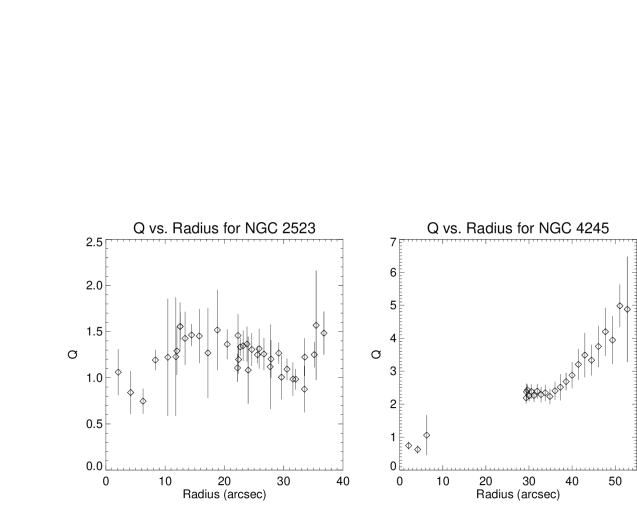
Figure 9 shows our determinations of the lower limit values of versus radius for both galaxies (as seen in Figure 6 of Kormendy 1984). In this figure we assume that == and the observed velocity dispersion is equal to . For NGC 2523, ranges from 0.7 0.1 to 1.6 0.6. falls below 1 from approximately 4 to 6 and 32 to 34. For NGC 4245, ranges from 0.6 0.1 to 5.0 0.7 and falls below 1 from approximately 2 to 4. The upper limit values of are found from our assumption that =0. In this case, ranges from 1.0 0.2 to 2.1 0.8 for NGC 2523 and reaches 1 at approximately 6. For NGC 4245, ranges from 1.1 0.2 to 8.6 1.1. The results imply marginal stability for NGC 2523 and much higher stability for NGC 4245. This could explain the latter’s much smoother light distribution.
4 Results
4.1 Pattern Speeds
From the data in Table 1, it is straightforward to calculate the bar pattern speeds of the two sample galaxies. Figure 10 shows the plots of versus , where the slope of the line fitting the data points is . The slope and corresponding 1 error that best fits the NGC 2523 data is = 5.0 1.2 km s-1 arcsec-1. If we consider that the galaxy is inclined 49.7∘ and is at a distance of 51.0 Mpc, then = 26.4 6.1 km s-1 kpc-1. The slope and corresponding 1 error that best fits the NGC 4245 data is = 2.7 1.1 km s-1 arcsec-1. If we consider that this galaxy has an inclination of 35.4∘ and is at a distance of 12.6 Mpc, then = 75.5 31.3 km s-1 kpc-1.
The value for the linear fit of the NGC 2523 data is 2.2 while for NGC 4245 it is 0.1, each with 3 degrees of freedom (Merrifield & Kuijken 1995). The values imply that the observations from different slit positions are all consistent with the single bar pattern speed for each galaxy as described above. This also implies that the error analysis returns a realistic measure of the uncertainty in each of the V estimates. It is noteworthy that NGC 4245 is the first SB0 galaxy with strong resonance rings to have its pattern speed measured by the TW method.
4.2 Maximum Disks and Frequency Curves
A maximum disk, interpreted to be correlated with a fast bar, can be determined from the distance independent ratio /, where is the corotation radius and is the bar semimajor axis radius. Fast bars occur in the 1.0 1.4 regime (Debattista & Sellwood 2000), while bars are considered slow when 1.4. Contopoulos (1980) has concluded that self-consistent bars cannot exist when 1.0, though Zhang & Buta (2007) have argued to the contrary. With the assumed flat rotation curve, is found by simply dividing the maximum circular velocity () by . In the case of NGC 2523, if we assume an inclination of 49.7∘ then is 294 km s-1 (Kamphuis et al. 1996) and the deprojected bar length of the galaxy can be visually estimated as 33.5. Taking the inclination of NGC 4245 to be 35.4∘, is 199 km s-1 (García-Barreto et al. 1994) and the deprojected bar length can be estimated to be 38.1 by visual inspection. for NGC 2523 is then 1.4 0.3 and for NGC 4245 is 1.1 0.5. The errors given should be considered as minimum errors of . The values are shown as compared to our derived rotation velocities in Figure 7.
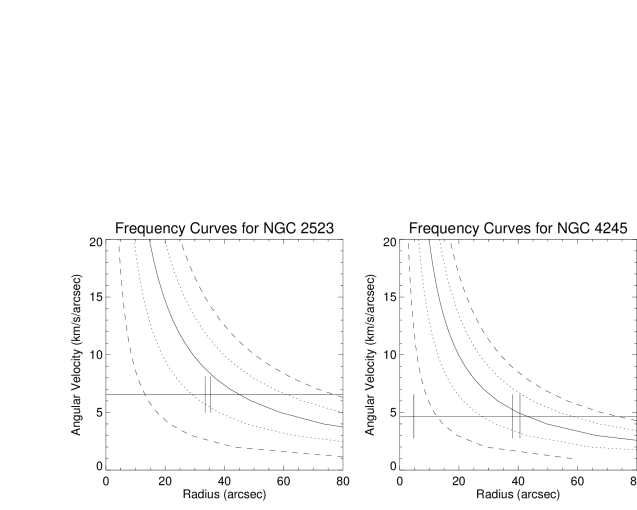
With knowledge of the maximum circular velocity of a galaxy, it is straightforward to derive the familiar Lindblad precession frequency curves that show how resonance locations vary with angular velocity in the linear (epicyclic) approximation. Overplotting the pattern speed of the galaxy allows one to predict the radius at which the resonances and possible resonance features occur. This is shown in Figure 11. One caveat is that these curves are not reliable at small radii because we have assumed only a single rotation velocity. In reality, the rotation curves would rise more slowly to a maximum, such that would show a finite maximum. We could evaluate the resonance identification of the nuclear ring of NGC 4245 only with improved rotation information in the central few kpc. Though the precision of our estimates is not very high, we can say that the inner rings of our two galaxies lie close to and inside the bar corotation radius. This is consistent with the barred spiral theoretical studies of Schwarz (1984) and Rautiainen & Salo (2000). The curves for NGC 4245 do suggest that the outer Lindblad resonance (OLR) should lie within the visible disk. Within the uncertainties, the outer spiral pattern of NGC 2523 extends to the OLR.
5 Future Work
It remains to be seen how the kinematic bar pattern speeds measured through the use of the TW method compare to the dynamical bar pattern speeds derived through simulations (e.g., Rautiainen, Salo, & Laurikainen 2005). If the values derived by the two methods concur, it would be a strong indicator that the theory describing bar patterns agrees with observations. This is important because galaxy modeling can be applied to a wide range of galaxies, while the TW method is limited to galaxies oriented at a modest inclination with intermediate bar-to-major-axis position angles. NGC 4245 is an excellent candidate for such a test due to the good statistical fit of the measured pattern speed as well as the strong multiple resonance ring features (i.e. nuclear and inner rings). The resonance features apparent in this galaxy will help to constrain the dynamical models used to determine the bar pattern speed.
P. Treuthardt and R. Buta acknowledge the support of NSF Grant AST050-7140. H. Salo and E. Laurikainen acknowlege the Academy of Finland for support. This research made use of the NASA/IPAC Extragalactic Database (NED), which is operated by the Jet Propulsion Laboratory, California Institute of Technology, under contract with NASA.
References
- (1)
- (2) Aaronson, M., Huchra, J., Mould, J., Tully, R., Fisher, J., van Woerden, H., Goss, W., Chamaraux, Mebold, U., Siegman, B., Berriman, G., & Persson, S. 1982, ApJS, 50, 241
- (3)
- (4) Athanassoula, E. 2003, MNRAS, 341, 1179
- (5)
- (6) Bell, E. & de Jong, R. 2001, ApJ, 550, 212
- (7)
- (8) Bettoni, D., & Galetta, G. 1997, A&ASS, 124, 61
- (9)
- (10) Buta, R. J. 1995, ApJS, 96, 39
- (11)
- (12) Buta, R. J. & Combes, F. 1996, Fund. Cosmic Phys., 17, 95
- (13)
- (14) Buta, R., Block, D. L., and Knapen, J. H. 2003, AJ, 126, 1148
- (15)
- (16) Buta, R. J., Corwin, H. G., & Odewahn, S. C. 2007, The de Vaucouleurs Atlas of Galaxies (Cambridge: Cambridge U. Press; BCO)
- (17)
- (18) Buta, R., Laurikainen, E., Salo, H., Block, D. L., and Knapen, J. H. 2006, AJ, 132, 1859
- (19)
- (20) Buta, R., Vasylyev, S., Salo, H., & Laurikainen, E. 2005, AJ, 130, 506
- (21)
- (22) Catinella, B., Haynes, M. P., & Giovanelli, R. 2005, AJ, 130, 1037
- (23)
- (24) Canzian, B. 1993, ApJ, 414, 487
- (25)
- (26) Contopoulos, G. 1980, A&A, 81, 198
- (27)
- (28) Corsini, E. M., Debattista, V. P., & Aguerri, J. A. L. 2003, 599, L29
- (29)
- (30) de Vaucouleurs, G. 1963, ApJS, 8, 31
- (31)
- (32) Debattista, V. P., & Sellwood, J. A. 2000, ApJ, 543, 704
- (33)
- (34) de Grijs, R. 1998, MNRAS, 299, 595
- (35)
- (36) Dressler, A. 1984, ApJ, 286, 97
- (37)
- (38) Egusa, F., Sofue, Y., & Nakanishi, H. 2006, PASJ, in press (astro-ph/0410469)
- (39)
- (40) Eskridge, P. B., Frogel, J. A., Pogge, R. W., et al. 2000, AJ, 119, 536
- (41)
- (42) Garcia, A. 1993, A&AS, 100, 47
- (43)
- (44) García-Barreto, J. A., Downes, D., & Huchtmeier, W. K. 1994, A&A, 288, 705
- (45)
- (46) Gerssen, J., Kuijken, K., & Merrifield, M. R. 1999, MNRAS, 306, 926
- (47)
- (48) Gerssen, J., Kuijken, K., & Merrifield, M. R. 2003, MNRAS, 345, 261
- (49)
- (50) Héraudeau, Ph., Simien, F., Maubon, G., & Prugniel, Ph. 1999, A&AS, 136, 509
- (51)
- (52) Hernandez, O., Wozniak, H., Carignan, C., Amram, P., Chemin, L., & Daigle, O. 2005, ApJ, 632, 253
- (53)
- (54) Kalnajs, A. 1991, in Dynamics of Disk Galaxies, B. Sundelius, ed., Göteborg, Sweden, p. 323
- (55)
- (56) Kamphuis, J. J., Sijbring, D., & van Albada, T. S. 1996, A&AS, 116, 15
- (57)
- (58) Kormendy, J. 1984, ApJ, 286, 132
- (59)
- (60) Kormendy, J. & Kennicutt, R. C. 2004, ARAA, 42, 603
- (61)
- (62) Larson, R. B. & Tinsley, B. M. 1978, ApJ, 219, 46
- (63)
- (64) Laurikainen, E. & Salo, H. 2002, MNRAS, 337, 1118
- (65)
- (66) Laurikainen, E., Salo, H., Buta, R., & Vasylyev, S. 2004, MNRAS, 355, 1251
- (67)
- (68) Laurikainen, E., Salo, H., & Buta, R. 2005, MNRAS, 362, 1319
- (69)
- (70) Longo, G. & de Vaucouleurs, A. 1983, General Catalogue of Photoelectric Magnitudes and Colors in the , , System of the 3,578 Galaxies Brighter than the 16th -magnitude (1936-1982), University of Texas Monograph No. 3.
- (71)
- (72) Lynden-Bell, D. & Kalnajs, A. J. 1972, MNRAS, 157, 1
- (73)
- (74) Merrifield, M. R. & Kuijken, K. 1995, MNRAS, 274, 933
- (75)
- (76) Puerari, I. & Dottori, H. 1997, ApJ, 476, L73
- (77)
- (78) Purcell, G. B. 1998, PhD Thesis, University of Alabama
- (79)
- (80) Rautiainen, P. & Salo, H. 2000, A&A, 362, 465
- (81)
- (82) Rautiainen, P., Salo, H., & Laurikainen, E. 2005, ApJ, 631, L129
- (83)
- (84) Salo, H., Rautiainen, P., Buta, R., Purcell, G. B., Cobb, M. L. Crocker, D. A., & Laurikainen, E. 1999, AJ, 117, 792
- (85)
- (86) Schommer, R. A., Bothun, G. D., Williams, T. B., & Mould, J. R. 1993, AJ, 105, 97
- (87)
- (88) Schwarz, M. P. 1984, MNRAS, 209, 93
- (89)
- (90) Springob, C. M., Haynes, M. P., Giovanelli, R. & Kent, B. R. 2005, ApJS, 160, 149
- (91)
- (92) Tonry, J. & Davis, M. 1979, AJ, 84, 1511
- (93)
- (94) Toomre, A. 1964, ApJ, 139, 1217
- (95)
- (96) Tremaine, S., & Weinberg, M. D. 1984, ApJ, 282, L5 (TW)
- (97)
- (98) Tully, R. B. 1988, Nearby Galaxies Catalog, (Cambridge: Cambridge U. Press)
- (99)
- (100) Worthey, G. 1994, ApJS, 95, 107
- (101)
- (102) Zhang, X. & Buta, R. 2007, AJ, 133, 2584
- (103)
| Galaxy | Offset | Texp | ||
|---|---|---|---|---|
| 1 | 2 | 3 | 4 | 5 |
| NGC 2523 | NW 17 | 9 x 1000 | 138.1 | 3505.4 18.9 |
| NW 9 | 9 x 1000 | 144.9 | 3498.4 28.6 | |
| 0 | 6 x 1000 | 150.5 | 3496.5 75.8 | |
| SE 17 | 9 x 1000 | 164.9 | 3636.0 24.8 | |
| NGC 4245 | E 17 | 9 x 1000 | 144.2 | 967.4 14.5 |
| 0 | 7 x 1000 + 500 | 152.6 | 928.4 52.9 | |
| W 17 | 9 x 1000 | 163.0 | 917.1 14.9 |
| ParameteraaThe listed photometric parameters are the axis ratio , position angle , radial scale length , bulge fraction , and bar strength . | NGC 2523 | NGC 4245bbParameters are from Laurikainen et al. 2005. |
|---|---|---|
| (disk) | 0.665 0.005 | 0.823 0.011 |
| (disk) | 60.7 1.1 | 174.1 2.2 |
| Sersic index (bulge) | 1.09 | 1.33 |
| (bulge) | 1.0 | 1.0 |
| (disk) | 32.1 | 25.9 |
| 0.07 | 0.20 | |
| 0.55 | 0.18 |