The proper motion of the Arches cluster with Keck Laser-Guide Star Adaptive Optics
Abstract
We present the first measurement of the proper motion of the young, compact Arches cluster near the Galactic center from near-infrared adaptive optics (AO) data taken with the recently commissioned laser-guide star (LGS) at the Keck 10-m telescope. The excellent astrometric accuracy achieved with LGS-AO provides the basis for a detailed comparison with VLT/NAOS-CONICA data taken 4.3 years earlier. Over the 4.3 year baseline, a spatial displacement of the Arches cluster with respect to the field population is measured to be mas, corresponding to a proper motion of mas/yr or km/s at a distance of 8 kpc. In combination with the known line-of-sight velocity of the cluster, we derive a 3D space motion of km/s of the Arches relative to the field. The large proper motion of the Arches cannot be explained with any of the closed orbital families observed in gas clouds in the bar potential of the inner Galaxy, but would be consistent with the Arches being on a transitional trajectory between x1 and x2 orbits. We investigate a cloud-cloud collision as the possible origin for the Arches cluster. The integration of the cluster orbit in the potential of the inner Galaxy suggests that the cluster passes within 10 pc of the supermassive black hole only if its true GC distance is very close to its projected distance. A contribution of young stars from the Arches cluster to the young stellar population in the inner few parsecs of the GC thus appears increasingly unlikely. The measurement of the 3D velocity and orbital analysis provides the first observational evidence that Arches-like clusters do not spiral into the GC. This confirms that no progenitor clusters to the nuclear cluster are observed at the present epoch.
1 Introduction
The Arches cluster is among the very few massive starburst clusters observed in the inner Milky Way. At projected distances below 30 pc from the Galactic center (GC), only two other dense, young clusters are known: the Quintuplet and the central cluster. Obtaining an unbiased sample of cluster members and thus an estimate of the stellar mass function is difficult for the latter two clusters; the central cluster contains a mixed variety of stars having different ages, and the 4 Myr “old” Quintuplet cluster appears already widely dispersed (see, e.g., Fig. 2 in Figer et al. 1999). The compactness of the Arches cluster and its young, uniform age of only Myr (Najarro et al. 2004, Figer et al. 2002) characterize this cluster as a unique target to study the stellar mass function and dynamical properties of clusters forming in the immediate neighbourhood of the center of our Galaxy.
The inner pc of the nuclear region of the Galaxy are a hostile environment for star cluster survival. Clusters like the Arches and Quintuplet are expected to disrupt in the intense tidal field on a time scale of Myr (Kim et al. 1999, Portegies Zwart et al. 2002). The strong influence of external tidal forces on the evolution of these clusters led to the suggestion by Gerhard (2001) that massive, young clusters migrate inwards from tens of parsecs to the inner few parsecs around the black hole. Gerhard suggested that the cores of these clusters might survive tidal disruption and supply the population of young, high-mass stars observed close to the black hole, where conditions are inhospitable to in-situ star formation (Morris 1993, Ghez et al. 2003, 2005). However, dynamical simulations suggest that a cluster mass of is required for a dense core to reach the central parsec within the lifetime of the high-mass stars (Kim & Morris 2003), much more massive than the Arches today with .
The amount of material that was already stripped from the cluster and thus the initial cluster mass depend on its orbit in the GC potential and the true distance of the cluster to the GC. At its projected distance of 26 pc, the Arches could have lost 50% of its initial mass, such that the cluster could have been as massive as initially (Kim et al. 2000). Thus far, both the orbit and the true distance to the GC, , are observationally unconstrained. Kim et al. (2000) and Portegies Zwart et al. (2002) attempted to estimate from N-body simulations of Arches-like clusters moving on circular orbits in a spherically symmetric potential representing the GC tidal field. Both studies compared the surface density profiles of dynamically evolving clusters to the surface density of massive stars observed in the Arches. Despite similar initial conditions (cluster mass, age, Galactic potential), the most likely GC distance ranges from 30-50 pc, favoring 30 pc (Kim et al., 2000), to 50-90 pc, favoring 90 pc (Portegies Zwart et al., 2002). The measurement of the 3-dimensional space motion of the Arches would provide a strong observational constraint on the cluster orbit. An estimate of the true distance from the GC and of the orbital timescale limits the amount of material stripped during the cluster’s lifetime, and thus constrains the initial mass of the Arches and the galactocentric radius where the complete tidal dissolution of the cluster is expected.
In this paper, we present an astrometric comparison of new laser guide star adaptive optics (LGS-AO) observations obtained at Keck with natural guide star (NGS) AO data observed 4.3 years earlier with the Very Large Telescope (VLT). The high spatial resolution and astrometric accuracy of the AO observations allow us to derive the proper motion of the Arches cluster with respect to the field population. In combination with the known line-of-sight velocity, the 3D space motion of the cluster provides the first observational constraints on the cluster orbit.
We present our observations, data reduction and photometric calibration in Sec. 2. The critical step of astrometric matching between the NIRC2 and NACO data sets is explained in Sec. 2.3. The proper motion is derived in Sec. 3, and a discussion of the 3D space motion of the cluster is presented in Sec. 4. The 3D orbit of the cluster in the GC potential is modelled in Sec. 5, followed by our conclusions in Sec. 6.
2 Observations
2.1 Keck/NIRC2
KeckII LGS-AO observations were obtained on 2006 July 18. The NIRC2 narrow camera with a pixel scale of 10 mas/pixel (/pix) was employed to obtain a set of 50 images of the Arches cluster in (m, m). The laser guide probe provided a guide source with mag brightness centered in the field of view of the NIRC2 camera. A foreground giant with mag located from the field center was used as the tip-tilt reference source. The 5 mag brighter LGS – as opposed to the faint tip-tilt reference source previously available as a natural guide star (NGS) – delivered images very close to the diffraction limit of 52 mas at m. These observations exceed the resolution obtained with earlier NGS observations (Stolte et al., 2005) by a factor of 1.5, which facilitates resolving the stellar population in the crowding limited cluster field. To aid reconstruction of bad pixels in NIRC2 and avoid detector persistence from bright sources, the telescope was dithered in a random dither pattern with 3 images taken at each position, with individual integration times of 30s per frame, split into 10 coadds 3s in the filter to avoid saturation of most bright sources. The visual seeing during these observations was , which is worse than average for Mauna Kea conditions, leading to larger variations than expected in AO performance. Thirty-six -band frames displaying the best AO performance were selected, leading to a total exposure time of 18 minutes in . These data form the basis of the proper motion study.
In addition, 15 images in (m, m) were obtained on 2006 May 21 with the same observational setup. The fainter source brightness in allowed for longer integration times of 10s 3 coadds, and a box five dither pattern was used with 3 images taken at each position. Varying AO performance led to the selection of the 9 images displaying core FWHM mas, with a total exposure time of 4.5 minutes. The -band data are used supplementary to the images to reject artefacts from the final catalogue.
The standard imaging reduction steps including flat fielding, sky and dark subtraction, and removal of cosmic ray events are detailed below. The science frames were reduced using flat fields and offset sky frames taken during the same night. Individual bad pixel masks were created from a combination of dark, flat field, and cosmic ray masking of individual exposures. Strehl ratios on pre-selected frames ranged from 0.25 to 0.44 (median 0.34) corresponding to a PSF core FWHM between 52 and 63 mas (median 56 mas). -band Strehls covered 0.15 to 0.19 (median 0.18) with a PSF core FWHM of 58 to 65 mas (median 60 mas). In order to enhance the resolution in the final image, each frame was weighted by the Strehl ratio prior to image combination. The individual bad pixel mask was applied to each frame, and frames were averaged together using the drizzle algorithm (Fruchter & Hook 2002). The combined images display a core FWHM of 53 mas in and 60 mas in . In addition to the deep frame, three auxiliary frames were formed by coadding 12 individual images in each frame. These auxiliary frames were used for a first pass rejection of image and PSF artefacts, as well as for uncertainty estimates.
Stellar positions and photometry were extracted from the final, averaged NIRC2 images using the Starfinder code (Diolaiti et al. 2000). This code has the advantage of constructing the PSF from the image empirically, without the need to assume an analytic function. This is particularly critical for the complex AO PSFs displaying steep kernels with structured haloes and Airy ring patterns. In the crowded stellar field of the Arches, 10 stars were used to create the PSF. The detection threshold was set to 3 above the local background, and a PSF correlation threshold of 0.7 was imposed. The relatively low correlation threshold enables us to include close neighbours in the final photometry file, while higher thresholds tend to omit faint sources embedded in the haloes of bright stars. In order to reject false detections, each star entering the calibrated catalogue was required to be detected in the deep exposure and in all three auxiliary frames. This strict requirement led to the rejection of most PSF and image artefacts. Any remaining PSF artefacts were removed during the final catalogue matching. The calibrated NIRC2 catalogue contained 869 objects in the magnitude range mag on the combined image. Photometric calibration was performed by zeropointing against the NACO photometry presented in Stolte et al. (2005), and the comparison of with yielded no color terms. A detailed photometric analysis of the cluster population will follow in a subsequent paper.
2.2 VLT/NAOS-CONICA
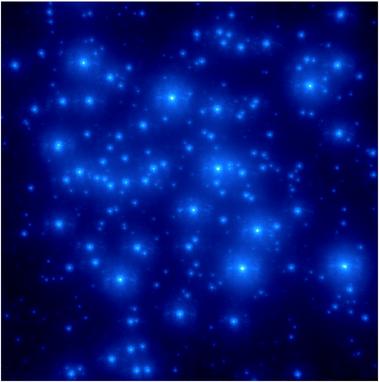
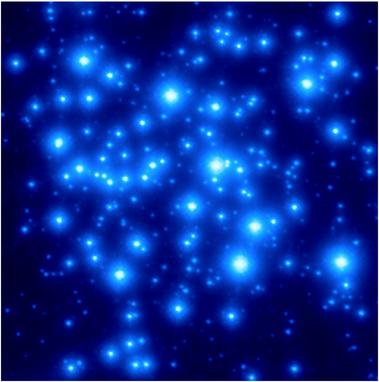
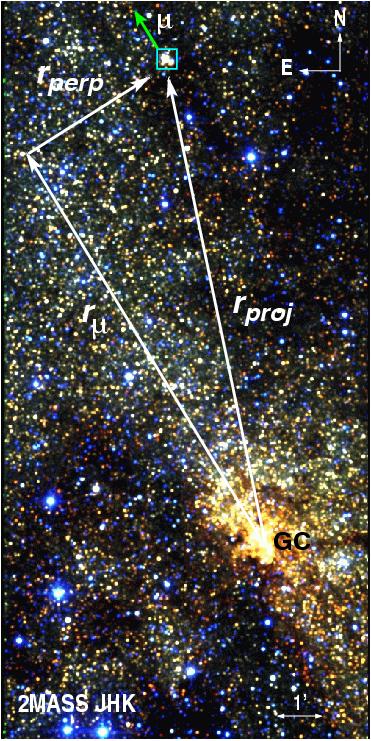
The Keck/NIRC2 astrometric data set was combined with VLT/NACO data taken on 2002 March 31, providing a baseline of 4.3 years for the proper motion study. NACO and images with a total integration time of 14 and 7 min, respectively, were obtained with the medium camera with a platescale of 27 mas/pix. The NACO data were taken with a natural guide star (NGS) on the NAOS optical wavefront sensor. Because of the faintness of the NGS in the Arches field ( mag), the Strehl ratios achieved were 0.20 in and 0.14 in , providing a FWHM resolution of 84 mas in both filters. The merged catalogue of sources detected in both and contains 487 stars in the magnitude range mag, and provides the basis for the proper motion measurement. A comparison between the NIRC2 and NACO images is shown in Fig. 1. For a description of the NACO data and analysis see Stolte et al. (2005).
2.3 Geometric transformation and astrometry
With the aim of measuring the relative motion of stars in the Arches field, the spatial displacement of each star over the 4.3 year baseline is calculated. Bright sources on the combined NIRC2 image provide the reference frame for the proper motion analysis. A geometric transformation to convert NACO pixel positions to the NIRC2 frame was derived using the IRAF geomap task. By deriving the transformation from bright and intermediate sources measured directly on both images, the different optical distortions between NIRC2 and NACO are taken into account within the limitations of the two-dimensional, second-order polynomial fit performed with geomap. The geometric solution is created iteratively by minimizing the x,y residual displacements. The final residual rms deviation was 2 and 0.7 mas in the x and y direction, respectively. In the following analysis, we therefore assume a systematic contribution of 2 mas in the proper motion uncertainty.
The selection of proper motion members was based on matching the NIRC2 source catalogue with the transformed NACO catalogue using a matching radius of 40 mas. This radius provided the detection of most moving sources while avoiding wrong matches with close neighbours in the dense stellar cluster field. In order to exclude artefacts from the complex PSF structure, we require that each source be detected in either the NACO or NIRC2 -band image in addition to both -band images. After blind matching, the matched sources were visually inspected on the NIRC2 and NACO -band images, and 13 sources with merged centroids in NACO due to the lower resolution or located on the edge of the NIRC2 field of view were removed from the matched catalogue, as the biased definition of their stellar centroids affected their apparent motion. The final proper motion catalogue comprises 419 objects.
3 Results
3.1 The relative motion of the Arches to the field
The proper motion of the Arches cluster is derived from the relative motion of the cluster with respect to field stars. This relative motion depends on the geometric transformation between both data sets. As detailed below, the transformation is chosen such that proper motions over the 4.3 yr baseline are measured in the reference frame of the cluster. Before deriving the proper motion of the cluster, this reference frame will be introduced.
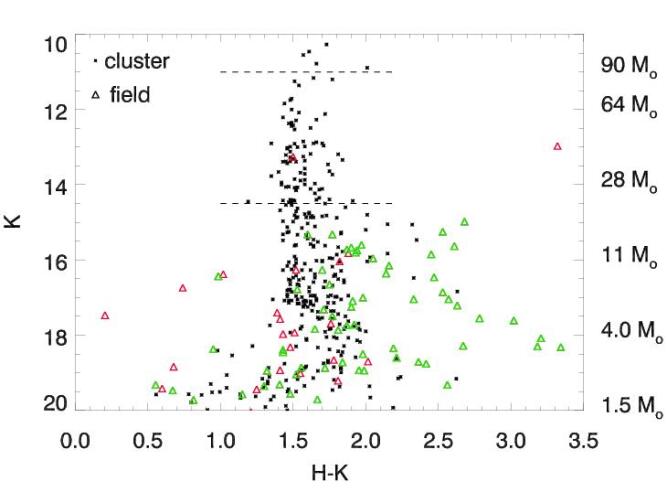
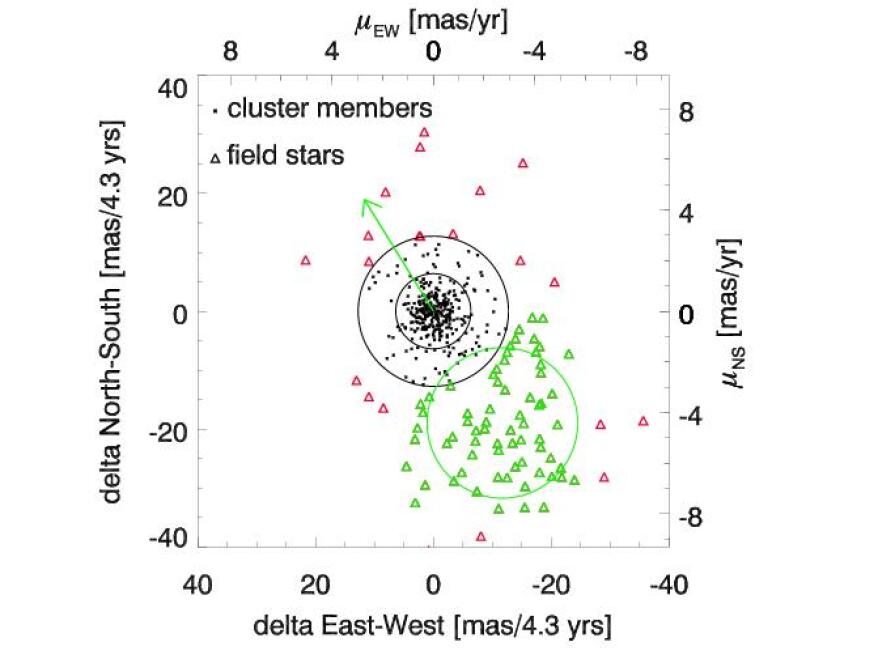
The geometric transformation between NACO and NIRC2 was derived from bright sources in the magnitude range mag. As can be seen in the color-magnitude diagram (CMD, Fig. 2), this regime is composed of stars on the Arches main sequence and thus likely cluster members. By defining the transformation from cluster stars, a cluster reference frame is created in which Arches members cluster around an East-West motion of , and North-South motion , implying that in the cluster reference frame the net spatial displacement of the cluster should be zero. The spatial displacement of stars in the Arches field is shown in East-West and North-South motion in Fig. 3. Two distinct features dominate in this diagram: i) the dense clump of stars clustering around (0,0), which are cluster member candidates in the cluster reference frame, and ii) the scattered population of sources in the lower right quadrant.
The fact that Fig. 3 reveals two distinct populations provides a means of identifying Arches cluster members based on proper motions. The and circles from a gaussian fit to the relative motion distribution centered on zero are enveloping member candidates in Fig. 3, and Arches members are selected with less than mas spatial displacement in 4.3 years, corresponding to a proper motion mas/yr. While cluster candidates are confined to a dense clump with small intrinsic scatter ( mas/yr (rms)), the field population displays twice as large rms scatter ( mas/yr (rms)). This scatter is expected if we observe a mixed population of stars tangentially or radially along their orbits over a large range of distances. Field stars along the line of sight are expected to display a wide range in dynamical properties depending on their orbits. It is therefore surprising that field stars are predominantly found in the South-West quadrant in Fig. 3. This apparent South-West displacement of field stars in the Arches reference frame can most easily be explained by the Arches moving to the North-East with respect to the field. The observed North-East motion of the cluster is consistent with a recent prediction from the X-ray emission of the bow shock created by the Arches during its impact on the nearby cloud (Wang et al., 2006). The median displacement of the field in the cluster reference frame is mas/4.3 years or mas/yr, which translates to a relative motion of the cluster with respect to the field of km/s assuming a distance of 8 kpc. With a position angle (PA) of as measured from North to East, the direction of the proper motion vector is parallel to the Galactic plane (PA) within the uncertainties.
Before employing the proper motion to derive the 3-dimensional space motion of the cluster, we investigate the sources of uncertainty contributing to the proper motion measurement. The quoted accuracy in the proper motion measurement is achieved by the large number of 67 reference field sources contributing to the average relative motion between the cluster and the field. The uncertainties were calculated adding the fixed component from the geometric transformation, 2 mas/4.3 yrs = 0.5 mas/yr, in quadrature to the standard deviation in field star velocities, mas/yr, normalized to the number of field stars, , mas/yr. The uncertainty from the zeropoint defined by the 328 cluster candidates is mas/yr, and therefore negligible. The final uncertainty from random deviations in the relative motion of mas/yr is dominated by the geometric transformation between NACO and NIRC2, which includes residual optical distortion differences and the resolution-dependent uncertainty from fitting the centroid to the light distribution of each star.
In addition, one might consider that the internal velocity distribution may contribute to the rms scatter in cluster candidate motions. The cluster velocity dispersion can be estimated as (Binney & Tremaine 1987, eq. 4-80b), where is the total cluster mass and pc the half-mass radius (Stolte et al., 2002). This yields km/s or 0.2 mas/yr, which is significantly smaller than the rms scatter of 0.73 mas/yr observed in candidate cluster stars. The systematic uncertainty of 2 mas/4.3 yrs or 0.5 mas/yr imposed from the geometric transformation between NACO and NIRC2 presently limits our ability to detect the internal velocity dispersion of the cluster. With a relative astrometric accuracy of 0.3 mas measured between the three NIRC2 auxiliary frames, the internal velocity dispersion can be observed on a timescale of a few years. A second epoch of NIRC2 data will avoid the transformation uncertainty inherited from the different optical distortions and spatial resolution in the NACO and NIRC2 data sets, thereby decreasing the overall uncertainty in the proper motion measurement, and providing the potential to resolve the internal velocity dispersion of the cluster.
3.2 Sources of systematic uncertainty
The random uncertainty derived above dominates the proper motion measurement only in the absence of systematic uncertainties. These uncertainties can arise from the choice of selected field stars, as well as a bias towards field sources on the near side of the bulge. In Fig. 3, the field selection was based on the density of stars in proper motion space. We can investigate the uncertainty in our measurement due to the field sample selection using defined subsamples. As we expect a larger positional uncertainty for fainter stars, the first sample consists of stars brighter than the apparent cluster main sequence cutoff at mag. As bulge stars are predominantly faint, this bright sample consists of 27 sources, and yields km/s.
As a consequence of the high foreground extinction towards the Galactic center, our observations could be biased to stars on the near side of the bulge. Such a bias should be revealed in a proper motion difference between blue and red sources. Thus we define two sets for our second sample: a set blueward of mag, encompassing the cluster main sequence and the bulge red clump, and a very red sample mag with presumed background stars. The cluster proper motion derived from the “blue” field sample of 45 stars becomes km/s, while the red sample of only 22 stars yields km/s. The larger number of stars in the “blue” sample indicates that there is a bias towards stars on the near side of the bulge in the complete sample. The difference of km/s is in excellent agreement with the proper motion difference of stars on the near and far side of the bulge, measured using red clump giants to mas/yr or km/s (Sumi et al., 2003). The higher cluster motion of km/s as measured from the very red sources indicates that the bias acts to decrease the cluster velocity. The absolute proper motion might be closer to the mean between the red and blue sample, km/s, in good agreement with the km/s derived for the full sample. Nevertheless, the lower number of stars in the red sample indicates that sources with high extinctions or large distances, which have higher relative streaming velocities than sources closer to the GC, are predominantly lost. As this problem arises in all proper motion studies toward the GC, the maximum expected velocity for stars on the far side of the bar is not firmly known. This implies that the proper motion measurement remains a lower limit.
A final concern may arise from the sampling of field stars itself. The bias from the field star sample can be estimated by deriving the cluster motion from a random sample of half of the field stars, . In 100 random samples we obtain proper motion values between 195 and 227 km/s, with a mean and standard deviation of km/s, in excellent agreement with the value derived from the full sample above. In summary, we conclude that the only systematic uncertainty in the proper motion might arise from the bias to bulge stars in front of the GC, but the effect is small and the measurements agree very well within the uncertainties. Therefore, we use the full sample of field stars to obtain a conservative lower limit to the proper motion of the cluster in an absolute reference frame, and adjust the uncertainty to account for the possible bias accordingly, km/s.
3.3 The 3D motion of the Arches in the bulge reference frame
In order to derive the absolute motion of the Arches cluster in the Galaxy, we need to understand the field restframe. The CMD (Fig. 2) shows that most of the proper motion selected field stars are faint and red. The clump of field stars at mag is consistent with red clump stars at kpc and mag (, Alves 2000), and the faint population, mag, covers the regime of evolved bulge stars. Sumi et al. (2003) analysed a sample of stars repeatedly observed in OGLE-II fields towards the bulge, and concluded that proper motions of red giants and red clump stars are consistent with zero mean proper motion with respect to the GC. Only blue foreground disk stars display a systematic deviation in mean proper motion from the GC, which is interpreted as the tangential motion of disk stars at 1-2 kpc distance from the Sun. In the NIRC2 field of view, we only observe seven stars significantly bluer ( mag) than the deeply extincted cluster population ( mag, Stolte et al. 2002), so that we can safely rule out significant contamination by disk stars.
Sumi et al. (2003) derived the streaming motion of red clump stars in bulge fields from proper motions, and interprete the observed velocity difference of 57 km/s between sources in front of and behind the GC as the rotation of the galactic bar in the same direction around the GC as the Sun. This streaming motion is consistent with the bar models constructed from CO line-of-sight velocity maps (Binney et al. 1991, Englmaier & Gerhard 1999). In the context of the 3D reference frame, a detection bias towards sources on the near side of the bar causes a systematic loss of stars with proper motions in the opposite direction to the Arches motion (compare to the orbit sketches in Fig. 6). The number counts of 22 very red sources as opposed to 45 blue sources indicate a loss of sources at the far side of the bar. The selective detection of sources in the front of the GC shifts the apparent mean motion of the field stars away from zero in the same direction as the Arches cluster, which, when corrected, increases the cluster velocity with respect to the GC even further. The 3D motion derived from the proper motion sample is therefore a lower limit to the space motion of the Arches with respect to the GC. 111Although we cannot fully exclude the possibility that the cluster is observed against a dense comoving group in the background, it appears very unlikely that the majority of field sources would be part of such a group.
The heliocentric line-of-sight velocity of the Arches cluster was measured spectroscopically to be km/s Figer et al. (2002). Combining the proper motion with the line-of-sight velocity yields the relative 3-dimensional space motion of the Arches, km/s, directed away from the GC to the North-East, and away from the Sun.
4 Discussion and orbit considerations
The measurement of the Arches space velocity allows us to compare the cluster velocity with measured orbital velocities of stars and clouds in the inner Galaxy, with the aim of deriving the first qualitative constraints on the cluster orbit around the GC by considering known orbital families in comparison with the 3D cluster motion. The cluster orbit and, in particular, the GC distance are critical for the formation and dynamical evolution of the cluster in the GC potential, for the amount of tidal mass loss of cluster members along its orbit, and for the potential for inspiral towards the GC.
4.1 Excluding a circular orbit?
Due to the earlier lack of knowledge on the cluster motion and the limited understanding of the inner Galaxy, and in particular the ignoring of the thick nuclear stellar disk between 20 and 200 pc (Launhardt et al. 2002), previous studies of the dynamical evolution and tidal disruption of the Arches in the GC potential assumed for simplicity that the cluster moves on a circular orbit in a spherically symmetric mass distribution (Kim et al. 2000, Portegies Zwart et al. 2002). Without further constraints, a circular orbit in a spherically symmetric potential is the simplest case and most straightforward assumption. From this assumption, the amount of mass loss and the true distance of the Arches from the GC were derived.
In the case of a circular orbit in a spherically symmetric potential, the orbital parameters are determined by the 3D velocity and projected radius vectors. The circular orbit approximation allows us to compare the derived orbital parameters with observations in the inner Galaxy, and to probe whether a circular orbit assumption is valid for the Arches.
In a spherically symmetric potential, the gravitational force only depends on the mass interior to the present galactocentric radius. While the potential in the inner galaxy is not spherically symmetric, this assumption is made in the concept of the enclosed mass vs. radius relation providing the gravitational potential for previous simulations. As shown below, this concept is too simplistic to explain the 3D space motion of the Arches cluster.
For a circular, closed orbit, the absolute distance of the Arches to the GC, , can be derived geometrically, using = 0. A convenient coordinate system can be defined from i) the direction along the proper motion vector , ii) the direction perpendicular to on the plane of the sky, and iii) the direction along the line of sight (see Fig. 4). As the 3D velocity of the cluster is defined by and the line-of-sight velocity, , the velocity component perpendicular to is zero. The circular orbit equation thus becomes
| (1) |
where is the radius vector along the line of sight. With km/s, pc, where is the angle between the projected radius vector, , and the proper motion vector on the plane of the sky, and km/s (Figer et al., 2002), we obtain pc, pointing towards us. The GC distance of the cluster in the circular orbit approximation would then be pc.
As was derived geometrically, no assumption about the enclosed mass was made. The enclosed mass required to obtain a circular, Keplerian orbit with an orbital velocity of km/s at a radius of pc is . However, from the modeled mass distribution in the inner Galaxy, the enclosed mass within pc is Launhardt et al. (2002), where the mass contains both interstellar matter and stars as measured from near to far IR observations with IRAS and COBE/DIRBE. This discrepancy in the inferred enclosed mass provides a first indication that the Arches moves on a non-circular orbit.
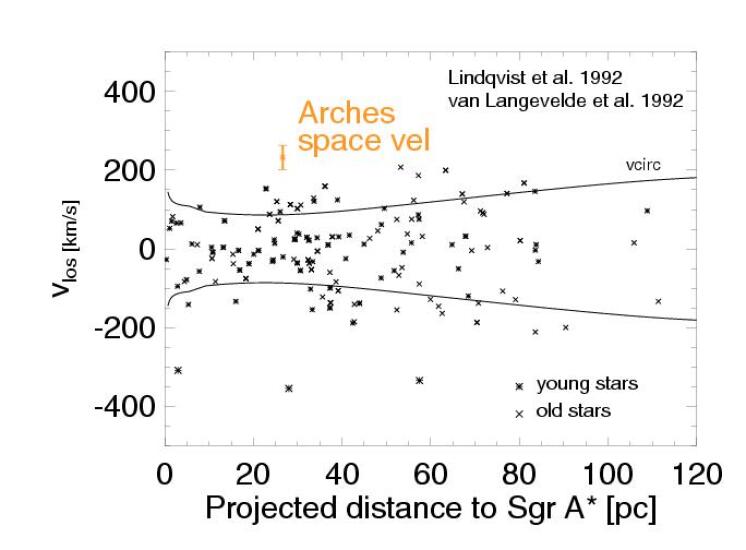
We can further probe the circular orbit approximation by comparing the measured 3D velocity of the cluster with observed and expected velocities in the inner Galaxy. In a sample of circularly orbiting objects along the line of sight, the orbital velocity can be measured as the maximum line-of-sight velocity observed at each projected radius. Following van Langevelde et al. (1992), we reproduce the line-of-sight velocities of a survey of OH/IR stars in the inner bulge conducted by Lindqvist et al. (1992) in Fig. 5, along with the expected maximum circular velocity at each projected radius derived from the enclosed mass determination by Launhardt et al. (2002). The circular velocities envelop most of the line-of-sight velocity measurements of bulge stars in Fig. 5, suggesting that circular motion is a reasonable approximation for stellar orbits in the inner 120 pc. Outliers with significantly larger velocities can be understood as stars on highly elongated orbits.
The current orbital velocity of the Arches, km/s, lies significantly above the orbital velocity of km/s expected for a circular orbit at its projected distance of pc (cf. Fig. 5). The expected increases to 120 km/s at pc, but remains almost a factor of two lower than the space velocity of the cluster. The large space velocity of the Arches places the cluster either at very large galactocentric radii, where the Galactic rotation curve flattens ( kpc), which is inconsistent with the cluster’s suggested interaction with central molecular zone (CMZ) clouds (Lang et al. 2003, Wang et al. 2006), or suggests a non-circular orbit. A non-circular orbit would also explain the overestimated enclosed mass derived above.222Three OH/IR stars with similarly high velocities of km/s are observed between projected radii of 53 to 65 pc. These stars could have been ejected from close binary systems or dense clusters such as the Quintuplet or the Arches itself. While stars in the high source density of the inner Galaxy have short two-body relaxation timescales, a massive cluster is not easily deflected from a regular orbit.
A circular cluster orbit in a spherically symmetric potential is inconsistent with the measured enclosed mass at the radius and with observed circular velocities in the distance range considered for the Arches.
4.2 Relationship to gas cloud orbits:
A scenario for the origin of the Arches
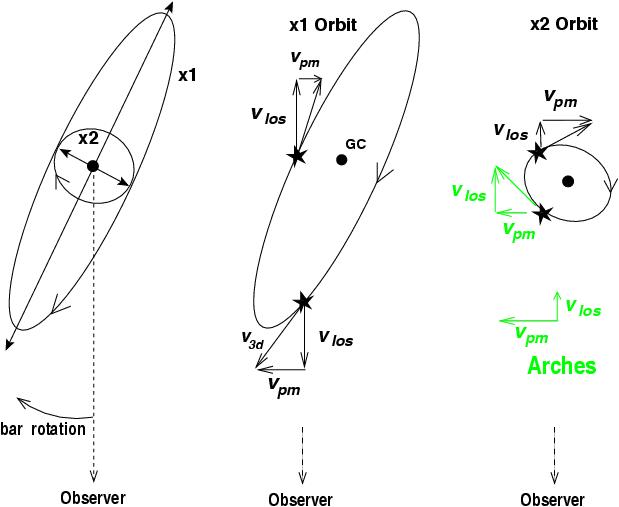
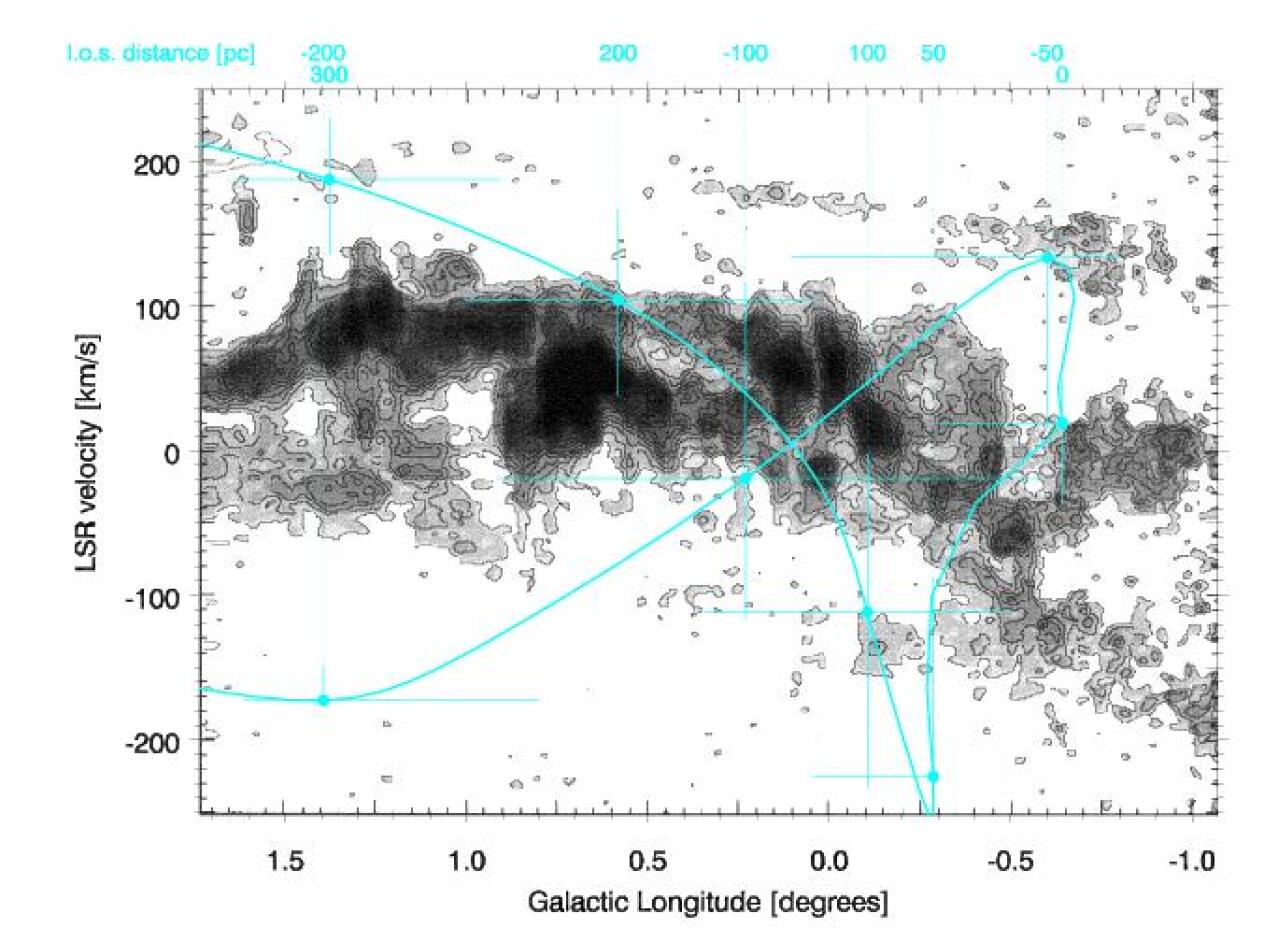
In the central region of the Galaxy, the two-body relaxation time for a cluster with embedded in a medium of stellar density (Launhardt et al., 2002) is on the order of a few years (following Binney & Tremaine 1987, eq. 8-71). With an age of only 2.5 Myr, the cluster velocity should therefore carry the imprint of the motion of its native cloud. A comparison of the cluster space motion with the characteristic motion of gas clouds in the inner Galaxy might shed light on its origin. In the central of the Galaxy, the outer envelop of the CO emission in the longitude, line-of-sight velocity () plane displays a “parallelogram” structure, which is interpreted as the reaction of the gas to a bar potential (Binney et al. 1991, Englmaier & Gerhard 1999). Depending on their distance from the GC, long-lived gas clouds are suspected from these models to move on non-circular, closed orbits in the co-rotating reference frame of the bar, which belong to the x1 orbit family aligned with the major axis of the bar and the x2 orbit family aligned with the bar’s minor axis (see Fig. 6). Cloud motion at large GC radii is dominated by x1 orbits with line-of-sight velocities up to 270 km/s outside ( pc), while inside the corresponding radius x2 orbits are expected to populate the inner spheroid.
Dame et al. (2001) observe line-of-sight velocities of CO gas up to 230 km/s close to . While the Arches velocity would be consistent with the peak velocities observed outside , for objects on x1 orbits at positive longitudes and with positive proper motion (towards increasing l), negative line-of-sight velocities should be observed, which is not the case (Fig. 6). The positive observed for the Arches agrees in sign with x2 orbit simulations, but the high space velocity is inconsistent with the maximum x2 orbital velocity of 120 km/s suggested by the Englmaier & Gerhard bar model. Thus, it appears that the cluster is not on one of these orbital families suggested for gas clouds in the inner Galaxy.
How can the cluster have gained such a high space velocity at such small GC distance? Binney et al. (1991) point out that gas clouds with substantial molecular components are only observed on the innermost x1 orbit ( pc) and the x2 orbits at even smaller radii, but not in the outer bar. They provide the intriguing interpretation that gas clouds on inner x1 orbits may collide with clouds on the outermost x2 orbits, where the cloud density is higher. The subsequent fate of the clouds depends on the impact angle. Close to the x2 apocenter, clouds might merge and lose kinetic energy in the process. In a less direct collision, SPH simulations by Athanassoula (1988, reproduced in Binney et al. 1991, their Fig. 6) suggest that the x1 cloud will be dispersed into the x1-x2 transition zone, and collide with incoming material on the opposite side. In both cases, cloud material will experience shock compression. Binney et al. suggest that the collision causes shock-creation of molecules, and the friction might allow the remnant x1 cloud to shed angular momentum and spiral in toward a stable x2 orbit.
If this scenario holds for sufficiently massive clouds, we can speculate that the x1-x2 collision could trigger a starburst event, which would take place during the inspiral of the shocked cloud toward the region of stable x2 orbits. The emerging stellar cluster would naturally inherit the cloud velocity depending on the point along the x1-x2 orbit transition where the massive stars evaporate the native material. Once the cluster emerged from its native cloud, it is unaffected by collisions with ambient clouds, and can lose energy solely by the slow process of two-body relaxation. At this point, the cluster can sustain a significant velocity component from the higher x1 orbital velocity. This scenario could explain both the apparent orientation of the Arches velocity vectors in agreement with x2 orbits, and the high velocity preserved from the x1 orbit transition.
Although the dynamical properties of the cluster are well explained, this theory has a significant caveat. For the Arches to inherit the high x1 velocity, the x1 cloud would have to be more massive and dense than the x2 cloud, which contradicts the distribution of dense clouds observed in the CMZ today. The present-day clouds on x1/x2 orbits representing the bar potential are measured in CO, which traces gas at average densities , suspected to be too low for stellar fragmentation. The denser components with capable of intense star formation are efficiently detected in the CS transition. While CS is correlated with many of the intense CO peaks (Bally et al., 1988), CS clouds are more confined to the inner parts of the CMZ ( pc) and display maximum line-of-sight velocities km/s. These velocities, if representative of the orbital velocities of dense clouds, are consistent with clouds on x2 orbits, but appear inconsistent with the large orbital velocity measured for the Arches. While the large present-day velocity of the Arches is suggestive of the collision scenario, we need to understand the initial conditions at the time of the starburst to constrain whether dense clouds could have been triggered to form the cluster, and in particular whether a large orbital velocity at the present projected position can be acquired from these initial conditions. For this purpose, we perform a backwards integration of the cluster motion in the observed, non-spherically symmetric extended mass distribution in the inner Galaxy.
5 The Arches motion in the GC potential
The knowledge of the 3-dimensional space motion of the cluster and the projected distance from the GC allow us to investigate possible orbits of the cluster in the potential of the inner Galaxy depending on the cluster’s line-of-sight distance. The circular orbit considerations in Sec. 4 suggest that motion on a circular orbit in a spherically symmetric potential cannot explain the high 3D velocity of the cluster. As the stellar density in the inner Galaxy changes dramatically with radius, we exploit the knowledge of the existing density of matter to approximate a more realistic gravitational potential. The cluster is evolved in this potential to yield constraints on its present location with respect to the GC, the possible position on its orbit, and its origin.333We use a leap-frog integrator originally developed by Joshua Barnes for a single logarithmic potential, which was extensively adapted to represent the gravitational components in the inner Galaxy. The basic version of the orbit integrator is publicly available from his lecture notes (see http://www.ifa.hawaii.edu/ barnes/ for more information).
5.1 Modelling the potential in the inner Galaxy
Three components are suspected to contribute to the mass distribution inside 200 pc, namely, the central black hole, the nuclear stellar cluster, and the thick nuclear disk comprised of both gas and stars. From their observed mid- to far-infrared luminosity distributions, Launhardt et al. (2002) describe the density profiles of the nuclear stellar cluster as a spherically symmetric power-law decline, and the nuclear disk as a combination of two exponentials with additional flattening in the latitude direction. Beyond 200 pc, the observed nuclear disk declines rapidly and the bar becomes dominant according to the observations. In the central few parsecs, the black hole is also an important contributor to the potential, and is added as a point mass with .
As the only free variable of the cluster velocity and space coordinates is the distance along the line of sight, we define a sky coordinate system from the observer’s perspective with the projected distance from the GC along the Galactic plane, the line-of-sight distance, and the height above the Galactic plane. The line-of-sight distance is defined such that zero corresponds to the distance of the GC from the sun. A positive line-of-sight distance implies the present cluster location is behind the GC. Because the proper motion vector is oriented parallel to the Galactic plane, this coordinate system is similar to the geometric system defined in Sec. 4 to estimate the circular orbit, where the axis is parallel to the proper motion vector, and the coordinate represents the unconstrained radius vector along the line of sight.
As the bar is inclined by towards positive longitude with respect to the line of sight (Rattenbury et al., 2007)444The bar rotation angle changes with the pattern speed of srd/Gyr (Bissantz et al., 2003), implying a rotation of in 2.5 Myr. On prograde orbits, the travel time of the cluster through the co-rotating bar potential becomes longer, while the travel time through the bar is shortened in retrograde orbits, causing orbits at large GC distances ( pc) to rotate in the same direction as the bar with respect to the line of sight. As the effect during the cluster lifetime is small and the most likely location of the cluster is inside 200 pc, we do not account for bar rotation in this model., while all other components are axisymmetric, we convert the initial cluster position and velocity into the bar system, with along the major axis and along the minor axis of the bar, while the height above the plane, , is not modified. After evolving the cluster motion in the combined potential, the output positions, velocities, and accelerations are converted back to the sky coordinate system.
In order to calculate the combined gravitational potential at every position, we use logarithmic potentials with different stretching parameters to represent these components. The basic form of the adopted logarithmic potential is
| (2) |
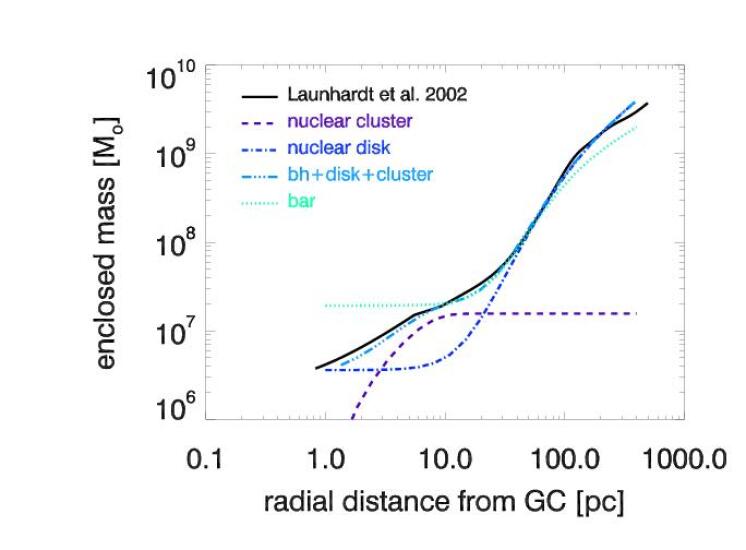
where represents the velocity on the flattened portion of the rotation curve at very large radii, and the core radius. Both constants are free parameters in the fit to the observed mass distribution. The stretching parameters , , and describe the flattening of the potential along the , and axis, respectively, with respect to a spherically symmetric potential where . For the axisymmetric components representing the central cluster and thick disk this definition implies . In order to derive and for each component, we spatially integrate the modeled density distribution corresponding to the logarithmic nuclear disk and cluster potentials to fit the observed enclosed mass in the central 200 pc (Launhardt et al. 2002, their Fig. 14). Additional constraints are given by the requirement that the acceleration, i.e., the first spatial derivatives of the potential, be continuous. The best mass fit under these conditions is shown in Fig. 7, and the adopted parameters for each component are summarized in Tab. 1.
In our adopted model, the nuclear cluster is the dominant mass component between 2 and 7 pc, beyond which it is smoothly truncated to a constant mass, and the thick nuclear disk becomes the dominant component beyond 20 pc, while both contribute significantly to the mass at intermediate radii. The sum of all three components, including the black hole, provides a very good approximation to the best available estimate of the enclosed mass in the inner 200 pc of the Galaxy.
The transition between the inner components and the bar
potential poses the largest problem for computational continuity. In order to ensure that
the acceleration vary smoothly and the energy be conserved along the orbit, the disk
is transformed into an elongated bar potential in the transition zone between 150 and 250 pc.
Technically, a smooth variation of the potential is achieved by multiplying a sigmoid function
of the form to the stretching parameters.
Here, is the difference between the radial distance from the GC
and the midpoint of the transition region, pc, and
is a scaling factor that defines the steepness of the transition. The sigmoid function
is 0 for radii significantly below the transition radius , and 1 for radii
significantly above this radius. The scaling factor is chosen to be , which ensures
a gentle transition over the full range of radii, pc.
For a smooth transition between the nuclear disk and the bar potential,
we therefore modify the x-stretching and z-stretching parameters from the axisymmetric disk with
and to become the elongation of the bar,
(Binney et al. 1991)555Binney et al. 1991 derived an elongation of 0.75 by modeling line-of-sight velocities of
gas clouds in the inner Galaxy. More recent determinations of the bar potential
from red clump stars suggest a significantly stronger bar elongation with a
stretching factor of (Bissantz & Gerhard 2002, Rattenbury et al. 2007).
The minimum stretching parameter allowed in the analytic density solution
of a logarithmic potential
is 0.71 to ensure a positive density at all positions. A more realistic, elongated bar
potential requires the full numerical integration of the density distribution to obtain
the cluster orbit, which is beyond the scope of this paper.
We therefore adopt the parameter derived from cloud velocities. This choice only affects
cluster orbits beyond pc., as follows
while b remains 1.0 in the bar reference frame. At any given position, the local
conversion factor between the disk and the bar is taken into account in the calculation
of the potential and the acceleration, and the subsequently derived velocity and
position vector. Beyond ensuring mathematical continuity, the smooth transformation of
the thick disk into the bar can be interpreted as one continuous
potential in the inner Galaxy, which is known to be disk-like in the central region and
bar-like at larger radii, while the exact shape of the potential combining the two
components is unknown.
5.2 Constraints on the cluster orbit
The family of orbits of the Arches cluster was calculated over a range of line-of-sight distances to the GC from -500 to 500 pc. The absolute distance is not well constrained, even if formation scenarios for GC clusters suggest the cluster to be within the inner 200 pc. The most stringent evidence for a location close to the GC of the Arches are i) the mean foreground extinction of mag, which is consistent with the line-of-sight extinction towards the GC (Nagata et al. 1995, Cotera et al. 1996), and ii) the suggested interaction of the cluster with clouds in the central molecular zone in the inner pc of the Galaxy (Wang et al. 2006, Lang et al. 2003). We note that i) provides only a weak constraint on the Arches distance due to the strong spatial variability of the extinction observed in the GC environment. For example, in the central parsec of the nuclear stellar cluster, extinction values between mag are measured (Schoedel et al. 2007). We thus decided to cover the largest plausible distance range taking into account these constraints.
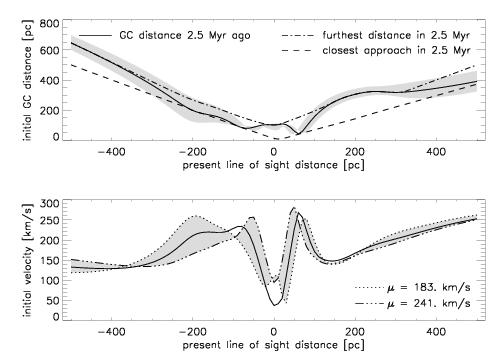
Orbits were calculated in steps of 10 pc along the line of sight both forwards and backwards in time. Backwards orbits are considered over the 2.5 Myr since the formation of the cluster to constrain possible initial conditions. As most of the allowed cluster orbits in the asymmetric potential are not closed, we define one orbit as a change in position angle of . In the following discussion, we will refer to parameters originating 2.5 Myr ago as initial conditions assumed to be close to the time of cluster formation, and to parameters projected from the cluster’s present position along the first full orbit into the future as the next orbit. The results are presented in Figs. 8-11 and Tabs. 2, 3.
The uncertainty in the orbital parameters was estimated with two modified orbital simulations, in addition to the standard model represented in Tab. 1. In order to probe the effects of the shape of the potential, one set of orbits was simulated in a more spherical potential, with for the bar and for the disk. Note that our standard model is the flattest logarithmic potential available without obtaining negative densities in the central region. In the modified potential, the apocenter and pericenter distances, minimum and maximum velocities along the initial and next orbit, as well as the period, were only marginally different from the standard model. We thus do not show the results here, as they are indistinguishable from the parameters shown in Figs. 8-11. In a second test, the cluster proper motion, the largest velocity component contributing most of the uncertainty in the cluster motion, was modified to km/s, from 183 km/s to 241 km/s. The largest deviation in both apocenter/pericenter distances and orbital velocities occurs if the cluster’s present line-of-sight distance is larger than 200 pc. In general, the orbital characteristics are very similar when a larger or smaller present-day proper motion is assumed. These test cases confirm that the derived orbits are not very sensitive to details in the logarithmic potential or the uncertainties in the cluster velocity.
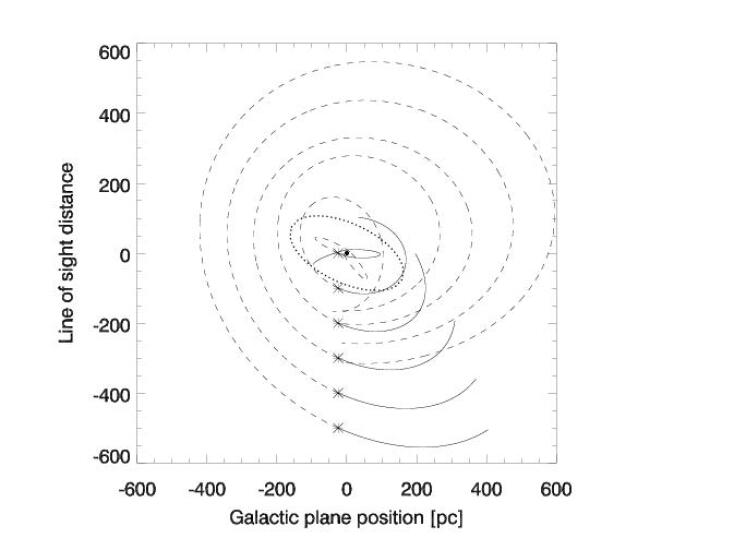
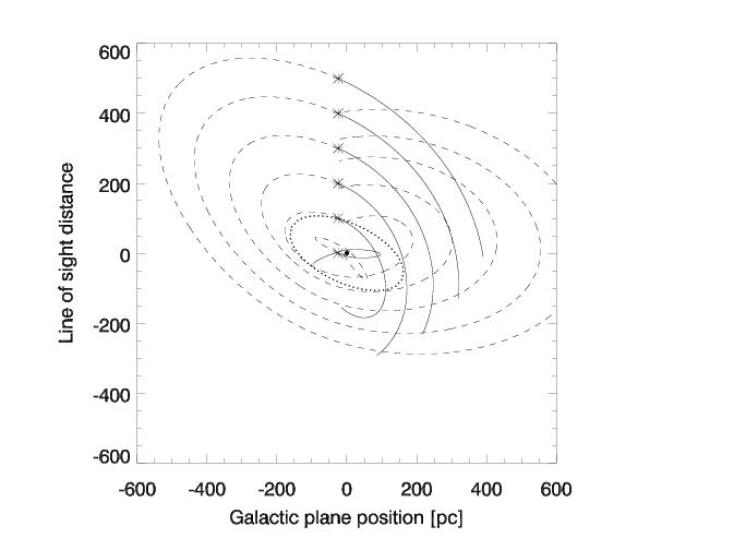
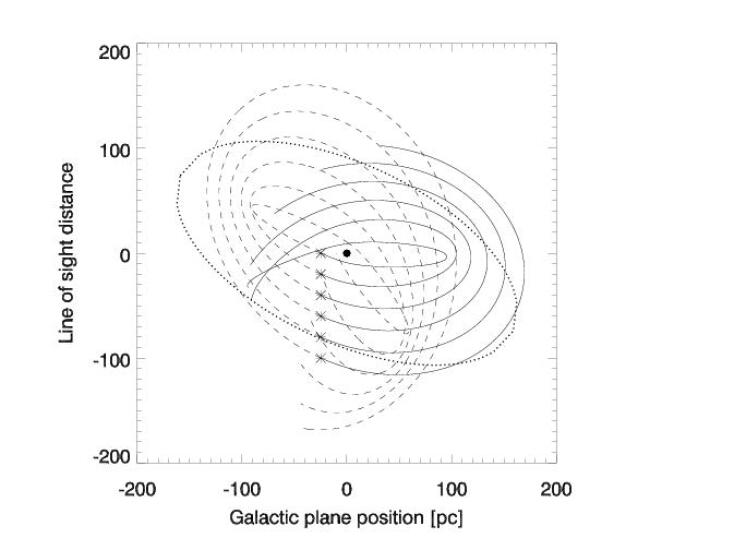
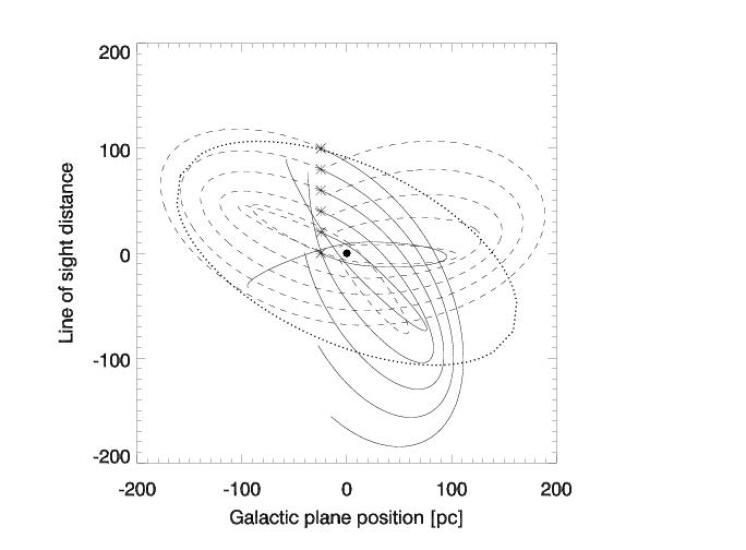
Sample orbits of the cluster in the Galactic plane are shown in Fig. 8. Only the motion in the plane is shown, which is superposed upon a small oscillation of less than 50 pc above and below the plane. For clarity, orbits originating from a cluster position in front of the GC (left panels) are shown separately from present-day positions behind the GC (right panels). It is noteworthy that, due to the positive velocity along the line of sight, all orbits where the cluster is presently behind the GC are retrograde to the general motion of stars and gas clouds in the bar potential, and all orbits where the cluster is presently in front of the GC are prograde. If the cluster formed from a cloud on a prograde orbit, it has to be located in front of the GC today. For all present-day locations inside pc, the high velocity suggests that the cluster recently passed the pericenter of its orbit and now moves towards apocenter.
The approximate shape and location of the outermost x2 orbit as suggested by the recent bar model of Bissantz et al. (2003) is shown as a dotted ellipse in Fig. 6 (top panels). For a cluster location in front of the GC today, a line-of-sight distance of 100-200 pc is most consistent with a formation locus near the outermost x2 orbit as suggested by x1-x2 cloud collision scenarios. Such a formation scenario is less likely for orbits where the cluster is found behind the GC at present. At line-of-sight distances larger than 200 pc, the cluster origin seems unrelated to the x1-x2 transition zone. Triggered cluster formation from dispersed x1 clouds entering the x2 orbital zone is also feasible if the cluster is inside the inner 100 pc of the Galaxy, both for line-of-sight distances in front of and behind the GC. Although the direct comparison of the cluster formation locus and the outermost x2 orbit is complicated by the uncertainty of Myr in the cluster age and thus its exact origin, as well as by the extent of the outermost x2 orbit populated by dense clouds and the uncertainty in the bar orientation angle, the suggested scenarios support the origin of the Arches inside the central 200 pc.
The initial conditions of the molecular cloud at the time when the starburst occured Myr ago are depicted in Fig. 9. The general trend suggests that the distance of closest and furthest approach to the GC in the past 2.5 Myr both scale linearly with the present-day distance of the cluster from the GC. The asymmetries originate from the passage through the inclined bar potential. When the cluster is presently located in front of the GC, it approaches the bar and its path was not strongly influenced by the bar potential in the past 2.5 Myr. If, on the other hand, the cluster is located behind the GC, it had to pass through the bar recently and experienced the increased gravitational forces from the central bar potential. In the latter case, the Arches is now moving away from the major axis of the bar and will not encounter the region of highest density in the bar in the near future. The absolute minimum of the distance to the GC occurs when the Arches is on a radial orbit. Given the orientation of the measured velocity vector, the Arches would have to be at a line-of-sight distance of about 20 pc behind the GC today to be on a radial orbit. On nearly radial orbits, the Arches would have come closer than 10 pc to the GC in the past, thereby likely suffering intense tidal stripping. Such tidal stripping should be detectable in a strong tail of tidal debris distributed along the cluster orbit. Once stars are not bound to the cluster potential anymore, the relevant two-body relaxation time shrinks to the stellar two-body relaxation time of yr in the nuclear cluster. One might therefore expect that tidally stripped stars suffer dynamical interactions with nuclear cluster sources, which may lead to a rapid dispersal of the tidal tail during future passages through the nuclear cluster. Kim & Morris (2003) simulate the dispersal of a cluster with an initial core density of starting at 30 pc on a highly elongated orbit. Such a cluster can deposit at most 5-10% of its stellar population at radii pc inside the nuclear cluster, and practically no stars in the central parsec. Thus, even if the Arches is on a radial orbit, we do not expect to find Arches stars near the supermassive black hole (SMBH).
Of all orbits, the only ones which can bring the cluster into the inner 10 pc of the GC in the past 2.5 Myr, require a present-day GC distance of pc, very close to its observed projected distance. Any larger distance suggests that the estimated total stellar mass of (Stolte et al., 2002) is very close to the initial cluster mass. As inspiraling cluster models require initial masses of from a distance of 30 pc (Kim & Morris 2003), the orbital analysis observationally confirms the numerical prediction (Kim et al. 2000) that the initial mass of the Arches was never substantial enough for inspiral into the central few parsecs.
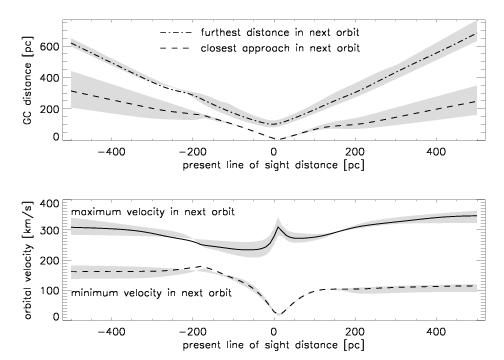
Characteristics of the projected future orbit of the Arches are shown in Fig. 10. The top panel shows the distance of closest and furthest approach, suggesting that, regardless of its origin, the cluster can approach the GC to within 200 pc during the next few Myr. The approximately linear dependence of closest approach upon present line-of-sight distance implies that without energy loss, the cluster cannot get much closer to the black hole during the next orbit than at its present position. The only exception is the innermost orbit with , where the cluster has passed beyond pericenter and will reach a closer pericenter position only a few pc from the SMBH after half a revolution. The bottom panel in Fig. 10 displays the minimum and maximum velocity during the next orbit. Both the minimum GC distance and the maximum velocity show pronounced extrema at pc, where the cluster follows an almost radial trajectory towards and away from the GC. The spike in the maximum velocity curve corresponds to the point of closest approach, where the cluster passes the black hole within a few parsecs.
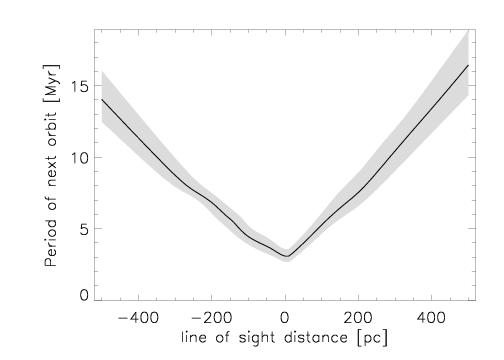
The projected orbit into the immediate future of the cluster provides additional clues on the likelihood of cluster survival. Fig. 11 shows the period of the next orbit. If the cluster presently resides in the inner 100 pc, it will have completed about one orbit in its lifetime (see also Fig. 8, lower panels). At larger GC distances, the section of the orbit covered becomes accordingly smaller (see also Fig. 8, upper panels). At line-of-sight distances pc, the cluster remains at distances 100 pc during the next orbit if it is presently located in front of the GC, and at 65 pc if it is located behind the GC, suggesting that tidal forces will only intensely influence the cluster if it is found to be inside the inner 100 pc. This ambiguity shows the need for a precise distance measurement to the Arches cluster.
At a present-day line-of-sight distance of -10 pc, the mean distance to the GC on the next orbit is about 70 pc, only marginally higher than the 62 pc estimated from the circular orbit approximation. Nevertheless, the orbital period of 3.2 Myr is twice as long as the 1.6 Myr estimated for a circular orbit in a spherically symmetric potential from the parameters derived in Sec. 4, showing the need to account for a realistic potential in the inner Galaxy. At line-of-sight distances of 300 pc and more, the cluster needs about 15 Myr to complete one orbit.
In summary, the Arches cluster has completed at most one orbit during its lifetime, and can pass through the inner 10 pc only if the cluster’s galactocentric radius is very close to its projected distance of 26 pc. These constraints imply that the Arches cluster cannot deposit young stars into the GC, supporting the prediction from N-body simulations by Kim & Morris (2003) that the dense cores of clusters at large projected radii ( pc) are unlikely to reach the central parsec even on highly elongated orbits. The orbital analysis incorporating the high orbital motion of the cluster thus provides the first observational evidence that Arches-like clusters are neither progenitors of the nuclear cluster, nor contribute significantly to the young population in the central parsec.
5.3 Comparison with dense clouds in the CMZ
As pointed out at the end of Sec. 4.2, the dense, massive, molecular clouds in the CMZ are found inside 200 pc with moderate velocities of up to 120 km/s. With knowledge of the cluster’s initial conditions, the (, ) location of the native clouds of the Arches at the time of its birth can be entered into the CS map of dense molecular gas observed in the GC today (Fig. 12, see Fig. 2 in Tsuboi et al. 1999). Error bars allow for an age uncertainty of Myr for the Arches (Najarro et al., 2004).
Assuming that the spatial distribution of clouds 2-3 Myr ago was similar to the CMZ observed today,666The maximum x2 line-of-sight velocity does not change strongly with the rotation of the bar. See Binney et al. 1991 for effects of changes in the inclination angle on the (, ) diagram. the extrapolated initial conditions for the Arches cluster coincide with the location of dense, massive clouds (, Miyazaki & Tsuboi 2000) for most of the line-of-sight distances. Large line-of-sight distances above 200 pc in front of or behind the GC appear less likely because of the expected high initial velocities, km/s, significantly larger than the observed cloud velocities, km/s. At present-day line-of-sight distances larger than 300 pc from the GC, the orbital analysis suggests that initial velocities would have to be km/s, which is unusually large for a star-forming cloud in the CMZ. At small radii, the initial velocities depend strongly on the present age. In the inner 100 pc, essentially all initial velocities are possible, indicating that the initial velocity is not well constrained at small GC distances. In summary, the comparison with the space-velocity distribution of dense, massive clouds in the CMZ indicates a preferred formation locus inside the inner 200 pc for the Arches. The possible orbital paths of the cluster suggest that the Arches is in this case also within pc of the GC today (see Fig. 9).
6 Summary and conclusions
We measure the proper motion of the Arches cluster with respect to the surrounding field to be km/s. Combination with the line-of-sight velocity yields the 3D space motion of the cluster relative to bulge stars, km/s. The high orbital velocity is inconsistent with a circular orbit in a spherically symmetric GC potential.
In order to constrain the orbit, we evolve the cluster in a more realistic potential following the observed mass distribution in the inner Galaxy. We obtain the cluster’s initial position and velocity as a function of its present-day line-of-sight distance. Comparison with CS observations suggests that the initial position and line-of-sight velocity of the Arches coincide with x2 orbits of dense and massive (, Miyazaki & Tsuboi 2000) molecular clouds if the cluster formed inside pc, in which case it should still reside within 200 pc today. The high orbital velocity contradicts the recently suggested formation of the Arches as a rejuvenated globular cluster (Lin & Murray 2007), as this scenario requires a small relative motion of the cluster with respect to GC clouds for an extended period of time.
In the asymmetric potential of the inner Galaxy, the Arches completed at most one orbit during its lifetime, and came into the central 10 pc only if it is presently located closer than 33 pc from the GC, close to its projected distance. These constraints restrict the amount of material possibly tidally stripped from the cluster, and render it highly unlikely that star clusters with Arches properties suffer sufficient energy loss to migrate inwards during the lifetime of the massive stars and contribute to the young population in the central parsec of the GC. This implies that with the Arches and Quintuplet clusters we are not observing progenitors to the GC comoving groups, providing observational confirmation of inspiral simulations (Gerhard 2001, Kim & Morris 2003). This supports the origin of the nuclear cluster from a substantially more massive cluster at small radii a few million years ago, or via in-situ star formation in the immediate GC environment.
Given the young age of the cluster and its long orbital relaxation timescale in the inner Galaxy, the large space velocity should be inherited from the natal cloud. When comparing the cluster orbital motion with line-of-sight velocities of gas clouds in the inner Galaxy using models of orbits in the dominating bar potential, we find that the 3D cluster motion is inconsistent with the closed x1 and x2 orbits suggested for gas clouds.
Although ample molecular material exists in the inner 200 pc which could harbour the formation of clusters like the Arches, the dense, massive clouds have maximum line-of-sight velocities below 120 km/s, consistent with x2 orbital velocities, but significantly lower than the present-day orbital velocity of the cluster. In the standard cloud fragmentation scenario, a dense, massive cloud must have existed on a high-velocity orbit 2.5 Myr ago to generate the cluster. In addition, if a significant fraction of the dense clouds on x2 orbits would form starbursts, more clusters like the Arches or Quintuplet should be observed. The low number of clusters in comparison to clouds on x2 orbits and the high proper motion of the Arches indicate that the starburst event that could give rise to a massive compact cluster might have been triggered by a cloud-cloud collision.
Intense cloud-cluster interaction is observed from the X-ray bow shock of the Arches with its ambient medium by Wang et al. (2006), who suggest that a cloud-cloud collision could also have triggered the formation of the cluster. Following Binney et al. (1991), the starburst could have been triggered while the native cloud of the Arches collided on the boundary between x1 and x2 orbits in the inner bar, or from dispersed cloud material crossing the x1-x2 transition region. The backwards integration of the cluster orbit is consistent with this formation locus if the cluster resides in the inner 200 pc. However, for the Arches to inherit the large orbital velocity from an x1 cloud, this model requires a massive, high-density cloud orbiting on an x1 orbit 2.5 Myr ago, while clouds sufficiently dense to be triggered into an intense starburst event are only observed in the x2 orbital zone today. Alternatively, a collision with an infalling high-velocity cloud (e.g., Crawford et al. 2002) could also trigger star formation and propel the cluster on a highly eccentric orbit. The fact that the Arches moves predominantly parallel to the Galactic plane and has a vertical velocity of only km/s indicates that the cluster did not originate from a collision with a vertically infalling cloud. If both the Arches (2.5 Myr ago) and Quintuplet (4 Myr ago), as well as Sgr B2 were triggered by cloud collisions, this would indicate a substantial cloud collision in the inner pc approximately every 2 Myr.
A cloud collision was suggested as the trigger for massive star formation in Sgr B2 by Hasegawa et al. (1994), who interpret the velocity structure observed in 13CO as a dense clump colliding with a massive molecular cloud of lower density. These authors investigate two scenarios of cloud collisions near the Galactic center, i) a collision between two CMZ clouds, one of which moves on an elongated orbit in the bar, and ii) an infalling cloud originating above the Galactic plane. The first scenario can originate from a cloud on an x1 orbit moving into higher density clouds on x2 orbits, as suggested above. However, Hasegawa et al. (1994) crudely estimate the rate for such collisions to be as low as one collision per 200 Myr, which could not explain the occurence of the Arches, Quintuplet, and Sgr B2 at the same time. These authors point out that the rate of infalling clouds is not well constrained, and they do not provide an estimate for the second scenario. Bally et al. (1988) identify a low-density molecular structure that is inclined by up to out of the Galactic plane, and point out that material on such inclined orbits has to cross the CMZ clouds in the plane twice along one orbital path, leaving ample opportunity for cloud-cloud interactions. Alternatively, the Arches could have an exceptionally high velocity, and might have formed in a different mode than its neighbours. Currently, neither the collision rate nor the spontaneous starburst rate in the GC are well constrained. The observations of 3D space motions of the neighboring clusters will shed additional light on their origin.
Our measurement of the cluster motion will constrain dynamical evolution models in a realistic bar and nuclear cusp potential including energy loss along the orbit, which is the required next step to quantify the tidal mass loss of the cluster. Finally, the proper motion selection of cluster members provides us with a powerful tool to remove the field contamination, and derive the tidal structure and unbiased stellar mass function of the Arches cluster, which will be discussed in a forthcoming paper.
References
- Alves (2000) Alves, D. R. 2000, ApJ, 539, 732
- Athanassoula (1988) Athanassoula, E., 1988, Proceedings of the Joint Varenna-Abastumni International School & Workshop on Plasma Physics, ESA SP-285 (Paris), 341
- Bally et al. (1988) Bally, J., Stark, A. A., Wilson, R. W., Henkel, C. 1988, ApJ, 324, 223
- Binney & Tremaine (1987) Binney, J., Tremaine, S. 1987, Galactic Dynamics (Princeton University Press), pp. 214, 514
- Binney et al. (1991) Binney, J., Gerhard, O. E., Stark, A. A., et al. 1991, MNRAS, 252, 210
- Bissantz & Gerhard (2002) Bissantz, N., Gerhard, O. 2002, MNRAS, 330, 591
- Bissantz et al. (2003) Bissantz, N., Englmaier, P., Gerhard, O. 2003, MNRAS, 340, 949
- Cotera et al. (1996) Cotera, A. S., Erickson, E. F., Colgan, S. W. J. 1996, ApJ, 461, 750
- Crawford et al. (2002) Crawford, I. A., Lallement, R., Price, R. J., et al. 2002, MNRAS, 337, 720
- Dame et al. (2001) Dame, T. M, Hartmann, D., Thadeus, P. 2001, ApJ, 547, 792
- Diolaiti et al. (2000) Diolaiti, E.; Bendinelli, O.; Bonaccini, D., et al. 2000, A&AS, 147, 335
- Englmaier & Gerhard (1999) Englmaier, P., Gerhard, O 1999, 304, 512
- Figer et al. (1999) Figer, D. F., Kim, S. S., Morris, M., et al. 1999, ApJ, 525, 750
- Figer et al. (2002) Figer, D. F., Najarro, F., Gilmore, D., et al. 2002, ApJ, 581, 258
- (15) Fruchter, A. S., Hook, R. N. 2002, PASP, 114, 144
- Gerhard (2001) Gerhard, O. 2001, ApJL, 546, 39
- Ghez et al. (2003) Ghez, A. M., Duchêne, G., Matthews, K., et al. 2003, ApJ, 586, 127
- Ghez et al. (2005) Ghez, A. M., Salim, S., Hornstein, S. D., et al. 2005, ApJ, 620, 744
- Hasegawa et al. (1994) Hasegawa, T., Fumio, S., Whiteoak, J. B., Miyawaki, R. 1994, ApJL, 429, 77
- Kim et al. (1999) Kim, S. S., Morris, M., Lee, H. M. 1999, ApJ, 525, 228
- Kim et al. (2000) Kim, S. S., Figer, D. F., Lee, H. M., Morris, M. 2000, ApJ, 545, 301
- Kim & Morris (2003) Kim, S. S., Morris, M. 2003, ApJ, 597, 312
- Lang et al. (2003) Lang, C. C., Cyganowski, C., Goss, W. M., Zhao, J.-H. 2003, ANS, 324, 1
- Launhardt et al. (2002) Launhardt, R., Zylka, R., Mezger, P. G. 2002, A&A, 384, 112
- Lejeune & Schaerer (2001) Lejeune, T., Schaerer, D. 2001, A&A, 366, 538
- Lin & Murray (2007) Lin, D. N. C., Murray, S. D. 2007, ApJ, submitted, astro-ph/0703807
- Lindqvist et al. (1992) Lindqvist, M, Winnberg, A., Habing, H.J., Matthews, H.E. 1992, A&A, 92, 43
- Miyazaki & Tsuboi (2000) Miyazaki, A., Tsuboi, M. 2000, ApJ, 536, 357
- Morris (1993) Morris, M. 1993, ApJ, 40, 496
- Nagata et al. (1995) Nagata, T., Woodward, C. E., Shure, M., Kobayashi, N. 1995, AJ, 109, 1676
- Najarro et al. (2004) Najarro, F., Figer, D. F., Hillier, D. J., Kudritzki, R. P. 2004, ApJL, 611, 105
- Portegies Zwart et al. (2002) Portegies Zwart, S. F., Makino, J., McMillan, S. L., Hut, P. 2002, ApJ, 565, 265
- Rattenbury et al. (2007) Rattenbury, N. J., Mao, S., Sumi, T., Smith, M. C. 2007, NNRAS, in press, astro-ph/0704.1614
- Schoedel et al. (2007) Schoedel, R., Eckhard, A., Alexander, T., et al. 2007, A&A, in press, astro-ph/0703178
- Stolte et al. (2002) Stolte, A., Grebel, E. K., Brandner, W., Figer, D. F. 2002, A&A, 394, 459
- Stolte et al. (2005) Stolte, A., Brandner, W., Grebel, E. K., Lenzen, R., Lagrange, A.-M. 2005, ApJL, 628, 113
- Sumi et al. (2003) Sumi, T., Eyer, L., Woźniak, P. R. 2003, MNRAS, 340, 1346
- Tsuboi et al. (1999) Tsuboi, M., Handa, T., Ukita, N. 1999, ApJS, 120, 1
- vanLangevelde et al. (1992) van Langevelde, H. J., Brown, A. G. A., Lindqvist, M., et al. 1992, A&AL, 261, 17
- Wang et al. (2006) Wang, D. Q., Dong, H., Lang, C. 2006, MNRAS, in press, astro-ph/0606282
| potential | a | b | c | ||
|---|---|---|---|---|---|
| pc | km/s | ||||
| nuclear stellar cluster | 1.0 | 1.0 | 1.0 | 2.0 | 98.6 |
| nuclear stellar disk | 1.0 | 1.0 | 0.71 | 90. | 190. |
| bar | 0.75 | 1.0 | 0.75 | 90. | 190. |
| init | init | min | max | |
|---|---|---|---|---|
| pc | pc | km/s | pc | pc |
| -500. | 647 | 132 | 501 | 647 |
| -400. | 516 | 128 | 401 | 518 |
| -300. | 367 | 144 | 301 | 389 |
| -200. | 197 | 211 | 197 | 267 |
| -100. | 107 | 229 | 103 | 172 |
| -50. | 86 | 186 | 56 | 127 |
| 0. | 100 | 36 | 11 | 101 |
| 50. | 60 | 227 | 31 | 141 |
| 100. | 156 | 171 | 69 | 194 |
| 200. | 305 | 167 | 142 | 305 |
| 300. | 317 | 203 | 221 | 317 |
| 400. | 345 | 231 | 296 | 401 |
| 500. | 391 | 253 | 372 | 501 |
| min | max | vmin | vmax | Period | ||
|---|---|---|---|---|---|---|
| pc | pc | pc | pc | km/s | km/s | Myr |
| -500. | 501 | 313 | 620 | 161 | 310 | 14.0 |
| -400. | 401 | 257 | 493 | 162 | 304 | 11.4 |
| -300. | 301 | 203 | 369 | 163 | 289 | 8.7 |
| -200. | 202 | 166 | 287 | 174 | 262 | 6.8 |
| -100. | 103 | 100 | 172 | 139 | 237 | 4.4 |
| -50. | 57 | 56 | 127 | 104 | 234 | 3.8 |
| 0. | 27 | 10.0 | 101 | 28 | 278 | 3.1 |
| 50. | 57 | 31 | 141 | 60 | 272 | 4.0 |
| 100. | 103 | 68 | 194 | 96 | 276 | 5.3 |
| 200. | 202 | 99 | 304 | 103 | 309 | 7.5 |
| 300. | 301 | 145 | 432 | 109 | 327 | 10.4 |
| 400. | 401 | 197 | 556 | 112 | 341 | 13.4 |
| 500. | 501 | 247 | 683 | 114 | 347 | 16.4 |