Distinguishing Active Galactic Nuclei and Star Formation
Abstract
Using the large emission line galaxy sample from the Sloan Digital Sky Survey we show that Star forming galaxies, Seyferts, and low-ionization nuclear emission-line regions (LINERs) form clearly separated branches on the standard optical diagnostic diagrams. We derive a new empirical classification scheme which cleanly separates these emission-line galaxies, using strong optical emission lines. Using this classification we identify a few distinguishing host galaxy properties of each class, which, along with the emission line analysis, suggest continuous evolution from one class to another. As a final note, we introduce models of both Starforming galaxies and AGN narrow line regions which can explain the distribution of galaxies on standard emission line ratio diagrams, and possibly suggest new diagnostics across the emission spectrum.
1Sterrewacht Leiden, Leiden University, P. O. Box 9513, 2300 RA Leiden, The Netherlands
2Institute for Astronomy, University of Hawaii, 2680 Woodlawn Drive, Honolulu, HI 96822, USA
1. Introduction
Since emission line objects were first observed, ratios of strong lines have been to distinguish the various classes of emission line nebulae and ionization mechanisms. One of the first line ratio diagrams, and still one of the most powerful was that of [Nii]/H vs [Oiii]/H, proposed by Baldwin, Phillips, & Terlevich (1981), and commonly called the BPT diagram. This diagram uses strong, optical lines of close proximity in the ratios, limiting reddening and spectrophotometric effects, and is able to clearly distinguish different classes of ionization. This and other diagnostic diagrams along these lines were explored in detail later by Veilleux & Osterbrock (1987, (V&O)). However, with the advent of the Sloan Digital Sky Survey (SDSS) we have been able fill this diagram and explore details not seen before, enabling us to better understand the distribution and extent of the emission line galaxies on this diagram.
2. SDSS Emission Line Galaxies
Within this work we used the SDSS Data Release 4 (DR4) spectroscopic galaxy sample (Adelman-McCarthy et al. 2006), which includes spectra of over 500,000 objects. The spectra are taken using 3-arcsec diameter fibers, positioned as close as possible to the centers of the target galaxies. The flux- and wavelength-calibrated spectra cover the range from 3800 to 9200Å, with a resolution of 1800.
At the median redshift of the sample () the spectroscopic fiber typically contains 20 to 40 percent of the total galaxy light, thus contain a component due to the host galaxy as well as any nuclear AGN source. As described in Tremonti et al. (2004), we subtract the contribution of the stellar continuum from each spectrum, using the best fitting combination of template spectra from the population synthesis code of Bruzual & Charlot (2003). The best-fitting model also can be used to estimate stellar masses and star-formation histories (Kauffmann et al. 2003a).
The sample criteria we use for the emission line galaxies is described in detail in Kewley et al. (2006). The sample is limited to narrow emission line galaxies with redshifts above 0.02. We also apply a signal-to-noise cut () on the six dominant emission lines; H nm, [Oiii] nm, [Oi] nm, H nm, [Nii] nm, and the doublet [Sii] nm. This gives a total sample of emission line galaxies.
3. Emission Line Galaxy Classification
The division of AGN and Starforming (SF) galaxies on the BPT diagram has been known for a while, and the work of Kewley & Dopita (2002) provided a theoretical basis for the distribution of starforming galaxies on this and the (V&O) diagrams. This theoretical work provided a “maximal starburst” line and clear divisions between AGN and SF galaxies;
| (1) | |||||
| (2) | |||||
| (3) |
with all AGN galaxies lying above this line.
After this work, a clearer delineation between AGN and SF galaxies on the BPT diagram was seen by Kauffmann et al. (2003b) when the large sample of SDSS galaxies were plotted. A dividing line was fitted to these, giving the empirical relation,
| (4) |
With these diagnostics,the AGN branch, composed of Seyfert galaxies, LINER-type galaxies and composite AGN/SF galaxies, still remained mixed. However, when the V&O [Sii]/H and [Oi]/H vs [Oiii]/H diagrams are plotted with SDSS galaxies a clear minimum is seen in the AGN branch (see figure 3, Kewley et al. 2006). When this minimum is fitted with a line in both diagrams, an empirical division for Seyferts and LINERs is obtained,
| (5) | |||||
| (6) |
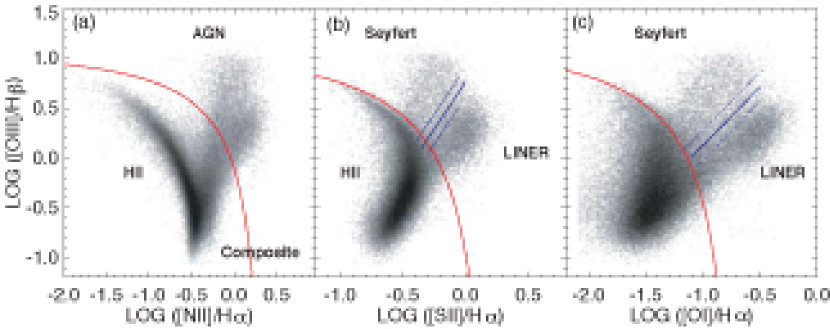
Together, these equations define 5 different classes of emission line galaxies, as shown in figure 1.
Starforming galaxies, lying below the Kewley and Kauffmann curves, are the most numerous, making (75%) of the SDSS sample.
Composite AGN/SF galaxies, lying between the Kauffmann and Kewley curves on the BPT diagram, are only 5900 galaxies, 7% of the sample.
Seyfert galaxies, lying above the Kewley curves and the [Oi] and [Sii] LINER lines, are only 3% of the SDSS sample (2400).
LINERs, lying on the other side of the LINER lines to Seyferts are more numerous at 6000 galaxies (7%)
The remaining galaxies (8%) fall in different classifications on at least one of the diagrams and are classified as ambiguous.
These classifications allow the differences and similarities between Starforming galaxies and AGN to be considered. This was first done by Kauffmann et al. (2003b), and found that SF galaxies are predominantly found in younger, more metal poor, later-type hosts than AGN. However, as they cover a much larger range in metallicity than AGN, their line properties are much more varied (Groves et al. 2006).
This was extended in detail in the work reported here (Kewley et al. 2006). The Composite galaxies, as would be expected for an intermediary population, lie somewhere between AGN and metal-rich Starforming galaxies in their host properties. Seyferts tend to lie in the “green valley” in terms of their host properties, having intermediary properties between the blue, SF disc galaxies and the “red & dead” ellipticals. LINERs are older, more massive, less dusty, less concentrated, and they have higher velocity dispersions and lower [Oiii] luminosities than Seyfert galaxies have. Seyferts and LINERs are most strongly distinguished by their [Oiii] luminosities. One remarkable property of the AGN is that at fixed L[Oiii]/, which is an indicator of the black hole accretion rate relative to the Eddington rate, all differences between Seyfert and LINER host properties disappear. LINERs and Seyferts form a continuous sequence, with LINERs dominant at low L/LEDD and Seyferts dominant at high L/LEDD. These results suggest that the majority of LINERs are AGN and that the Seyfert/LINER dichotomy is analogous to the high/low-state models and show that pure LINERs require a harder ionizing radiation field with lower ionization parameter than required by Seyfert galaxies, consistent with the low and high X-ray binary states.
4. A Model Understanding of the AGN & SF Emission
In addition to using the emission line diagrams to define empirical relationships and classifications, we can also use these diagrams to better define our theoretical models, which in turn help our understanding of emission line objects. With the starburst models of Dopita et al. (2006), we can clearly see that the dominating horizontal extent of the SF galaxies in the BPT diagram is driven by metallicity variations, while the vertical spread driven by a mix of stellar age and ISM pressure.
Using the models of Groves et al. (2004) we can see that the variation in the AGN branch is driven by a combination of effects, predominantly by ionization and metallicity in the horizontal [Nii] direction, and ionization and SF/AGN mixing in the vertical.
Together with the observations these models can help us correctly diagnose where exactly the ionizing photons are arising from in these galaxies, along with some important host galaxy parameters.
5. Conclusions
The SDSS has given us a large sample of emission line galaxies, truly filling out the BPT line ratio diagram. This has enabled clear, empirical classifications of Emission-Line galaxies to made, and an exploration of host properties of these different classes. These classifications and properties suggest some form of evolution, from the actively starforming galaxies across the AGN Seyfert phase to the final, elliptical LINER phase. Along with new self-consistent theoretical models, the spread in this and other diagnostic diagrams is now being understood, allowing a full classification based on both observation and theoretical knowledge.
References
- Adelman-McCarthy et al. (2006) Adelman-McCarthy, J. K., et al. 2006, ApJS, 162, 38
- Baldwin, Phillips, & Terlevich (1981) Baldwin, J. A.,Phillips, M. M., & Terlevich, R. 1981, PASP, 93, 5 (BPT)
- Bruzual & Charlot (2003) Bruzual, G., & Charlot, S. 2003, MNRAS, 344, 1000
- Dopita et al. (2006) Dopita, M. A., et al. 2006, ApJS, 167, 177
- Groves et al. (2004) Groves, B. A., Dopita, M. A., & Sutherland, R. S. 2004, ApJS, 153, 75
- Groves et al. (2006) Groves, B. A., Heckman, T. M., & Kauffmann, G. 2006, MNRAS, 371, 1559
- Kauffmann et al. (2003a) Kauffmann, G., et al. 2003a, MNRAS, 341, 33
- Kauffmann et al. (2003b) Kauffmann, G., et al. 2003b, MNRAS, 346, 1055
- Kewley & Dopita (2002) Kewley, L. J., & Dopita, M. A. 2002, ApJS, 142, 35
- Kewley et al. (2006) Kewley, L. J., Groves, B., Kauffmann, G., & Heckman, T. 2006, MNRAS, 372, 961
- Tremonti et al. (2004) Tremonti, C. A., et al. 2004, ApJ, 613, 898
- Veilleux & Osterbrock (1987) Veilleux, S. & Osterbrock, D. E. 1987, ApJS, 63, 295 (V&O)