Resolving the bow-shock nebula around the old pulsar PSR B192910 with multi-epoch Chandra observations
We have studied the nearby old pulsar PSR B192910 and its surrounding interstellar medium utilizing the sub-arcsecond angular resolution of the Chandra X-ray Observatory. The Chandra data are found to be fully consistent with the results obtained from deep XMM-Newton observations as far as the pulsar is concerned. We confirm the non-thermal emission nature of the pulsar’s X-radiation. In addition to the X-ray trail already seen in previous observations by the ROSAT and XMM-Newton X-ray observatories, we discovered an arc-like nebula surrounding the pulsar. We interpret the feature as a bow-shock nebula and discuss its energetics in the context of standard shock theory.
Key Words.:
pulsars: individual PSR B192910—stars: neutron—X-rays: stars1 Introduction
In 1990s, a series of powerful X-ray observatories were launched to space. Among many great results on various aspects in astrophysics, these observatories allowed a first detailed study of the X-ray emission properties of rotation-powered pulsars as a class (cf., Becker & Trümper 1997; Becker & Pavlov 2001, for a review). Most old111In standards of high energy astronomy rotation-powered pulsars are called young, middle aged, and old if their spin-down age is of the order of few times yrs, yrs, and yrs, respectively. This classification is diffuse, though, with a smooth transition in between the different groups. radio pulsars, though, were still too faint for a detailed study by these satellites (cf., Sun et al. 1993; Manning & Willmore 1994; Becker & Trümper 1997; Saito 1998). Thanks to the much improved sensitivity of the XMM-Newton and Chandra observatories, a more detailed study of old pulsars became possible. Observations of PSR B0950+08; B0823+26; J2043+2740 (Becker at al. 2004; Zavlin & Pavlov 2004); B0628-28 (Becker et al. 2005); B0943+10 (Zhang, Sanwal & Pavlov 2005); B1133+16 (Kargaltsev, Pavlov & Garmire 2006); B1929+10 (Becker et al. 2006); and B2224+65 (Hui & Becker 2007a) for the first time have allowed us to study the emission properties of old pulsars as a class. Surprisingly, the X-ray emission from old pulsars seems to be dominated by non-thermal radiation processes. Thermal components (e.g., to account for the emission from hot polar caps) are not required to model the X-ray spectra of these pulsars, resulting in mostly upper limits for any thermal radiation components. Further support for an emission scenario dominated by non-thermal radiation is found by the observed temporal emission properties. Pulse profiles, if detected with sufficient photon statistics, show multiple components and narrow features. This is indicative of strongly beamed emission, which further invalidates the heated polar cap scenario as the main source of X-ray emission in old pulsars. The pulsed fractions in old pulsars are in the range of .
In addition to the pulsar emission, which originates within the co-rotating magnetosphere, extended trail like X-ray emission was observed from PSR B192910 (Becker et al. 2006) and PSR B2224+65 (Hui & Becker 2007a) on a scale of several arc-minutes. In the case of PSR B192910 the X-ray emission in the trail is interpreted as synchrotron emission produced in the shock between the pulsar wind and the surrounding medium (see the discussion in Becker et al. 2006 for details). Owing to the moderate (15” half energy width) spatial resolution of XMM-Newton, details of the nebular emission associated with PSR B192910 might have been remained unresolved. With a ten times improved angular resolution Chandra data can thus be essential to further constrain the properties of the nebula very near to the pulsar.
In this paper, we present a detailed analysis of multi-epoch Chandra observations of the field around PSR B192910. Based on its X-ray emission properties, this source is considered prototypical of an old pulsar (Becker et al. 2006). With a pulse period of ms and a period derivative of , its characteristic age is determined to be years. These spin parameters imply a spin-down luminosity of and a magnetic field at the neutron star magnetic poles of G. With a radio dispersion measure of , the NE2001 Galactic free electron density model of Cordes & Lazio (2002) predicts a distance of 170 pc. However, the recent astrometric measurements by Chatterjee et al. (2004) yielded a precise proper motion and parallax determination that translates into an accurate distance measurement of pc and a proper motion of km s-1. The ephemerides of PSR B192910, which we made use of in this paper, are listed in Table 1.
The paper is organized as follows: in Sect. 2 we describe the observations and data analysis; and in Sect. 3 we summarize the results and provide a discussion in the context of a standard shock model for the nebular emission.
2 Observations and data analysis
| Right Ascension (J2000) | |
|---|---|
| Declination (J2000) | |
| First date for valid parameters (MJD) | 52929 |
| Last date for valid parameters (MJD) | 53159 |
| Pulsar rotation period (s) | 0.2265182954 |
| Period derivative ( s s-1) | 1.164739 |
| Characteristic age ( yrs) | 3.09 |
| Surface dipole magnetic field ( G) | 0.5129 |
| Dispersion Measure (pc cm-3) | 3.178 |
| Distance (pc) | |
| Spin-down Luminosity () ergs s-1 | 3.89 |
aAdopted from Becker et al. (2006)
Data analysis is restricted to the energy range keV. All energy fluxes, however, are computed for the keV band for better comparison with the results based on XMM-Newton data (Becker et al. 2006).
The object PSR B192910 was observed with Chandra in 2005 December 04 (Obs ID: 6657) and 2006 May 28 (Obs ID: 7230) with the Advanced CCD Imaging Spectrometer (ACIS). In both observations, PSR B192910 was located on the back-illuminated (BI) ACIS-S3 chip with an off-axis angle of arcmin. We used standard processed level-2 data. The effective exposures are ks and ks for the observations in 2005 December and 2006 May, respectively.
2.1 Spatial analysis
With the objective obtaining better statistics for the analysis, we combined both datasets to produce better images. We carefully checked and corrected the aspect offsets for each observation prior to the merging.
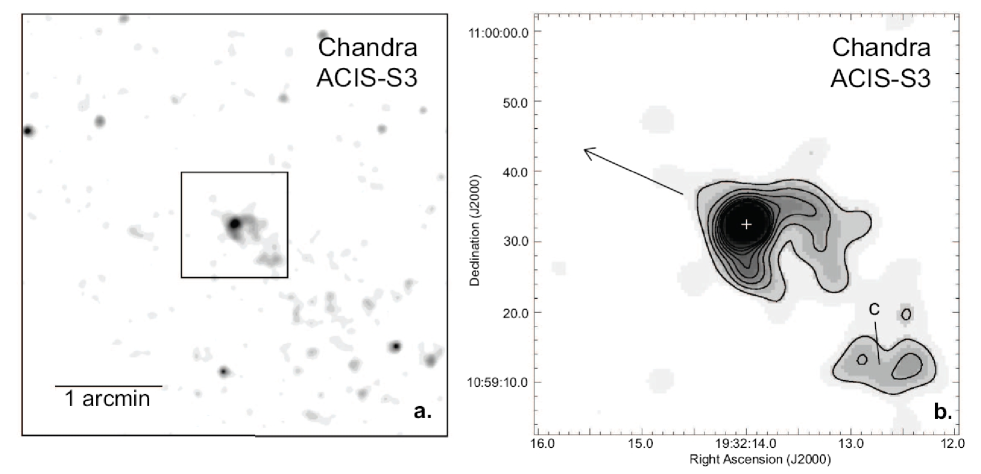
The combined X-ray images of the arcmin field centered on PSR B192910 as well as a close-up of the central arcmin regions are shown in Fig. 1. A compact nebula, which has an arc-like morphology somewhat resembling a bow-shock, is clearly detected around PSR B192910. X-ray contours were calculated at the levels of counts arcsec-2 s-1 and overlaid on the image in Fig. 1b. Assuming this arc-like compact feature is a bow-shock pulsar wind nebula, it is interesting to estimate the stand-off angle which is a crucial parameter in discussing the shock physics (see also Sect. 3). By fitting a 2-D Gaussian model to the raw image of the field around PSR B192910, we obtained a full width at half maximum (FWHM) of arcsec ( error) . We take this as an estimate for the lower bound of .
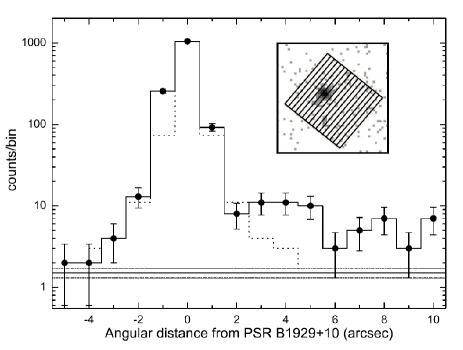
To further examine the extent of the compact nebula, we computed the brightness profile in the energy band keV from the raw image of bin size of 0.5 arcsec. We estimated the counts in sixteen consecutive boxes of dimensions arcsec, oriented along the nebula. The vignetting corrected brightness profile and the orientation of the 16 spatial bins are shown in Fig. 2. The arc-like nebula extends up to arcsec from the pulsar before fading into the background. Because of the wings of the ACIS-S point spread function, the pulsar is expected to contribute to its surrounding nebula. To estimate this, we compared the observed data with the ACIS-S instrumental point spread function. To do so, we simulated a point source observation using MARX (ver 4.2.1). The adopted inputs were the pulsar spectrum and the same exposure, roll, and off-axis angle as in the actual data. We then computed the brightness profile of the simulated data in the same way as aforementioned. The estimated point source profile is shown in Fig. 2 as a dotted line. The brightness profile of the arc-like nebula computed from the actual observation is significantly different from the expected distribution of a point source. On the other hand, there is no significant extended emission detected ahead of PSR B192910.
In addition to the arc-like nebula near the pulsar, we observed a clumpy structure (which is labeled as C in Fig. 1b). There are only net counts from this clump, which does not allow for a more detailed analysis. The signal-to-noise ratio of this clump is estimated to be , and thus is consistent with background fluctuations.
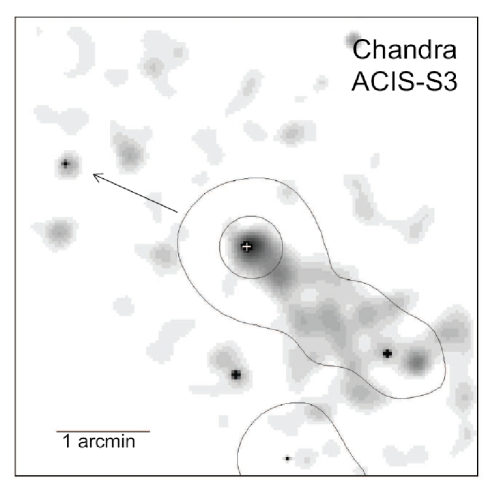
In Fig. 1a, no prominent structure resembling the X-ray trail seen by ROSAT and XMM-Newton opposite to the pulsar’s proper motion direction can be identified (cf. Fig. 2 in Becker et al. 2006). We have examined the Chandra image further by smoothing the raw data with a kernel of arcsec, which is comparable with the FWHM of XMM-Newton’s PSF. The smoothed image is displayed in Fig. 3. Comparing the image with the contours calculated from XMM-Newton MOS1/2 data, a faint trail like feature is noticed. However, the background contribution of this feature is estimated to be . The unabsorbed X-ray flux of a 1 arcmin circular trail region near the pulsar, as detected by XMM-Newton, is within the 0.5–10 keV band (Becker et al. 2006). The low significance of the trail in the two Chandra observations, thus, is in agreement with Chandra’s lower sensitivity. We, therefore, will not further consider the X-ray trail emission in this paper, and alert the interested reader to the XMM-Newton results reported by Becker et al. (2006), for a detailed discussion of its emission properties.
2.2 Spectral analysis
Although the spectrum from PSR B192910 has already been tightly constrained by the XMM-Newton data (Becker et al. 2006) it is important for us to re-examine its spectral properties with Chandra since it resolves the pulsar emission from the compact surrounding nebular component better.
We extracted the pulsar spectrum in both data sets from a circle of 2 arcsec radius (encircled energy 95%), centered on the pulsar, and fitted them simultaneously. The background spectrum was extracted from a source-free region within a 10 arcsec radius centered at R.A.=, Dec.= (J2000). After background subtraction, and net counts were available for the spectral analysis. These values imply the net counting rates of cts/s and cts/s for the observations in 2005 December and 2006 May, respectively.
We computed the response files with the tools MKRMF and MKARF in CIAO 3.4. Utilizing the most updated calibration data, CALDB 3.4.1, the generated response files corrected the degradation of the quantum efficiency in the ACIS CCD, accordingly. Each spectrum was dynamically binned so as to have at least 30 counts per bin. To better constrain the spectral properties, we fitted simultaneously the spectra obtained from both observations. We performed all the spectral fittings in keV with XSPEC 11.3.2. The parameters of all fitted model spectra are summarized in Table 2. All the quoted errors are , and were computed for 1 parameter of interest.
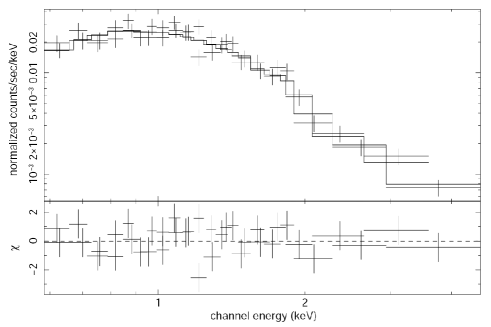
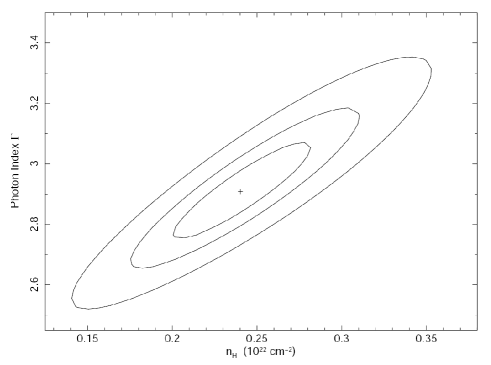
Among the single component models tested, we found that a power-law model fits the data best ( for 36 D.O.F.). This model yields a column density of cm-2, a photon index of , and a normalization at 1 keV of photons keV-1 cm-2 s-1. These best-fit values are fully consistent with those obtained by XMM-Newton for power-law fits (see Table 3 in Becker et al. 2006). The best-fit power-law spectrum and residuals are shown in Fig. 4. The column density inferred from both Chandra and XMM-Newton spectra is relatively high in comparison with the mean value obtained from the Extreme UltraViolet Explorer (EUVE) measurements of the stars in the neighborhood of the pulsar (Slowikowska et al. 2005). However, as discussed by Slowikowska et al. 2005, the interstellar medium is very patchy in the region around PSR B192910 (cf., Table 3 in Slowikowska et al. 2005 for more details). Merely on the basis of the comparison with the mean value, the we report and in Becker et al. (2006) cannot be invalidated. A more detailed mapping is thus needed to better constrain the toward the pulsar.
We have also computed the error contours to demonstrate the relative parameter dependences of the photon index vs. the hydrogen column density and plotted this in Fig. 5. The unabsorbed flux deduced for the best fit power-law model parameters is ergs s-1 cm-2 within keV. At a distance of 361 pc it implies a luminosity of ergs s-1.
As for the XMM-Newton data it is obvious that the single power-law model already describes the observed pulsar spectrum very well. Hence, the justification of including an additional thermal component is absent. In the Chandra data, we found that fitting with a power-law plus blackbody model does not yield a reasonable solution if we allow the blackbody radius and the temperature to be free parameters. It resulted in a blackbody radius of m. This is much smaller than the canonical size of a polar cap, m, which suggests the contribution from the additional blackbody component is insignificant. We quantified the statistical significance for adding this extra component to the power-law model with the test which suggests that inclusion of this thermal components is only required at a confidence level of .
We have also examined the possible contributions from a polar cap and the neutron star surface by fixing the blackbody radii at m and km, respectively. These fits yield temperatures of K and K. The test suggests that adding these thermal components to the power-law model is only significant at a confidence level . Due to the better photon-statistics this number was even smaller in the XMM-Newton data (Becker et al. 2006). This low significance is also reflected by the relative contribution of the thermal component in the total energy flux observed by Chandra. We estimated the upper limits for the polar cap temperature and its flux contribution by adding a blackbody component to the power-law model. Fixing the blackbody radius at a polar cap size of m, a upper limit of K was computed by assuming contribution from one polar cap only. This implies that the 1 limit contribution from the polar cap in the total energy flux is .
For the spectral model consisting of two blackbody components, we found that the best-fit model parameters also agree well with those inferred from the XMM-Newton spectra (Becker et al. 2006). Despite the acceptable value of the goodness-of-fit, the inferred blackbody radii are too small to be considered as a reasonable description. Moreover, the pulsar spectrum obtained by XMM-Newton and fitted together with the spectrum obtained by the ROSAT PSPC have already shown that this model cannot describe the data beyond keV (see Becker et al. 2006).
| Model a | D.O.F. | / | Normalization at 1 keVc | Radius d | ||
| cm-2 | photons keV-1 cm-2 s-1 | m | ||||
| PSR B192910 | ||||||
| PL | 0.89 | 36 | - | |||
| BB | 2.00 | 36 | - | |||
| PL+BB | 0.93 | 34 | / | |||
| PL+BB | 0.92 | 35 | / | |||
| PL+BB | 0.90 | 35 | / | |||
| BB+BB | 0.91 | 34 | / | - | / | |
| Arc-like feature | ||||||
| PL | 0.88 | 6 | - | |||
a PL = power-law; BB = blackbody
b The entry in this column depends on the model in interest. It is
the temperature in keV or the photon index
c The normalization constant for the power-law model.
d The radius of the blackbody emitting area is
calculate for an assumed pulsar distance of 361 pc.
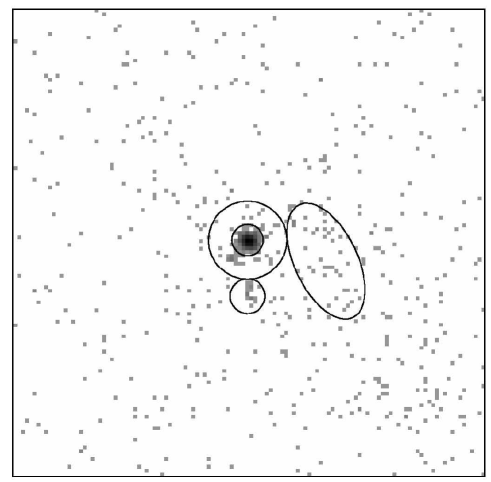
Since the arc-like nebula is resolved by Chandra for the first time, it is instructive to examine its energy spectrum, despite the poor photon statistics. We extracted the nebular spectra from the regions in accordance with its observed morphology. For the sake of consistency, we adopted the same extraction regions in both datasets, which are illustrated in Fig. 6. It consists of an annular region centered on the pulsar position with inner and outer radii of 2 arcsec and 5 arcsec, a circular region with a radius of 2.2 arcsec, as well as a ellipse of 4 arcsec8 arcsec.
The background spectra were extracted from each dataset within a nearby source-free region of a 10 arcsec radius, centered at RA.= and Dec.= (J2000). After background subtraction, there were and net counts extracted from the arc-like feature, implying the net counting rates of cts/s and cts/s for the observations in 2005 December and 2006 May, respectively. Within the errors of these count rates, no variability is apparent on the basis of these two observations. The response files were computed in the same manner as those for the pulsar spectra. Each spectrum was dynamically binned so as to have at least 10 counts per bin. In order to obtain a better statistic, we analyzed both spectra simultaneously.
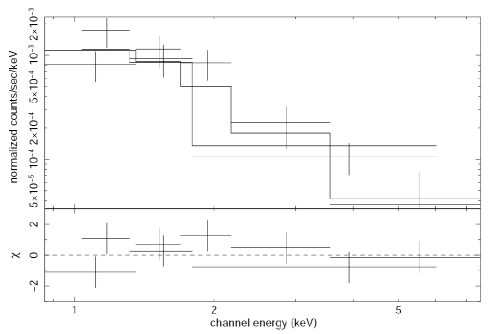
We hypothesized that the nebular emission originates from the interaction of the pulsar wind and the ISM. Synchrotron radiation from the ultra-relativistic electrons is generally believed to be the emission mechanism of the pulsar wind nebula, which is characterized by a power-law spectrum. We tested this hypothesis by fitting an absorbed power-law model to the nebular spectra. We fixed the column density at the value cm-2 inferred from fitting the pulsar spectrum. The power-law model describes the observed spectrum reasonably well ( for 6 D.O.F.). The best-fit power-law spectrum and residuals are shown in Fig. 7. This model yields a photon index of and a normalization at 1 keV of photons keV-1 cm-2 s-1. The unabsorbed flux deduced for the best-fitted model parameters are erg s-1 cm-2 in the energy range of keV. The pulsar distance of 361 pc implies a luminosity of erg s-1.
We have checked the robustness of all the spectral parameters quoted here by incorporating background spectra extracted from different source-free regions. We found that within the errors the spectral parameters inferred from independent fittings are all consistent with each other.
3 Discussion
Complementing the XMM-Newton observation, we have studied PSR B192910 and its surrounding medium with Chandra, which provides data with sub-arcsecond resolution. So far, three distinct components have been resolved, namely the pulsar itself, the X-ray trail opposite to the pulsar’s proper motion direction as well as the arc-like nebula surrounding the pulsar. The flux contributions from these components and the corresponding X-ray conversion efficiencies are summarized in Table 3.
| Component | a | ||
|---|---|---|---|
| ergs s-1 cm-2 | ergs s-1 | ||
| PSR B192910 | |||
| Trail-like feature b | |||
| Arc-like feature |
a Luminosities are calculated at the assumed pulsar distance of 361 pc
b Adopted from Becker et al. (2006)
The morphology of the arc-like nebula and the orientation with respect to the pulsar’s proper motion direction suggest a bow-shock nature. This is the first well-defined bow-shock morphology observed from an old pulsar.
A bow-shock nebula as observed in PSR B192910 can be produced by a pulsar in supersonic motion. In this case, the termination shock radius is determined by the balance of the ram pressure between the relativistic pulsar wind particles and the ISM at the head of the shock (cf. Hui & Becker 2007b):
| (1) |
where is the velocity of the pulsar in units of 100 km s-1; is the spin-down luminosity of the pulsar in units of erg s-1; and is the number density of the ISM in units of cm-3. A density of cm-3 implies a shock radius of cm. The stand-off angle between the pulsar and edge of the shock in the forward direction is related to by , where is the distance to the pulsar and is the inclination angle between the proper motion and the plane of the sky. Taking the FWHM resulted from Gaussian fitting to the radial profile (i.e., 1.13 arcsec) as the lower limit of , is then constrained to be .
At a distance of 361 pc, the proper motion velocity and the size of the arc-like nebula imply the pulsar took years to pass through the sky region of the nebula. We estimated the magnetic field in this shocked region by equating the passage time to the synchrotron cooling timescale yr, where is the Lorentz factor of the wind, taken to be (cf., Cheng et al. 2004), is the Thompson cross section, and is the magnetic field in the shocked region in units of micro gauss. This implies a magnetic field of for the region near to the pulsar. For comparison, the typical field strength in the ISM is (cf., Beck et al. 2003, and references therein). If the magnetic field in the neighborhood of PSR B192910 is comparable with this estimate, the inferred compression factor is in the bow-shock region, which is rather high in comparison with other pulsar wind nebulae (e.g., Hui & Becker 2006, 2007b). Polarization measurements of the sky region around PSR B192910 in the radio band can help to better constrain the magnetic field of this system and hence the compression factor.
In the context of the standard shock theory (Chevalier 2000), the X-ray luminosity and spectral index depend on the inequality between the characteristic observed frequency and the electron synchrotron cooling frequency: (cf., Chevalier 2000 and references therein), which is estimated to be Hz. Since, in general , this suggests the X-ray emission is in a fast cooling regime.
We further probed the energy distribution of the synchrotron radiating electrons in the shock. The emitting electrons are distributed as . In a fast cooling regime, the theoretical luminosity per unit frequency is given by (cf., Cheng et al. 2004):
| (2) |
Assuming the energy equipartition between the electron and proton, we took the fractional energy density of electrons to be and the fractional energy density of the magnetic field to be . We then integrated Eq. 2 over the frequency: , with 0.5 keV and 10 keV. Equating and the observed luminosity of the arc-like nebula results in an index of for the electron spectrum. This estimate lies within the acceptable range of the index as suggested in a standard shock model, i.e., (cf., Cheng et al. 2004 and references therein). For a fast cooling scenario, the photon index is related to as . The value implies a photon index of . This theoretical value lies within a uncertainty of the observed value.
The arc-shaped morphology of the nebula observed in PSR B192910 is similar to that of Geminga (Caraveo et al. 2003). However, there is a main difference between these two cases. While the arc-like nebula of Geminga is rather symmetric with respect to the direction of proper motion, asymmetry is indicated in the case of PSR B192910 (see Fig. 1b). Its asymmetric shape might be a result of the anisotropic pulsar wind and/or inhomogeneities in the surrounding ISM (see Hui & Becker 2006).
For the pulsar PSR B192910, we found that the spectral properties inferred from our analysis are in good agreement with the results obtained by XMM-Newton, which did not allow the pulsar emission to be separated from the compact nebular component. The consistency is expected even in the presence of the diffuse compact nebulae as it contributes only to the observed energy flux (see Table 3). Thus, the non-thermal emission scenario of PSR B192910 is confirmed. Hui & Becker (2007a) had argued that it is possible to sustain particle acceleration regions in PSR B192910’s outer-magnetosphere (so-called outer-gap) if the inclination of the magnetic axis with respect to the rotational axis is taken into account. This inference is supported by the ability of the outer-gap model in reproducing the observed X-ray pulse profile and its phase shift relative to the radio pulse (see Fig. 16 Becker et al. 2006). However, this model has difficulty in explaining the observed spectral properties of PSR B192910.
In the outer-gap model, the non-thermal X-rays result from the back-flowing charge particles from the outer gap (Cheng & Zhang 1999). When the primary electrons/positrons leave the outer-gap, they will emit curvature photons that are subsequently converted into secondary pairs in the presence of the strong magnetic field. Synchrotron photons will then be emitted by these secondary electrons/positrons. If these photons are energetic enough, they will further be converted into pairs that again lose their energy via synchrotron radiation. Therefore, an electromagnetic cascade is developed. Based on this model, Cheng & Zhang (1999) argued that the X-ray photon index resulting from such cascades should be . This is obviously not in agreement with the observed photon index for PSR B192910, which is as steep as . Observations of five other old pulsars: B1133+16 (Kargaltsev,Pavlov & Garmire 2006); B0943+10 (Zhang, Sanwal & Pavlov 2005); B0628-28 (Becker et al. 2005); B0823+26 (Becker et al. 2004); and J2043+2740 (Becker et al. 2004), also found the photon indices steeper than 2. This gives the outer-gap emission model a challenge. Re-examination of the model is thus required.
After this work was submitted to A&A for publication, we became aware that a paper on the similar subject as presented here was submitted to ApJ by Misanovic, Pavlov, & Garmire (2007). The results reported by these authors agree well with the results presented here. Misanovic et al., though, report to have detected a thermal component in the spectrum of PSR B192910. While their parameters inferred from the single power-law fittings are consistent with ours, they suggested that a model of power-law plus blackbody model provides a statistically better description. This obviously contradicts with the conclusion presented here and in Becker et al. (2006). From a closer inspection of their spectral fits we conclude that their apparent detection is probably biased by a too small signal-to-noise ratio per spectral bin. While we binned the Chandra spectrum so as to have at least 30 counts per bin Misanovic et al. (2007) grouped the data so as to have only about 15 counts per spectral bin. For the spectral fitting of XMM-Newton data, the parameters obtained by Misanovic et al. (2007) are for 190 degree of freedom whereas Becker et al. (2006) had only 121 degrees of freedom for their analysis. Becker et al. (2006) thus used a much higher photon statistics per spectral bin. The higher signal-to-noise ratio per spectral bin yielded a more stringent discrimination among competing spectral models. For this reason, the spectral results presented here as well as in Becker et al. (2006) provide more stringent constraints on the pulsar’s X-ray emission properties than those in Misanovic et al. (2007).
Acknowledgements.
We thank the referee Patrizia Caraveo for providing many useful suggestions to improve the quality of the manuscript considerably. We would also thank Bernd Aschenbach for thoroughly reading the manuscript and K. S. Cheng for discussing the shock physics with us.References
- (1) Beck, R., Shukurov, A., Sokoloff, D., & Wielebinski, R. 2003, A&A, 411, 99
- (2) Becker, W., Jessner, A., Kramer, M., Testa, V., & Howaldt, C. 2005, ApJ, 633, 367
- (3) Becker, W., & Pavlov, G. G. 2001, in The Century of Space Science, eds. J. Bleeker, J. Geiss & M. Huber, Kluwer Academic Publishers, p721 (available from astro-ph/0208356).
- (4) Becker, W., & Trümper, J. 1997, A&A, 326, 682
- (5) Becker, W., Weisskopf, M. C., Tennant, A. F., Jessner, A., Dyks, J., Harding, A. K., & Zhang, S. N. 2004, ApJ, 615, 908
- (6) Becker, W., Kramer, M., Jessner, A., et al. 2006, ApJ, 645, 1421
- (7) Caraveo, P. A., Bignami, G. F., De Luca, A., et al. 2003, Science, 301, 1345
- (8) Chatterjee, S., Cordes, J. M., Vlemmings, W. H. T., Arzoumanian, Z., Goss, W. M., & Lazio, T. J. W. 2004, ApJ, 575, 407
- (9) Cheng, K. S., Taam, R. E., & Wang, W., 2004, ApJ, 617, 480
- (10) Cheng, K. S., & Zhang, L. 1999, ApJ, 515, 337
- (11) Chevalier, R. A. 2000, ApJ, 539, L45
- (12) Cordes, J. M., & Lazio, T. J. W. 2002, preprint (astro-ph/0207156)
- (13) Hui, C. Y., & Becker, W. 2006, A&A, 448, L13
- (14) Hui, C. Y., & Becker, W. 2007a, A&A, 467, 1209
- (15) Hui, C. Y., & Becker, W. 2007b, A&A , 470, 965
- (16) Kargaltsev, O., Pavlov, G. G., & Garmire, G. P. 2006, ApJ, 636, 406
- (17) Manning, R. A., & Willmore, A. P. 1994, MNRAS, 266, 635
- (18) Misanovic, Z., Pavlov, G. G., & Garmire, G. P. 2007, arXiv:0711.4171v1
- (19) Saito, Y. 1997, Ph.D. thesis, Univ. Tokyo
- (20) Slowikowska, A., Kuiper, L., & Hermsen, W. 2005, A&A, 434, 1097
- (21) Sun, X., Trümper, J., Dennerl, K., & Becker, W. 1993, IAU Circ., 5895, 2
- (22) Zavlin, V. E., & Pavlov, G. G. 2004, ApJ, 616, 452
- (23) Zhang, B., Sanwal, D., & Pavlov, G. G. 2005, 624, L109