Shocked Molecular Hydrogen in the 3C 326 Radio Galaxy System
Abstract
The Spitzer spectrum of the giant FR II radio galaxy 3C 326 is dominated by very strong molecular hydrogen emission lines on a faint IR continuum. The H2 emission originates in the northern component of a double-galaxy system associated with 3C 326. The integrated luminosity in H2 pure-rotational lines is erg s-1, which corresponds to 17% of the 8-70 m luminosity of the galaxy. A wide range of temperatures (125-1000 K) is measured from the H2 0-0 S(0)-S(7) transitions, leading to a warm H2 mass of . Low-excitation ionic forbidden emission lines are consistent with an optical LINER classification for the active nucleus, which is not luminous enough to power the observed H2 emission. The H2 could be shock-heated by the radio jets, but there is no direct indication of this. More likely, the H2 is shock-heated in a tidal accretion flow induced by interaction with the southern companion galaxy. The latter scenario is supported by an irregular morphology, tidal bridge, and possible tidal tail imaged with IRAC at 3-9 m. Unlike ULIRGs, which in some cases exhibit H2 line luminosities of comparable strength, 3C 326 shows little star-formation activity ( yr-1). This may represent an important stage in galaxy evolution. Starburst activity and efficient accretion onto the central supermassive black hole may be delayed until the shock-heated H2 can kinematically settle and cool.
1 Introduction
Recent Spitzer and ISO observations have revealed a new class of extremely luminous molecular hydrogen emission galaxies (MOHEG’s) with (H erg s-1 in pure-rotational molecular hydrogen emission lines but relatively weak total IR emission, (H2)/(IR). In comparison, normal star-forming galaxies in the SINGS survey of the local universe have (H2)/(IR) (Roussel et al., 2007).
Appleton et al. (2006) discovered H2 emission extended over in the giant intergalactic X-ray shock front in the Stephan’s Quintet compact group. The estimated H2 luminosity from the whole shock is in excess of 1041 ergs/s. Nearly 30% of the IR luminosity is in H2 lines, while the rest is emitted by K dust in the far-IR (Xu et al., 2003). The power in the H2 lines compared with the dust continuum is several orders of magnitude larger than that seen in photo-dissociation regions (PDRs). The H2 emission lines are very broad (870 km s-1), suggesting turbulent motions inside the shock front. The H2 emission may be powered by non-dissociative shocks in dense clumps or filaments inside the shock front.
Egami et al. (2006) find extremely luminous (H2) erg s-1 emission from of warm H2 in the brightest galaxy of the high-luminosity X-ray cluster Zw 3146. This is accompanied by high-luminosity dust emission powered by starburst activity. Lower luminosity ro-vibrational H2 emission is similarly seen in several low-redshift galaxy clusters (Donahue et al., 2000; Hatch et al., 2005; Johnstone et al., 2007). The source of excited H2 in galaxy clusters is an unsolved mystery–cooling flows, jet shocks, and X-ray heating by active galactic nuclei (AGNs) have all been considered.
Molecular hydrogen emission is often seen in interacting galaxies and ultra-luminous infrared galaxies (ULIRGs), but (H2)/(IR) is typically (Haas et al., 2005; Higdon et al., 2006). The late-stage merger/LIRG NGC 6240 has atypically luminous emission from of warm H2, accompanied by a prodigious star-formation rate of yr-1 (Lutz et al., 2003; Netzer et al., 2005; Max et al., 2005; Armus et al., 2006). The overlap region between the Antennae colliding galaxies also shows unusually strong H2 emission with (H2)/(IR), possibly indicating a pre-starburst shock (Haas et al., 2005).
We present the remarkable H2 emission spectrum of the FR II radio galaxy 3C 326, observed with the Spitzer Space Telescope. This is part of a large survey of 52 FR II radio galaxies from the 3CRR catalog (Ogle, Whysong, & Antonucci, 2006), and another survey of 21 FR I radio galaxies (Ogle, Antonucci, & Whysong, 2007). So far, we have found 3 FR IIs (6%) and 5 FR Is (24%) with strong H2 emission (Ogle et al. 2007, in preparation). Of the galaxies in our sample, 3C 326 has the largest H2 emission line equivalent widths. The weak mid-IR continuum of 3C 326 indicates the presence of a radiatively inefficient AGN, in spite of its large radio power and enormous size of its radio lobes.
2 Radio Galaxy Identification
The radio source 3C 326 is one of the largest known (Willis & Strom, 1978), with an angular size of 195 (1.9 Mpc; we assume a cosmology with km s-1 Mpc-1, , and ). The pair of galaxies 3C 326 N and 3C 326 S are both at a redshift of and have a projected separation of 249 (41 kpc). There is some confusion concerning which of the two galaxies hosts the AGN that produced the Mpc-scale radio lobes. Both galaxies have unresolved () radio sources coincident with their nuclei, with and 6.5 mJy, respectively (Rawlings et al., 1990). While the southern radio source is brighter, both sources are consistent with typical FR II radio galaxy cores. The galaxy 3C 326 N has a LINER-like optical emission line spectrum (strong [Oii], H, [S ii], and weak [Oiii]), while 3C 326 S has no detected emission lines (Rawlings et al., 1990; Simpson et al., 1996). Also, the K-band magnitude and corresponding stellar mass of 3C 326 N is more typical of FR II radio galaxy hosts (Rawlings et al., 1990). We therefore targeted 3C 326 N with the Spitzer IRS.
3 Observations
3.1 Spitzer IRS
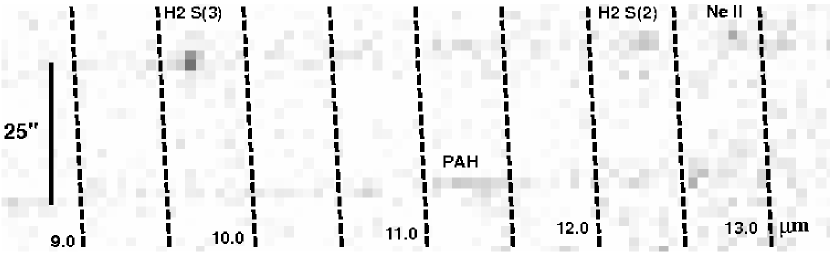
The radio galaxy 3C 326 N was observed with the Spitzer IRS (Houck et al., 2004), covering the wavelength range 5-35 m. The companion galaxy 3C 326 S was observed on one nod of the Short-Low (SL) slits because of a fortuitous slit PA (Fig.1). The slit widths in the low-resolution modules Short-Low 2 (SL2), Short-Low 1 (SL1), Long-Low 2 (LL2), and Long-Low 1 (LL1) are 36, 37, 105, and 107, respectively. The SL and LL spectral resolutions range from 60-130. The exposure times were 240 seconds in each spectral order except LL2 (480 seconds).
Our data reductions began from the S15.3.0 pipeline-processed basic calibrated data (BCDs). Off-slit observations were subtracted to remove background light. The 2D-spectra were cleaned using IRSCLEAN 1.8 to median filter bad pixels. Spectra were extracted using SPICE 1.4 within tapered regions matching the Spitzer point-spread function (SL2: 72 at 6 m, SL1: 144 at 12 m, LL2: 217 at 16 m, LL1: 366 at 27 m). The second LL2 nod was considerably noisier than the first, so we discarded this data. Optimal extraction (which assumes a point-source spatial profile) yielded significant gains in S/N for both galaxies.
At the redshift of 3C 326, 10 corresponds to 1.7 kpc. The SL and LL slit widths correspond to 6.2 kpc and 18 kpc, respectively, and are considerably smaller than the optical extents of the two galaxies. However, the continuum level is well-matched across orders and the emission lines and dust features do not appear to be spatially extended along the slit for either galaxy (Figs. 1, 2, 3). The continuum and emission line fluxes from the optimally extracted spectra also agree well with the regular extractions, indicating that the galaxies are (excepting the stellar component at short wavelengths) mostly unresolved by Spitzer IRS, and that aperture effects are unimportant for studying the dust and gas emission.
3.2 The Mid-IR Spectra
The spectrum of 3C 326 N is dominated by pure-rotational emission lines from molecular hydrogen (Fig. 2, Table 1). We detect the full series of emission lines from H2 0-0 S(0)-S(7). Forbidden emission lines from the low-moderate ionization species Fe ii, S iv, Ne ii, S iii, and O iv are also observed (Table 2). Polycyclic aromatic hydrocarbon (PAH) emission features are seen at 6.7, 7.7, 10.7, 11.3, 13.6, and 17 m (Table 3). We consider the PAHs at 6.7, 7.7, 10.7, 15.9 and 18.9 m and the Fe ii, S iv, and S iii lines to be marginal () detections.
We model the 3C 326 N spectrum using the fitting routine PAHFIT (Smith et al., 2007). Extinction is not included in the model since it does not improve the fit. Emission lines are fit by Gaussians and PAH features are fit by Drude profiles (Tables 1-3). None of the emission lines are resolved, all with FWHM km s-1. The 4.8-8 m continuum is dominated by galaxian starlight. An excess over the stellar component in the 8-24 m region is fit by thermal emission from warm (90-300 K) dust, with integrated flux erg s-1 cm-2 and luminosity erg s-1.
The companion galaxy 3C 326 S has no H2 emission detected; the 3 upper limit to the H2 S(3) line flux is erg s-1 cm-2 ((H2) erg s-1). No ionic forbidden emission lines are detected, consistent with the lack of optical emission lines and indicating an inactive nucleus. A spike in the spectrum at m does not match any known emission lines and may result from a hot pixel. The 7.7 and 11.3 PAH features are 2-3 times as strong in 3C 326 S compared to 3C 326 N (Table 3) and the mean 9-10 m continuum flux density ( mJy) is 20% brighter.
3.3 Spitzer IRAC and MIPS
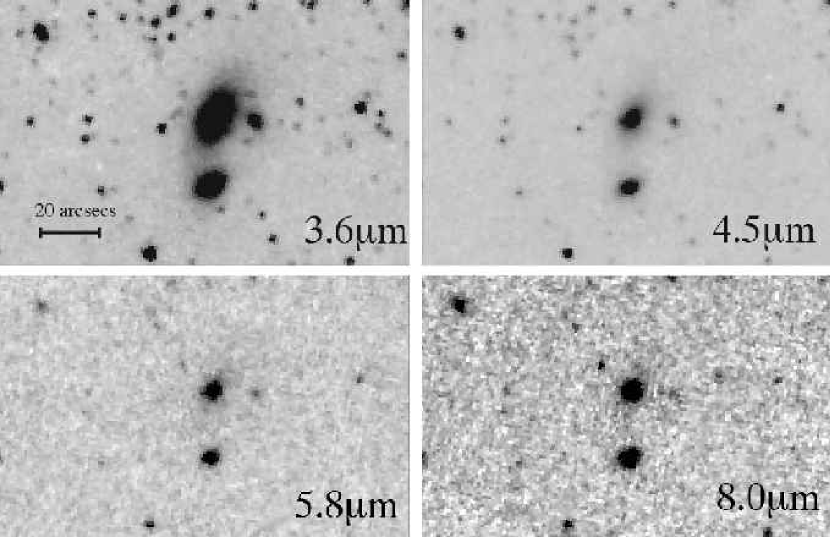
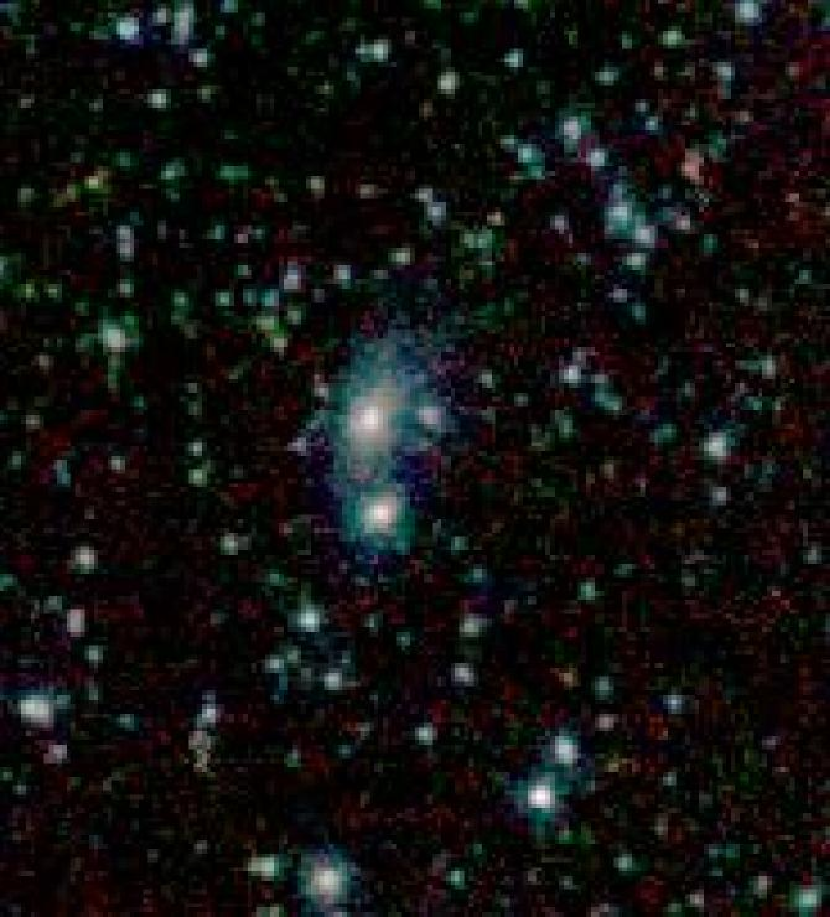
We retrieved the IRAC (Fazio et al., 2004) 3.6, 4.5, 5.8, and 8.0 m S14.0.0-processed images from the Spitzer archive (Program-ID 03418, PI M. Birkinshaw) to further constrain the spatial distribution of the stellar, dust, and molecular gas components (Figs. 3,4). A 3 clipped average of the dither positions, excluding frames affected by a bright star at the edge of the field, was used to subtract the background light, and frames were combined using the SSC MOPEX-MOSAIC software. The 3.6 and 4.5 m bands measure the stellar continuum. The 5.8 m band contains the redshifted H2 S(5)-S(7) lines and 6.7 m PAH feature. The 8.0 m band contains the redshifted H2 S(3)-S(4) lines and 7.7 m PAH feature. Both of the latter two bands also contain thermal continuum emission from warm dust.
The irregular morphology of 3C 326 N in the IRAC images suggests an ongoing interaction or merger with 3C 326 S ( at PA), a relatively compact elliptical galaxy. The isophotes of the two galaxies merge and they appear to be connected by a tidal bridge. There is a possible tidal tail extending from the NW quadrant at PA. Two other sources, one away from the center of 3C 326 at PA and one away at PA, appear to be unrelated background galaxies seen in projection, based on their morphologies, red colors, and small angular diameters in archival Sloan Digital Sky Survey (SDSS) images 111http://www.sdss.org/.
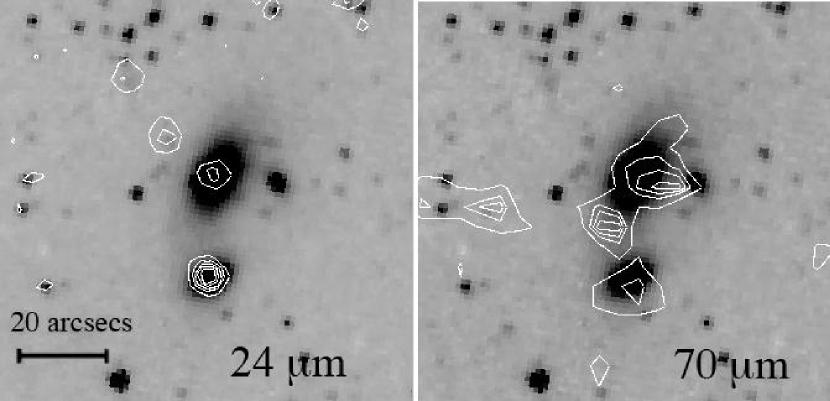
We also obtained 24, 70, and 160 m MIPS (Rieke et al., 2004) imaging data from the Spitzer archive for 3C 326 (Fig. 5). Individual BCD frames from the S14.4 pipeline were processed with the MOPEX-MOSAIC software to generate final images. Aperture photometry was performed on both 3C 326 N and 3C 326 S, and point-source aperture corrections222obtained from http://ssc.spitzer.caltech.edu were applied to derive the fluxes (Table 4 and Fig. 6). Both galaxies are detected at 24 and 70, but not 160 m. We measure a root-mean-square noise of 0.4 MJy sr-1 and flux upper limits of 34 mJy at 160 m. This is consistent with a non-detection at 870 m (Quillen et al., 2003), within a beam centered on 3C 326 S.
The companion 3C 326 S is twice as bright as 3C 326 N at 24 m, while 3C 326 N is 40% brighter at 70 m. A third source is seen in the 70 m image at the location where the tidal bridge in the IRAC 3.6 m image connects to 3C 326 N (Fig.5, Table 4). It is not detected in the MIPS 24 m band, nor in any of the IRAC bands. If it is truly associated with 3C 326, then it may indicate cool dust in the tidal bridge. Unfortunately, none of the IRS slits covered this feature, so we do not know if there is any associated H2 emission.
The spectral energy distributions (SEDs) of 3C 326 N and S are similar, but do show interesting differences (Fig. 6). Both are dominated by stellar emission at frequencies Hz (wavelengths m), consistent with our model of the IRS spectrum of 3C 326 N. Dust emission contributes most of the flux at Hz and synchrotron emission from the radio cores is seen at 3-10 GHz. The ratio (70 m)/(24 m) is greater in 3C 326 N than in 3C 326 S (Table 4), indicating relatively more cool dust emission and relatively less warm dust emission.
We estimate far-IR continuum luminosities by interpolating the 24 and 70 m photometric points with a power law. This yields erg s-1 and erg s-1, respectively, for 3C 326 N and 3C 326 S. Adding together the MIR 8-24 m and FIR 24-70 m emission, the 8-70 m luminosity of 3C 326 N is erg s-1 (). Upper and lower bounds to the FIR luminosity at longer wavelengths of erg s-1 are estimated for either galaxy by assuming blackbody emission that peaks at either 70 m or 160 m (Fig. 6). The total 8-1000 m IR luminosity of 3C 326 N therefore lies in the range erg s-1 ().
4 H2 Emission
The galaxy 3C 326 N has H2 pure-rotational lines of extraordinary luminosity and equivalent width (Fig. 2, Table 1). The H2 S(3) line has a luminosity of erg s-1 and an equivalent width of m. The integrated S(0)-S(7) line luminosity is erg s-1. This is of the measured 8-70 m luminosity and of the estimated 8-1000 m luminosity, making it the most extreme H2-emitting galaxy seen so far by Spitzer (Table 6). Unlike the giant, extended, intergalactic shock in Stephan’s Quintet, the H2 emission here is unresolved and contained within the central region of 3C 326 N.
We estimate the upper-level column densities () for each observed H2 transition, divided by the statistical weights (Fig. 7, Table 1), assuming that the H2 source just fits inside the SL slit (37). The column density distribution is fit by a minimum of 3 temperature components with and 1000 K (Table 5). The fit is not unique but rather serves to demonstrate the large range of temperatures of the H2 emission regions. The total column density of 125 K H2 averaged over the SL slit is cm-2.
The ratio of ortho (odd angular momentum quantum number J) to para (even J) H2 depends on the gas temperature and thermal history. Warm H2 in thermal equilibrium at a temperature of 125 K should have ortho/para=2.1, which is consistent with our model fit. The ratio of ortho/para H2 in the hot (400 K and 1000 K) components is consistent with the standard value of 3.0 for gas in thermal equilibrium at K (Wilgenbus et al., 2000; Neufeld et al., 2006).
The masses of warm and hot molecular gas sum to (Table 6). This is comparable to the warm H2 mass in NGC 6240 (Lutz et al., 2003; Armus et al., 2006) and to the total molecular gas mass of the Milky Way (). No published CO observations of 3C 326 are available, so we have no knowledge of the mass of cold H2; although by analogy with galaxies like NGC 6240 the cold component could be even larger than the warm and hot components. In thermodynamic equilibrium, the H2 component densities must exceed the critical densities of the observed rotational transitions (Le Bourlot et al., 1999). This yields maximum filling factors ranging from for the 125 K component to for the 1000 K component within the central 6.2 kpc-diameter sphere (Table 5).
5 Forbidden Emission Lines and AGN Activity
The mid-IR forbidden emission lines from several ions (Table 2) can be used to distinguish between starburst and AGN activity. In particular, line flux ratios of [O iv]/[Ne ii] and [S iv]/[Ne ii] in 3C 326 are characteristic of a LINER AGN (Spinoglio & Malkan, 1992; Sturm et al., 2006). Seyfert galaxies have relatively stronger [O iv] and [S iv] than this, while starburst galaxies are relatively weaker in these two lines. Consequently, little of the forbidden line emission comes from star-formation activity. A LINER classification for 3C 326 is also consistent with the optical line ratio [O iii] 5007Å/[O ii] 3727Å (Simpson et al., 1996).
Spitzer observations give an upper limit to the IR luminosity of the AGN, since there is a significant contribution from the host galaxy. The fiducial 15 m continuum flux is mJy, somewhat greater than the upper limit measured by Ogle, Whysong, & Antonucci (2006). (Our measurement accuracy has improved by throwing out the noisy LL2 nod and using optimal extraction.) The corresponding luminosity is erg s-1 and its ratio to the radio lobe luminosity is only m)/(178 MHz). We confirm that this powerful radio galaxy contains an AGN with relatively low accretion power. In comparison, we find from archival Spitzer IRS observations that the LINER/FR I radio galaxy M 87 is one tenth as bright, with erg s-1, and has a similar ratio of . It has been argued that low-power radio galaxies such as M 87 are fueled by radiatively inefficient accretion (Reynolds et al., 1996).
X-ray heating has been proposed as a possible mechanism to produce H2 emission in active galaxies (Krolik & Lepp, 1989; Draine & Woods, 1990; Rigopoulou et al., 2002). Unfortunately, there are no published X-ray observations of 3C 326 N. However, Hardcastle, Evans, & Croston (2006) find a 1:1 correlation between 15 m continuum emission and accretion-powered 2-10 keV X-ray luminosity for radio galaxies. If this correlation holds true for 3C 326 N and the H2 were powered by X-rays, then the observed ratio of (H2)/(15 m) would require an implausibly high conversion of X-rays to H2 emission. Chandra X-ray observations are necessary to directly confirm this, and will also be useful for measuring the high-energy SED of the AGN to test accretion models.
6 Aromatic Feature Emission and Star Formation
We detect several aromatic (PAH) emission features in the IRS spectrum of 3C 326 N (Fig.2, Table 3). The 7.7 and 11.3 m PAH luminosities are erg s-1 and erg s-1, respectively. The 11.3/7.7 PAH flux ratio is , to be compared with an average ratio of for spiral galaxies and AGN host galaxies (Smith et al., 2007; Shi et al., 2007). The total luminosity in detected PAH features is erg s-1 and the ratio (H2)/(PAH). This ratio is much greater than the typical ratio of seen in normal star-forming galaxies where both H2 and PAHs are thought to be produced in stellar PDRs (Roussel et al., 2007).
PAH emission excited by UV photons from O and B stars roughly correlates with other star-formation rate (SFR) indicators such as H luminosity and 24 m continuum luminosity (Roussel et al., 2001). However, there is a large scatter, with PAH luminosity depending on metallicity and age of the stellar population (Calzetti et al., 2007). X-ray radiation from an AGN can destroy PAHs (Voit, 1991), but should have little effect at large distances or in regions shielded from the nucleus. With these caveats in mind, we estimate the SFR from the luminosity of the 7.7 m PAH feature to be yr-1 for 3C 326 N. The 24 m luminosity measured with MIPS yields a comparable SFR of yr-1. The similarity of these two estimates indicates that the AGN does not dominate the continuum at this wavelength (). The star formation rate is only of the yr-1 SFR of the Milky Way.
A remarkable aspect of 3C 326 N (and MOHEGs in general) is the lack of starburst activity in the presence of a large molecular gas mass. The mean surface density of warm H2 inside the SL slit is pc-2. In order to suppress star formation in a central thin disk, the total gas surface density must be below the critical density (Kennicutt, 1989). An accurate estimate of the critical density in 3C 326 N will require a kinematic study of the molecular gas. A large turbulent velocity dispersion or rotational velocity shear would increase the critical density for star formation. The molecular gas may have not yet even settled into a disk. Efficient star formation and AGN accretion may be suppressed and delayed in 3C 326 N until the molecular gas has kinematically settled and cooled.
The PAH and 24 m luminosities of companion galaxy 3C 326 S yield estimated SFRs of yr-1 and yr-1, respectively. These SFR estimates are within the broad range seen for normal, non-starburst early type galaxies (Combes, Young, & Bureau, 2007). The SFR in 3C 326 S is significantly larger than the SFR in 3C 326 N. Since no H2 emission lines are detected, it is likely that most of the remaining molecular gas is cold and conducive to star formation. A Hubble Space Telescope image of 3C 326 S in the F702W band shows a dust lane (or nearly edge-on disk) cutting across the core at PA, which confirms the presence of a significant dusty ISM (Martel et al., 1999). The galaxy 3C 326 S may be the H2 donor for 3C 326 N, and may have had a much larger molecular gas component which has been largely stripped by tidal interaction. It would be particularly useful to measure the masses and surface densities of cold CO (and thereby H2) in both galaxies to see if they are consistent with the observed SFRs and to help understand why the warm H2 emission is so much stronger in 3C 326 N.
7 Energetics and H2 Heating Mechanisms
In 3C 326 N, the ratio of mid-IR rotational H2 emission to the 8-70 m IR continuum emission is (H2)/. The H2 pure rotational lines are therefore a major coolant for the warm molecular gas phase of the ISM. The 125 K H2 component has a thermal energy content of erg and the cooling time from the observed luminosity in H2 S(0)+S(1) lines is only yr. It is therefore necessary to continuously inject energy into the molecular gas to maintain the observed temperature. We consider below two possible scenarios for heating the H2, i) shock-heating by the inner radio jet and ii) tidally-induced inflow or accretion from the companion galaxy 3C 326 S.
7.1 Radio Jet Heating Scenario
The radio lobe size and Alfvén speed give an estimated expansion age of yr for the Mpc-scale radio source (Willis & Strom, 1978). The terminal working surfaces of the radio jets are in intergalactic space, far outside both galaxies. Any jet-heating of H2 must be done locally by the inner jet at a radius of kpc. The average jet power is best estimated from the extended radio lobe emission. The minimum energy content in the radio lobes derived from equipartition arguments is erg (Willis & Strom, 1978). Dividing by the radio source lifetime, we estimate a jet kinetic luminosity of erg s-1. We estimate a smaller kinetic luminosity of erg s-1 if the lobe magnetic fields have sub-equipartition strength and the lobe energy is dominated by relativistic particles (Punsly, 2006, 2005).
The integrated 10 MHz-10 GHz synchrotron luminosity from the radio lobes is erg s-1, of the estimated jet kinetic luminosity. The synchrotron luminosity of the 3C 326 N core is much weaker, at erg s-1. If we assume that the synchrotron luminosity is roughly proportional to the dissipation of jet kinetic energy, then the ratio of core to lobe total luminosity indicates that of the jet kinetic luminosity, or erg s-1 is dissipated in 3C 326 N. (For the sake of illustration, this assumes that relativistic beaming is not important in the core. In the likely case that the core emission is beamed, this should be divided by the beaming factor.) This is less than one tenth of the luminosity required to power the observed H2 emission. Also, jet shocks must be active over a large fraction of the total H2 mass in the galaxy to be a viable heating mechanism. However, with a large uncertainty in the amount of jet kinetic power dissipated and the unknown spatial configuration of H2, this scenario may deserve further consideration. High-spatial resolution radio observations are necessary to look for any direct evidence of jet-ISM interaction.
7.2 Tidally Induced Inflow
Another, preferred scenario is that 3C 326 N has been disturbed by gravitational interaction with 3C 326 S. The H2 may have either been stripped from 3C 326 S, or already present in 3C 326 N. Tidal forces from 3C 326 S would then induce the observed distortions in 3C 326 N, in turn giving rise to gravitational torque that drives molecular gas into the galaxy center. The gravitational energy of the in-falling gas is then converted into turbulence and heat via an accretion shock or shocks between sub-clumps. The simulations of Mihos & Hernquist (1996) show that the greatest gas inflow rates are achieved for co-planar interactions of disk systems yr after the initial encounter due to the growth of a central bar over the disk dynamical time scale, but before the final merger. The tidal field of the bar drives the inflow.
The K-band magnitudes of 3C 326 N and S are 12.95 and 13.60, respectively (Lilly & Longair, 1984; Rawlings et al., 1990). We estimate stellar bulge masses of and , respectively, using an empirical relation between K-band luminosity and bulge mass (Marconi & Hunt, 2003). The 2:1 mass ratio qualifies this as a major interaction. The corresponding nuclear supermassive black hole masses (assuming ) are and , which may eventually result in a major black hole merger if the two galaxies merge. The isophotes of 3C 326 N are roughly elliptical at a radius of , with PA. At larger radii (), the isophotes bend to the south to meet 3C 326 S, perhaps indicating a tidal bridge. The two galaxies have identical radial velocities to within the measurement uncertainties ( km s-1).
The 2-body L1 Lagrange point is at kpc from the nucleus of 3C 326 N and kpc from the nucleus of 3C 326 S, where is the inclination of the orbital axis. The gravitational potential energy released by of H2 falling from L1 to the center of 3C 326 N is erg. Dividing by the dynamical (free-fall) time-scale of yr, we obtain an H2 inflow rate of 12 yr -1 and an accretion luminosity of erg s-1. This is sufficient to power the observed H2 emission at a conversion efficiency of 27%. A massive dark halo will deepen the gravitational potential and allow an even lower conversion efficiency. The near-coincidence of the crossing time-scale yr and the age of the radio source suggests the intriguing possibility that the radio jet activity is ultimately fueled, at low radiative efficiency, by tidally driven accretion.
Ground-based adaptive-optics imaging of near-IR H2 rovibrational transitions in 3C 326 N will probe the spatial distribution of hot H2 and further test the scenario of tidally induced accretion. The proposed H2 Explorer mission (H2EX, Boulanger & Maillard, 2007), sensitive to H2 emission over a large field of view, can establish the space density of the general MOHEG population and help determine its importance as a stage in galaxy evolution.
8 Conclusions
We have discovered extremely luminous molecular hydrogen pure-rotational emission lines from radio galaxy 3C 326 N. The continuum emission is relatively weak, so that the H2 emission contributes of the 8-70 m IR luminosity and is a major coolant. We measure a warm molecular gas mass of at temperatures of 125-1000 K within a 3.1 kpc radius of the galaxy center. The H2 ortho/para ratios are consistent with thermodynamic equilibrium.
We consider 3 ways to heat the H2 to the observed temperatures and produce the extreme H2 emission line luminosities. The LINER AGN in 3C 326 N is most likely not luminous enough to power the observed H2 emission via X-ray heating. Jet-shock heating could work in principle, but there does not appear to be enough kinetic energy dissipated inside the host galaxy by the jet. We favor the idea that accretion shocks from inflow induced by tidal interaction with 3C 326 S may power the remarkable H2 emission spectrum.
Weak PAH emission features and thermal dust continuum in 3C 326 N and 3C 326 S indicate very little star formation activity yr-1. The weak star formation in 3C 326 N and low accretion luminosity of the AGN are remarkable considering the large amount and high surface density of molecular gas. Similar H2 emission seen in some ULIRGs is usually accompanied by vigorous starburst or AGN activity. The newly discovered molecular hydrogen emission galaxy (MOHEG) phenomenon may represent an important stage in galaxy evolution. Star-formation as well as accretion onto the central supermassive black hole may be suppressed by high temperatures, turbulence, or velocity shear in the large central mass of shocked molecular gas.
References
- Appleton et al. (2006) Appleton, P. N. et al. 2006, ApJ, 639, L51
- Armus et al. (2006) Armus, L. et al. 2006, ApJ, 640, 204
- Boulanger & Maillard (2007) Boulanger, F. & Maillard, J. P. 2007, in CUP Conf. Series, Studying Galaxy Evolution with Spitzer and Herschel, ed. V. Charmandaris, D. Rigopoulou, & N. Kylafis, in press
- Calzetti et al. (2007) Calzetti, D. et al. 2007, ApJ, in press, arXiv:0705.3377
- Combes, Young, & Bureau (2007) Combes, F., Young, L. M., & Bureau, M. 2007, MNRAS, 377, 1795
- Donahue et al. (2000) Donahue, M., Mack, J., Voit, G. M., Sparks, W., Elston, R., & Maloney, P. R. 2000, ApJ, 545, 670
- Draine & Woods (1990) Draine, B. T. & Woods, D. T. 1990, ApJ, 363, 464
- Egami et al. (2006) Egami, E., Rieke, G. H., Fadda, D., & Hines, D. C. 2006, ApJ, 652, L21
- Fazio et al. (2004) Fazio, G. G. et al. 2004, ApJS, 154, 10
- Haas et al. (2005) Haas, M., Chini, R., & Klaas, U. 2005, A&A 433, L17
- Hardcastle, Evans, & Croston (2006) Hardcastle, M. J., Evans, D. A., & Croston, J. H. 2006, MNRAS, 370, 1893
- Hatch et al. (2005) Hatch, N. A., Crawford, C. S., Johnstone, R. M., & Fabian A. C. 2005, MNRAS, 358, 765
- Higdon et al. (2006) Higdon, S. J. U., Armus, L., Higdon, J. L., Soifer, B. T., & Spoon, H. W. W., 2006, ApJ, 648, 323
- Houck et al. (2004) Houck, J. R. et al. ApJS, 154, 18
- Johnstone et al. (2007) Johnstone, R. M., Hatch, N. A., Ferland, G. G., Fabian, A. C., Crawford, C.S., & Wilman, R. J. 2007, in press (astro-ph/0702431)
- Kennicutt (1989) Kennicutt, R. 1989, ApJ, 344, 685
- Klaas et al. (1997) Klaas, U., Haas, M., Heinrichsen, I., & Schulz, B. 1997, A&A, 325, L21
- Krolik & Lepp (1989) Krolik, J. H. & Lepp, S. 1989, ApJ, 347, 179
- Le Bourlot et al. (1999) Le Bourlot, J., Pineau des Forets, G., & Flower, D. R. 1999, MNRAS, 305, 802
- Lilly & Longair (1984) Lilly, S. & Longair, M. S. 1984, MNRAS, 211, 833
- Lutz et al. (2003) Lutz, D., Sturm, E., Genzel, R., Spoon, H. W. W., Moorwood, A. F. M., Netzer, H., & Sternberg A. 2003, A&A, 409, 867
- Marconi & Hunt (2003) Marconi, A., & Hunt, L. K. 2003, ApJ, 589, L21
- Martel et al. (1999) Martel, A. et al. 1999, ApJS, 122, 81
- Max et al. (2005) Max, C., Canalizo, G., Macintosh, B. A., Raschke, L., Whysong, D., Antonucci, R., & Schneider, G. 2005, ApJ, 621, 738
- Mihos & Hernquist (1996) Mihos, C., & Hernquist, L. 1996, ApJ, 464, 641
- Netzer et al. (2005) Netzer, H., Lemze, D., Kaspi, S., George, I. M., Turner, T. J., Lutz, D., Boller, T., & Chelouche, D. 2005, ApJ, 629, 739
- Neufeld et al. (2006) Neufeld, D. A. et al. 2006, ApJ, 649, 816
- Ogle, Whysong, & Antonucci (2006) Ogle, P., Whysong, D., & Antonucci, R. 2006, ApJ, 647, 161
- Ogle, Antonucci, & Whysong (2007) Ogle, P. M., Antonucci, R., & Whysong, D. W. 2007, in ASP Conf. Ser., The Central Engine of Active Galactic Nuclei, ed. L. C. Ho & J.-M. Wang, in press, (astro-ph/0612443)
- Punsly (2005) Punsly, B., 2005, ApJ, 623, L9
- Punsly (2006) Punsly, B., 2006, ApJ, 651, 17
- Quillen et al. (2003) Quillen, A. C., Almog, J., & Yukita, M. 2003, AJ, 126, 2677
- Rawlings et al. (1990) Rawlings, S., Saunders, R., Miller, P., & Jones, M. E. 1990, MNRAS, 246, 21P
- Reynolds et al. (1996) Reynolds, C. S., Di Matteo, T., Fabian, A. C., Hwang, U., & Canizares, C. R. 1996, MNRAS, 283, 111
- Rieke et al. (2004) Rieke, G. H. et al. 2004, ApJS, 154, 25
- Rigopoulou et al. (2002) Rigopoulou, D., Kunze, D., Lutz, D., Genzel, R., & Moorwood, A. F. M. 2002, A&A, 389, 374
- Roussel et al. (2007) Roussel, H., 2007, ApJS, in press, arXiv:0707.0395
- Roussel et al. (2001) Roussel, H., Sauvage, M., Vigroux, L., and Bosma, A. 2001, A&A, 372, 427
- Shi et al. (2007) Shi, Y. et al. 2007, ApJ, submitted
- Simpson et al. (1996) Simpson, C., Ward, M., Clements, D. L., & Rawlings, S. 1996, MNRAS, 281, 509
- Smith et al. (2007) Smith, J. D., et al. 2007, ApJ, 656, 770
- Spinoglio & Malkan (1992) Spinoglio, L. & Malkan, M. 1992, ApJ, 399, 504
- Sturm et al. (2006) Sturm, E. et al. 2006, ApJ, 653, L13
- Voit (1991) Voit, M. 1991, ApJ, 379, 122
- Willis & Strom (1978) Willis, A. G. & Strom, R. G. 1978, A&A, 62, 375
- Wilgenbus et al. (2000) Wilgenbus, D., Cabrit, S., Pineau des Forets, G., & Flower, D. R. 2000, A&A 356, 1010
- Xu et al. (2003) Xu, C. K., Lu, N., Condon, J.J., Dopita, M., & Tuffs, R. J. 2003, ApJ, 595, 665
- Young et al. (1995) Young, J., Xie, S., Tacconi, L. et al. 1995, ApJS, 98, 219
| H2 S(0) | S(1) | S(2) | S(3) | S(4) | S(5) | S(6) | S(7) | |
|---|---|---|---|---|---|---|---|---|
| (m, rest) | 28.22 | 17.04 | 12.28 | 9.66 | 8.03 | 6.91 | 6.11 | 5.51 |
| FluxaaFlux ( erg s-1 cm-2). | 0.24(0.03) | 0.58(0.05) | 0.39(0.04) | 1.18(0.04) | 0.28(0.06) | 0.86(0.15) | 0.24(0.08) | 0.28(0.08) |
| EWbbEquivalent Width (m, rest). | 1.9(0.6) | 1.3(0.2) | 0.41(0.08) | 0.80(0.08) | 0.14(0.03) | 0.34(0.10) | 0.074(0.025) | 0.066(0.022) |
| Luminositycc Luminosity ( erg s-1), at a luminosity distance of 407 Mpc. | 0.48 | 1.1 | 0.77 | 2.34 | 0.55 | 1.7 | 0.48 | 0.55 |
| ddColumn Density (cm-2) of upper level divided by its statistical weight, assuming a source. | 9.2E18 | 2.8E17 | 3.8E16 | 6.9E15 | 1.3E15 | 4.4E14 | 1.5E14 | 2.7E13 |
| [Fe II] | [S IV] | [Ne II] | [S III] | [O IV] | |
|---|---|---|---|---|---|
| (m, rest) | 5.34 | 10.51 | 12.81 | 18.71 | 25.89 |
| FluxaaFlux ( erg s-1 cm-2). | 0.20(0.08) | 0.08(0.04) | 0.40(0.04) | 0.14(0.07) | 0.25(0.03) |
| Flux/[Ne II] | 0.5(0.2) | 0.2(0.1) | 1.0 | 0.4(0.2) | 0.6(0.1) |
| m) | 6.7 | 7.7 | 10.7 | 11.3 | 13.6 | 15.9 | 17 | 18.9 |
|---|---|---|---|---|---|---|---|---|
| 3C 326 N | 1.13(0.48) | 0.53(0.26) | 0.22(.09) | 0.64(0.13) | 0.98(0.18) | 0.21(0.11) | 1.15(0.27) | 0.33(0.18) |
| 3C 326 S | 1.61(0.42) | 1.19(0.20) |
| (24 m)aaFlux ( erg s-1 cm-2). | (70 m)bbFlux density (mJy) in the 70 m band, measured in a radius aperture and multiplied by an aperture correction of 1.5. | (160 m)ccThe upper limit to the 160 m flux density (mJy), measured in a radius aperture. | L(24 m)dd Luminosity ( erg s-1), at a luminosity distance of 407 Mpc. | L(70 m) | L(70)/L(24) | |
|---|---|---|---|---|---|---|
| 3C 326 N | 0.520.07 | 6.120.65 | 1.30.2 | 5.20.6 | 4.00.8 | |
| 3C 326 S | 1.050.12 | 4.330.60 | 2.60.3 | 3.70.5 | 1.40.3 | |
| bridgeeeThis source (only in the MIPS 70 m image) is found at roughly the location where the tidal bridge appears to connect to 3C 326 N (Fig. 5). | 4.400.60 | 3.80.5 |
| T(K) | (H2)aaFlux density (mJy) in the 24 m band, measured in a radius aperture and multiplied by an aperture correction of 2.0. | Ortho/Para | bbCritical density (cm-3). | ccMaximum filling factor under LTE conditions. |
|---|---|---|---|---|
| 125 | 1.1E9 | 2.1 | 5.3E2 | 1.5E-3 |
| 400 | 1.1E7 | 3.0 | 1.1E4 | 7.0E-7 |
| 1000 | 6.4E5 | 3.0 | 4.4E5 | 1.0E-9 |
| M(cold H2)aaH2 mass (). | M(warm H2)bbWarm H2 mass measured from Spitzer or ISO spectra. | ccH2 Luminosity (erg s-1). | ddThe IR luminosity is integrated over 8-1000 m. | Refs. | |
|---|---|---|---|---|---|
| Zw 3146 BCG | 0.014 | 1 | |||
| NGC 6240 | 0.003 | 2,3 | |||
| 3C 326 N | 0.04-0.1 | ||||
| Antennae | 0.0009 | 4,5,6 | |||
| Stephan’s Quintet | 0.34 | 7 |
References. — (1) Egami et al. 2006; (2) Lutz et al. 2003; (3) Armus et al. 2006; (4) Haas et al. 2005; (5) Young et al. 1995; (6) Klaas et al. 1997; (7) Appleton et al. 2006.