An infrared view of the EXor variables:
on the
case of V1118 Ori
††thanks: Based on observations mainly collected at the AZT-24 telescope
(Campo Imperatore, Italy)
Abstract
We investigate the relationship between the infrared observed properties of the EXor variables and the mechanisms active during their evolutionary stage typical of the pre-Main-Sequence phase.
To this aim we have constructed a catalog containing all the IR (1-100 m) photometric and spectroscopic observations appeared during the last 30 years in the literature. Moreover, new results of our monitoring program based on near- and mid-IR photometry, near-IR spectroscopy and polarimetry of one object (V1118 Ori) typical of the EXor class are presented, complementing those given in a previous paper and related to a different activity period.
Our catalog indicates how the database accumulated so far, stemming from a fortuitous monitoring of the stellar activity, is inadequate for any statistical study of the EXor events. Nevertheless, all the observational evidences can be interpreted into a coherent scheme. The sources that present the largest brightness variations tend to become bluer while brightening. The scenario of the disk accretion hypothesis based on the viscous friction between particles agrees with the observational evidences. The new results on V1118 Ori confirm such general view. The striking novelty is represented by a near-IR spectrum of V1118 Ori taken one year later the last monitored outburst: any emission line previously detected is now totally disappeared at our sensitivity. For the same source, mid-IR photometry is provided here for the first time and allows to construct a meaningful spectral energy distribution. The first polarimetric data indicate the source is intrinsically polarized and its spotted and magnetized surface becomes recognizable during the less active phases.
1 Introduction
Herbig (1989) noticed and listed eight pre-main sequence stars characterized by repetitive outbursts in optical light, referring them as EXors, after the example first recognized, EX Lup. Their outbursts have an amplitude up to 5 magnitudes, lasting one year or less, with a recurrence time of about 5-10 years. As for the FUor class, outbursts are explained in terms of disk accretion events (Hartmann, Kenyon & Hartigan 1993) which occur during an evolutionary phase between the main accretion phase and the beginning of the main sequence evolution. The EXor stage appears to follow the FUor one, more than being a less evident manifestation of the same phase (Lorenzetti et al. 2006 - Paper I); moreover EXors are less luminous than FUors and present different emission line spectra to those of FUors (which are dominated by absorption features). However, many observational evidences remain still unexplained: (i) the cause(s) of the short timescale (hours, day) variability, maybe linked to different time scales in the accretion processes; (ii) the (cor)-relations between optical-IR and X-ray behaviour, which can elucidate on how accretion regulates the coronal emission; (iii) whether the observed shape variations of the spectral energy distribution (SED) are related with different levels of activity; (iv) the presence and the influence of close companions.
The above considerations mainly stem from observations in the near- and mid-infrared (1-10 m), where the emission of the accreting disks is expected to peak. The IR studies are crucial during both inactive and active phases: in the former stages they allow us to investigate how the properties of the circumstellar matter prior the outburst will influence, through the accretion, the outburst itself; while, in the latter stages the same observations sample how the circumstellar material is altered by intermittent mass loss.
Unfortunately, both the scanty number of recognized EXors and the lack of an adequate database of photometric-spectroscopic multi-frequency observations are the consequence of a widespread concept, according to which long term monitoring programs are considered not rewarding; indeed, these projects appear as inadequate for large telescope equipped with fore-front instrumentation and remain a prerogative of small telescopes, where, however, a relevant fraction of astronomers do not invest their resources. To foster these monitoring programs on EXors, after having defined the EXors sample in Sect.2, we provide in Sect.3 a record of all the IR (1-100 m) photometric and spectroscopic observations reported in the last 30 years in the literature; in Sect.4 the observations of our monitoring of the EXor V1118 Ori are presented, complementing those already given in Paper I. Sect.5 is dedicated to discuss the results of the presented observations, while the concluding remarks are given in Sect.6.
2 The sample
| Target | (2000.0) | (2000.0) | Location | binary |
|---|---|---|---|---|
| XZ Tau | 04 31 40.07 | + 18 13 57.1 | L1551 | Y (0.30) |
| UZ Tau E | 04 32 42.96 | + 25 52 31.1 | B19 | Y (0.34) |
| VY Tau | 04 39 17.42 | + 22 47 53.4 | L1536 | Y (0.66) |
| DR Tau | 04 47 06.22 | + 16 58 42.9 | L1558 | N |
| V1118 Ori | 05 34 44.66 | - 05 33 41.3 | ONC | - |
| NY Ori | 05 35 35.79 | - 05 12 20.7 | ONC | - |
| V1143 Ori | 05 38 03.89 | - 04 16 42.8 | L1640 | - |
| EX Lup | 16 03 05.49 | - 40 18 25.3 | Lup 3 | N |
| PV Cep | 20 45 53.96 | + 67 57 38.9 | L1158 | - |
In Table 1 the list of the EXor variables known so far is given; the source XZ Tau has been added to the original Herbig’s list (1989) since it has been subsequently recognized as a potential candidate (Coffey, Downes & Ray 2004). Indeed, it is a binary system (Close et al. 1997) where the A (SE) component is separated by 0.3 arcsec from the B (NW) component.
In the same table is also given indication of the dark cloud to which the source belongs and whether or not a close companion has been found, providing in the affirmative cases the inter-distance in arcsec. The flux ratio in the IR regime between primary and secondary component has been recently measured (McCabe et al. 2006) only for VY Tau in the L band, and it equals to 6.1. The first seven columns of Table 2 summarize the relevant parameters (distance, visual extinction, luminosity, spectral type, range of visual magnitude variation) associated to any individual source; in the eighth column, the occurrence (or not) of mass loss phenomena in form of both jet and molecular outflow is pointed out.
| Target | Dist. | AV | Lbol | SpT | Vmax | Vmin | jet/outflow | Ref. |
|---|---|---|---|---|---|---|---|---|
| (pc) | (mag) | () | (mag) | |||||
| XZ Tau | 140 | 3: | 4.2 - 10.7 | M3 | 10.4 | 16.6 | Y | 1,2,3,4,5 |
| UZ Tau E | 140 | 1.49 | 1.7 | M1,3 | 11.7 | 15.0 | 1,3 | |
| VY Tau | 140 | 0.85 | 0.75 | M0V | 9.0 | 15.3 | 1,3,6 | |
| DR Tau | 140 | 1.7-2.1 | 1.05-5.0 | K7-M0 | 10.5 | 16.0 | 1,3,7,8 | |
| V1118 Ori | 140 | 0-2 | 1.4-25.4 | M1e | 14.2 | 17.5 | N | 1,9 |
| NY Ori | 400 | 0.3 | A0V | 14.5 | 17.5 | 1,10 | ||
| V1143 Ori | M | 13 | 19 | 1 | ||||
| EX Lup | 140 | 0.47 | M0.5 | 8.4 | 14.3 | 1,11,12 | ||
| PV Cep | 500 | 0.4-5 | 100 | A5e | 11.1 | 18.0 | Y | 1,13,14 |
Note. — References to the Table: (1) SIMBAD Astronomical Database (http://simbad.u-strasbg.fr/simbad); (2) Coffey, Downes & Ray 2004; (3) Herbig & Bell 1988; (4) Carr 1990; (5) Evans II et al. 1987; (6) Herbig 1990; (7) Cohen & Kuhi 1979; (8) Kenyon et al. 1994; (9) Paper I; (10) Breger, Gherz & Hackwell 1981; (11) Gras-Velázquez & Ray 2005; (12) Herbig et al. 2001; (13) Cohen et al. 1981; (14) Van Citters & Smith 1989.
3 IR catalog of EXors
In spite of the importance of the 1-10 m spectral region for
understanding the disk accretion processes, little information is
available about the steadiness of the IR emission from the EXor. In
this section all the literature data are compiled in form of a
catalogue. The catalogue includes all the IR (1-10 m)
observations known to us by December 2006. In Table 3,
for each EXor are given: (i) the date of the observation; (ii) the
results of the JHKLM photometry, where the errors (when available in
the original papers) are expressed in units of 0.01 mag in
parentheses, otherwise they can be assumed in the range
0.1-0.2 mag (JHK) and 0.2-0.3 mag (LM); (iii) the reference of the
observations, where the reader should be able to find the necessary
information for flux calibration, photometric system and effective
wavelengths. Table 4 is organized in the same way as
Table 3, but reports the photometry in the 8-13 m
range (N band), given as flux density (in Jansky) instead of
magnitudes. Such a spectral range has been arbitrarily divided into
five channels (each one 1 m wide), aiming to preserve the
differences which result from narrow band observations carried out
with different filters; however, when a single flux value
corresponds to a given date, it is obtained through wide band
photometry, whose effective wavelength usually falls in the (10-11)
m channel. The tables for converting magnitudes into flux
densities are given in the referenced papers. Table 5
lists the far-IR (12-100 m) photometry obtained by IRAS/MSX and
mention is given to the ISO (Infrared Space Observatory) detections.
Finally, Table 6 provides the indication and
reference to the available near-,
mid-IR spectroscopy or to the investigation of specific spectral features.
As explicitly indicated in the original papers, the observations
have been obtained with a large variety of focal plane
instrumentation. For the purpose of inter-comparing these data, one
has to be careful to not introduce spurious effects, which could
arise from the different photometric systems and/or from having
merged in the same catalogue the more recent data, obtained with IR
arrays, along with the older ones, obtained with
single-detector photometers equipped with larger focal plane
apertures.
The catalogued data may be useful to discriminate stages
of relative activity vs. inactiveness of the source, but, because of
the problems discussed above, they are not directly suitable for
constructing reliable light curves. Molinari, Liseau & Lorenzetti
(1993) provide a quantitative discussion about the data
inhomogeneity introduced by the difference of the various
calibration systems used during the early IR observations.
Some comments on the catalogued data: the 9 EXors have been
photometrically observed in the 1-10 m range on 88 occasions in
total, apart of a daily monitoring of DR Tau (44 observations by
Kenyon et al. 1994). Three objects (30 %) have been observed just 3
times in 30 years. A (quasi-)simultaneous entire SED (1-10 m)
has never been obtained, but in six occasions a partial coverage
(typically KLMN bands) has been gathered. The K-band photometry is
the one most frequently observed (about 70 % of the cases),
but individual sources have a relative low number (from 2 to 11) of
K magnitude determination.
| Target | Date | J | H | K | L | M | ref |
|---|---|---|---|---|---|---|---|
| XZ Taua | Dec 1972 - Apr 1974 | - | - | 7.3 | 5.45 | 4.2 | 1 |
| 1973 Oct 5 | 10.00 | 9.29 | 8.57 | 6.18 | - | 2 | |
| 1973 Nov 11 | - | - | 8.47 | 6.72 | 5.4 | 2 | |
| 1973 Dec 11 | - | - | 8.65 | 7.01 | 5.4 | 2 | |
| 1974 Oct 19 | 10.13 | 9.12 | 8.12 | 6.30 | - | 2 | |
| 1974 Nov 23 | 9.76 | 8.89 | 7.95 | 6.28 | - | 2 | |
| 1981 Dec 3 | 9.34 (2) | 8.16 (1) | 7.17 (1) | 5.85 (4) | - | 3 | |
| 1986 Dec 7 | - | - | 7.2 | - | - | 4 | |
| 1993 Oct 2 | 9.69 | 8.77 | 7.97 | - | - | 5 | |
| 1993 Dec 8-13 | - | - | 7.43 | - | - | 5 | |
| 1999 Nov 11 | 9.38 (2) | 8.15 (4) | 7.29 (2) | - | - | 6 | |
| UZ Tau E | Dec 1972 - Apr 1974 | - | - | 7.3 | 6.2 | - | 1 |
| 1976 Nov 1 | 8.72 | 7.83 | 7.26 | 6.29 | - | 7 | |
| 1976 Dec 18 | 8.45 | 7.60 | 7.02 | 6.40 | - | 7 | |
| 1977 Nov 4 | - | 7.97 (1) | 7.14 (1) | 6.04 (2) | - | 8 | |
| 1981 Jan 12 | - | - | 7.34 | 6.4 (10) | 5.6 (30) | 9 | |
| 1986 Nov 11 | - | - | 7.0 | - | - | 4 | |
| 1988 Jan 15 | 9.83 (2) | 8.46 (2) | 7.59 (2) | - | - | 10 | |
| 1990 Oct 8 | - | - | 7.3 | - | - | 11 | |
| 1997 Nov 30 | 9.14 (4) | 8.12 (1) | 7.35 (3) | - | - | 6 | |
| 2001 Dec 1 | - | - | 7.60 (10) | 6.78 (5) | - | 28 | |
| 2004 Mar 6 | - | - | - | 5.98 (3) | 5.46 (4) | 12 | |
| VY Tau | Dec 1972 - Apr 1974 | - | - | 8.65 | 8.6 | 5.2 | 1 |
| 1973 Oct 9 | 9.71 | 9.22 | 9.16 | - | - | 2 | |
| 1973 Dec 13 | - | - | 8.94 | 8.34 | - | 2 | |
| 1977 Nov 4 | - | 9.51 (1) | 9.03 (2) | 8.87 (13) | - | 8 | |
| 1981 Dec 2 | 10.03 (2) | 9.28 (2) | 8.97 (2) | 8.50 (6) | - | 3 | |
| 1990 Oct 5 | 10.13 | 9.40 | 9.08 | - | - | 13 | |
| 1993 - 1998 | 10.15 (29) | 9.50 (1) | 9.22 (18) | - | - | 14 | |
| 1998 Oct 3 | 9.97 (2) | 9.26 (2) | 8.96 (2) | - | - | 6 | |
| 2001 Dec 1 | - | - | - | 8.31 (9) | - | 28 | |
| DR Tau | Dec 1972 - Apr 1974 | - | - | 7.2 | 5.9 | - | 1 |
| 1973 Nov 12 | - | - | 7.47 | 5.85 | 5.0 (20) | 2 | |
| 1977 Nov 4 | - | 7.54 (1) | 6.21 (2) | 4.83 (5) | - | 8 | |
| 1981 Dec 2 | 8.79 (2) | 7.66 (1) | 6.65 (1) | 5.34 (4) | - | 3 | |
| 1981 Dec 3 | 8.54 (1) | 7.46 (1) | 6.45 (1) | 5.15 (4) | - | 3 | |
| 1981 Dec 16 | - | - | - | - | 4.17 | 9 | |
| 1986 Dec 5 | - | - | 6.9 | - | - | 4 | |
| 1987 Nov (7-24) | 8.58-9.07 | 7.48-7.92 | 6.48-6.91 | 5.01-5.32 | 4.47-4.69 | 15 - 20 obs. | |
| 1988 Sep (1-13) | 8.44-9.24 | 7.40-8.06 | 6.41-7.04 | 4.93-5.46 | - | 15 - 24 obs. | |
| 1996-1998 | 5.4 | - | 16 | ||||
| 1997 Oct 10 | 8.84 (2) | 7.80 (5) | 6.87 (1) | - | - | 6 | |
| 1998 May - 1999 Jan | 8.79-9.19 | - | 6.76-7.12 | - | - | 17 - 4 obs. | |
| 2004 Mar 5 | - | - | - | - | 4.50 (1) | 12 | |
| V1118 Ori | 1991-1993 | 12.21 (1) | 11.29 (1) | 10.49 (1) | - | - | 18 |
| 1994 Mar 15 | 8.52 (5) | 8.04 (4) | 7.94 (3) | - | - | 19 | |
| 2000 Nov 24 | 12.64 (2) | 11.51 (3) | 10.85 (2) | - | - | 6 | |
| 2005 Mar 20 | 11.16 (2) | - | 9.79 (1) | - | - | 20 | |
| 2005 Apr 3 | 10.79 (1) | - | 9.48 (1) | - | - | 20 | |
| 2005 Apr 15 | 10.94 (2) | - | 9.53 (1) | - | - | 20 | |
| 2005 Sep 6 | 11.08 (1) | - | 9.71 (2) | - | - | 20 | |
| 2005 Sep 11 | 11.23 (2) | 10.45 (1) | 9.85 (1) | - | - | 20 | |
| NY Ori | 1975 Sep 22-29 | - | 9.7 | 9.64 | 9.0 | - | 21 |
| 2000 Nov 24 | 9.75 (4) | 9.74 (3) | 9.73 (3) | - | - | 6 | |
| V1143 Ori | 1994 Mar 15 | 12.51 (17) | 11.79 (12) | 11.41 (12) | 22 | ||
| 1998 Oct 30 | 12.63 (2) | 11.96 (2) | 11.58 (2) | - | - | 6 | |
| EX Lup | 1972 Jun 5 | 9.76 (13) | 9.04 (14) | 8.82 (12) | 8.7 | - | 23 |
| 1982 Apr | 9.92 (1) | 9.11 (1) | 8.78 (1) | 8.05 (1) | 7.54 (5) | 24 | |
| 1999 May 16 | 9.73 (2) | 8.96 (2) | 8.50 (2) | - | - | 6 | |
| PV Cep | 1982 | 10.57 | 8.60 | 6.75 | - | - | 25 |
| 1984 | 10.39 | 8.32 | 6.76 | 4.63 | 3.76 | 26 | |
| 1992 Aug 6-8 | 9.39 (1) | 7.88 (2) | 6.44 (3) | - | - | 27 | |
| 1999 Sep 28 | 12.45 (2) | 9.50 (3) | 7.29 (1) | - | - | 6 |
Note. — References to the Table: (1) Cohen 1974; (2) Rydgren, Strom & Strom 1976; (3) Rydgren & Vrba 1983; (4) Tamura & Sato 1989; (5) Whitney, Kenyon & Gomez 1997; (6) 2MASS - Cutri et al. 2003; (7) Elias 1978; (8) Cohen & Kuhi 1979; (9) Rydgren et al. 1984; (10) Moneti & Zinnecker 1991; (11) Simon et al. 1992; (12) Hartmann et al. 2005; (13) Kenyon & Hartmann 1995; (14) Woitas, Leinert & Köhler 2001; (15) Kenyon et al. 1994; (16) Thi et al. 2001; (17) Eiroa et al. 2002; (18) Hillenbrand et al. 1998; (19) García et al. 1995; (20) Paper I; (21) Breger, Gehrz & Hackwell1 1981; (22) Mampaso & Parsamian 1995; (23) Glass & Penston 1974; (24) Appenzeller, Jankovics & Krautter 1983; (25) Lacasse 1982; (26) Neckel & Staude 1984; (27) Li et al. 1994; (28) McCabe et al. 2006.
| Target | Date | F(8-9)a | F(9-10) | F(10-11) | F(11-12) | F(12-13) | ref |
|---|---|---|---|---|---|---|---|
| XZ Tau | Dec 1972 - Apr 1974 | - | - | 6.3 | - | - | 1 |
| 1973 Nov 11 | 1.9 | - | - | 2.8 | 2.4 | 2 | |
| 1973 Dec 11 | 1.5 | - | - | 1.6 | 2.0 | 2 | |
| 1999 Nov 17 | - | - | 4.61 | - | - | 10 | |
| UZ Tau E | Dec 1972 - Apr 1974 | - | - | 1.6 | - | - | 1 |
| 1976 Nov 1 | - | - | 1.3 | - | - | 3 | |
| 1976 Dec 18 | - | - | 1.0 | - | - | 3 | |
| 1981 Jan 12 | 1.0 | - | 1.1 | 1.1 | 0.9 | 4 | |
| 1992 Dec 8 | 0.74 | 1.06 | - | - | 0.84 | 5 | |
| 1999 Nov 16 | - | - | 1.35 | - | - | 10 | |
| 2004 Mar 6 | 1.2 | - | - | - | - | 6 | |
| VY Tau | 1999 Nov 17 | - | - | 1.17 | - | - | 10 |
| DR Tau | Dec 1972 - Apr 1974 | - | - | 2.2 | - | - | 1 |
| 1973 Nov 12 | 1.1 | - | - | 1.3 | 1.5 | 2 | |
| 1981 Dec 16 | 3.8 | - | 3.8 | 3.4 | 3.1 | 4 | |
| 1982 Dec 20 | - | - | 2.9 | - | - | 4 | |
| 1996-1998 | - | 2.4 | - | - | - | 8 | |
| 2002 Dec 24-27 | - | - | - | 2.0 | - | 9 | |
| 2004 Mar 5 | 1.99 | - | - | - | - | 6 | |
| PV Cep | 1996-1998 | 9.1 | 8.0 | 10.1 | 14.0 | 15.3 | 7 |
Note. — References to the Table: (1) Cohen 1974; (2) Rydgren, Strom & Strom, 1976; (3) Elias 1978; (4) Rydgren et al. 1984; (5) Ghez et al. 1994; (6) Hartmann et al. 2005; (7) SWS: Acke & van den Ancker 2004;(8) Thi et al. 2001; (9) Przygodda et al. 2003; (10) McCabe et al. 2006.
| TargetaaIt is a binary system (see text), whose A component is slightly brighter in J band but fainter in K. As a consequence, near-IR data reasonably account for both sources and thus should be treated with enough care. F(-) indicates the flux (in Jansky) obtained at an effective wavelength in the range - m. | IRASbbCo-added flux densities and errors are given in Jy. | ref | ISOccOn board of ISO satellite: SWS (Short Wavelength Spectrometer - 3-45m); LWS (Long Wavelength Spectrometer 45-200m); PHT (Imager with spectroscopic capability 3-200m). | |||||
| 12m | 25m | 60m | 100m | SWS | LWS | PHT | ||
| UZ Tau E | 1.38 (0.03) | 1.76 (0.04) | 2.37 (0.07) | 1.2 (0.6) | 1 | - | - | - |
| VY Tau | 0.20 (0.03) | 0.29 (0.03) | 0.34 (0.04) | 1.2 (0.3) | 1 | - | - | - |
| DR Tau | 3.16 (0.03) | 4.30 (0.05) | 5.51 (0.04) | 7 (1) | 1 | 2 | - | - |
| NY Ori | 10 (3) | - | - | - | 1 | - | - | - |
| V1143 Ori | 0.17 (0.04) | 0.10 (0.06) | 2.7 (0.3) | 9 (3) | 1 | - | - | - |
| EX Lup | 0.71 (0.05) | 1.09 (0.03) | 1.25 (0.05) | 3 (2) | 1 | - | - | - |
| PV Cep | 13.27 (0.03) | 33.18 (0.04) | 51.87 (0.06) | 51.2 (0.2) | 1 | 3 | 4 | 3,5 |
| 13.4d | 23.4d | 40.3d | 51.0d | 6 | ||||
| Target | IR spectroscopic features |
|---|---|
| XZ Tau | near- (1); (8-13 m) sil.? (2); Pa, Br (3); Br, Br (4); (5-35 m) sil.? (22) |
| 2-4m (5); Br, H2 (6); Pa, Br (7); CO bands abs.(8); HeI, Pa (19) | |
| UZ Tau E | (8-13 m) sil.em. (2,23); near- (9); HeI, Pa (19); (5-35 m) sil.em. (22) |
| VY Tau | Pa (3); near- (1),(10); HeI, Pa (19); (5-35 m) sil.em. (22) |
| DR Tau | near-(1); Pa, Br (3); mid-(2); HeI (11); Pa, Br (7),(12); |
| H2 rot. - upp.lim. (13); (8-13 m) sil.em. (20); (5-35 m) sil.em. (22) | |
| V1118 Ori | near-, CO bands em. (14) |
| NY Ori | |
| V1143 Ori | |
| EX Lup | near- (15); (5-35 m) sil.em. (21) |
| PV Cep | Br, H2 (6); CO (8); SWS: 2-15m (16); [FeII] (17); 2-4m (5)(18) |
4 New observations of V1118 Ori
We present a set of new observations of V1118 Ori carried out in the optical and IR bands during the declining phase (from Oct. 2005 to Dec. 2006) that followed the last outburst occurred at the end of 2004. Complementary data that sample both the outburst phase and the beginning of the declining in the near-IR and X-ray regimes are given in Audard et al. (2005) and in Paper I; this latter provides also information since the first documented burst during the period 1982-1984.
4.1 I band polarimetry
The polarimetric observations were obtained in the I band during the period November 2005 - December 2006, with the photometer-polarimeter of the Astronomical Institute of St.Petersburg University mounted on the 70 cm telescope of the Crimean Observatory (Ukraine). This photometer is based on ST-7XME SBIG CCD and provides a polarimetric mode by means of two Savart plates, rotated by 45∘ one relative to another and used as analyzer, giving and Stokes parameters. The pixel scale is 0.64 arcsec/pxl which corresponds to a 8.15.4 arcmin2 field of view. Within this field the star located 80 arcsec to the North of V1118 Ori was also sampled as a reference. With the same equipment the BVRI photometric data were obtained as well; they confirm in the four visual bands the V-band results presented by García, Parsamian & Velazquez (2006) and are not presented in this paper which is more oriented to the IR properties of EXors.
4.2 Near-IR photometry
Near-IR data were obtained at the 1.1 m AZT-24 telescope located at Campo Imperatore (L’Aquila - Italy) equipped with the imager/spectrometer SWIRCAM (D’Alessio et al. 2000), which is based on a 256256 HgCdTe PICNIC array. Photometry is performed with broad band filters J (1.25 m), H (1.65 m), and K (2.20 m). The total field of view is 4.44.4 arcmin2, which corresponds to a plate scale of 1.04 arcsec/pixel. All the observations were obtained by dithering the telescope around the pointed position. The raw imaging data were reduced by using standard procedures for bad pixel removal, flat fielding, and sky subtraction. The photometric data are presented in Table 7. Several comparison stars are available within the 4.4 SWIRCAM field; their magnitudes result stable within 0.01 mag in JHK during the period of our observations; in particular one of them is used to construct the near IR light curves in terms of differential photometry given in Figure 1.

| UT date | MJDa | Jb | H | K | [J-H] | [H-K] |
|---|---|---|---|---|---|---|
| 05 Oct 26 | 53669 | 11.46 | 10.52 | 9.92 | 0.94 | 0.60 |
| 05 Nov 03 | 53677 | 11.16 | 10.34 | 9.71 | 0.82 | 0.63 |
| 05 Nov 04 | 53678 | 11.27 | 10.41 | 9.74 | 0.86 | 0.67 |
| 05 Nov 08 | 53682 | 10.78 | 10.04 | 9.47 | 0.74 | 0.57 |
| 05 Nov 09 | 53683 | 11.03 | 10.23 | 9.61 | 0.80 | 0.62 |
| 05 Nov 10 | 53684 | 10.96 | 10.18 | 9.60 | 0.78 | 0.58 |
| 06 Sep 06 | 53984 | 12.63 | 11.61 | 10.97 | 1.02 | 0.64 |
| 06 Sep 07 | 53985 | 12.62 | 11.62 | 10.97 | 1.00 | 0.65 |
| 06 Sep 11 | 53989 | 12.66 | 11.66 | 10.98 | 1.00 | 0.68 |
| 06 Sep 22 | 54000 | 12.63 | 11.57 | 10.82 | 1.06 | 0.75 |
| 06 Sep 23 | 54001 | 12.54 | 11.51 | 10.74 | 1.03 | 0.77 |
| 06 Sep 24 | 54002 | 12.63 | 11.57 | 10.78 | 1.06 | 0.79 |
| 06 Sep 25 | 54003 | 12.59 | 11.55 | 10.78 | 1.04 | 0.77 |
| 06 Sep 27 | 54006 | 12.62 | 11.60 | 10.85 | 1.02 | 0.75 |
| 06 Sep 28 | 54007 | 12.67 | 11.63 | 10.89 | 1.04 | 0.74 |
| 06 Sep 29 | 54008 | 12.66 | 11.65 | 10.92 | 1.01 | 0.73 |
| 06 Sep 30 | 54009 | 12.65 | 11.60 | 10.91 | 1.05 | 0.69 |
| 06 Oct 01 | 54010 | 12.63 | 11.61 | 10.91 | 1.02 | 0.70 |
| 06 Nov 15 | 54054 | 12.66 | 11.67 | 11.03 | 0.99 | 0.64 |
| 06 Nov 16 | 54055 | 12.69 | 11.69 | 11.06 | 1.00 | 0.63 |
| 06 Nov 19 | 54058 | 12.66 | 11.64 | 10.97 | 1.02 | 0.67 |
| 06 Nov 20 | 54059 | 12.69 | 11.65 | 10.98 | 1.04 | 0.67 |
| 06 Nov 24 | 54063 | 12.57 | 11.54 | 10.91 | 1.03 | 0.63 |
| 06 Nov 26 | 54065 | 12.74 | 11.72 | 11.04 | 1.03 | 0.68 |
| 06 Nov 28 | 54067 | 12.60 | 11.61 | 10.92 | 0.99 | 0.69 |
| 06 Nov 30 | 54069 | 12.61 | 11.62 | 10.94 | 0.99 | 0.68 |
| 06 Dec 02 | 54071 | 12.69 | 11.67 | 10.97 | 1.02 | 0.70 |
| 06 Dec 06 | 54075 | 12.69 | 11.69 | 11.00 | 1.00 | 0.69 |
| 06 Dec 08 | 54077 | 12.63 | 11.64 | 10.93 | 0.99 | 0.71 |
| 06 Dec 12 | 54081 | 12.70 | 11.68 | 11.01 | 1.02 | 0.67 |
| 06 Dec 14 | 54083 | 12.60 | 11.59 | 10.92 | 1.01 | 0.67 |
Note. — References to the Table: (1) Weaver & Jones 1992; (2) Thi et al. 2001; (3) Acke & van den Ancker 2004; (4) Lorenzetti et al. 1999; (5) Ábrahám et al. 2000; (6) Elia et al. 2005.
Note. — References to the Table: (1) Folha & Emerson 1999; (2) Cohen & Witteborn 1985; (3) Folha & Emerson 2001; (4) Evans et al. 1987; (5) Sato et al. 1990; (6) Carr 1990; (7) Giovanardi et al. 1991; (8) Biscaya et al. 1997; (9) Elias 1978; (10) Greene & Lada 1996; (11) Edwards et al. 2003; (12) Muzerolle, Hartmann & Calvet (1998); (13) Thi et al. 2001; (14) Paper I; (15) Herbig et al. 2001; (16) Acke & van den Ancker 2004; (17) Hamann et al. 1994; (18) van Citters & Smith 1989; (19) Edwards et al. 2006; (20) Przygodda et al. 2003; (21) Kessler-Silacci et al. 2006; (22) Furlan et al. 2006; (23) Honda et al. 2006.
4.3 Near-IR spectroscopy
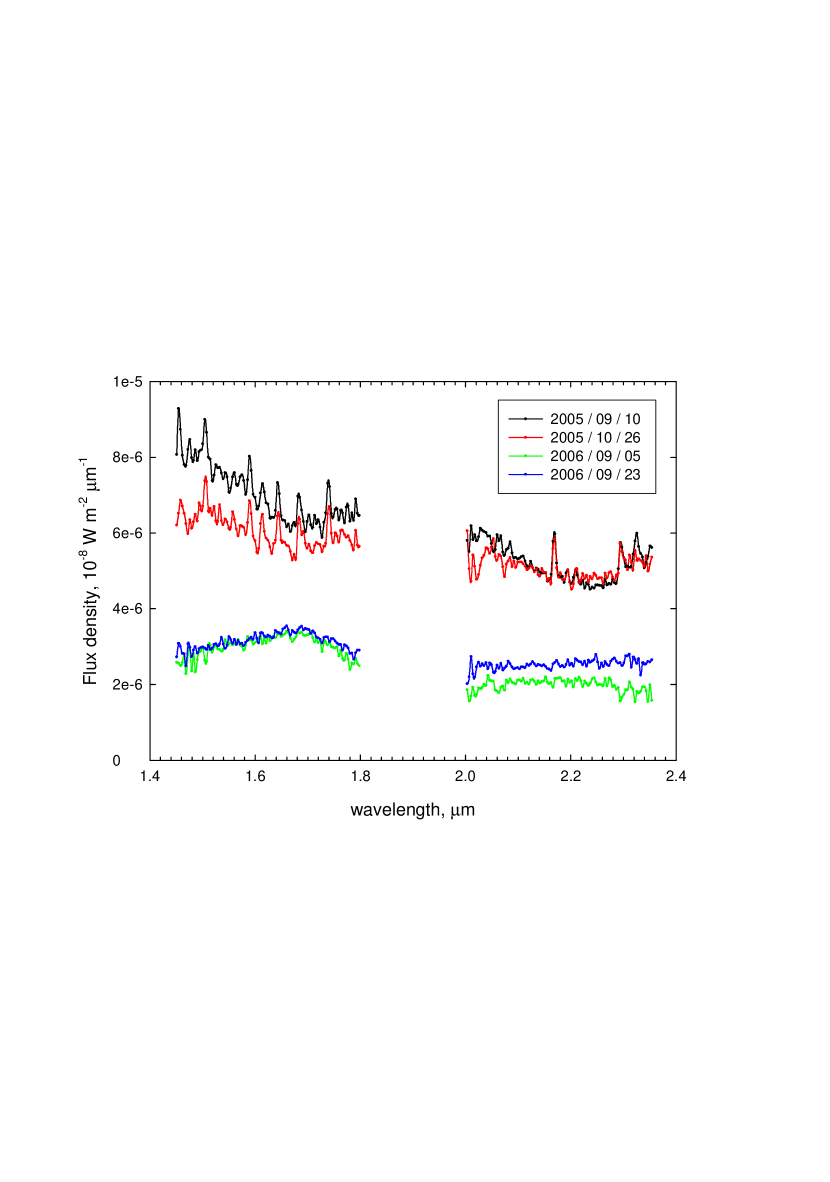
Low resolution ( 250) spectroscopy has been obtained with the same instrument (SWIRCAM) described above, by means of two IR grisms Gblue and Gred covering the ZJ (0.83 - 1.34 m) and HK (1.44 - 2.35 m) bands, respectively. The long slit is not orientable in position angle, and it samples a portion of the focal plane, 2260 arcsec2 in the east-west direction.
Long-slit spectroscopy was carried out in the standard ABBA mode with a total integration time of 800 sec. The observations were flat-fielded, sky-subtracted, and corrected for the optical distortion in both the spatial and spectral directions. Atmospheric features were removed by dividing the extracted spectra by that of a normalized telluric standard star, once corrected for its intrinsic spectral features. Wavelength calibration was derived from the OH lines present in the raw spectral images, while flux calibration was obtained from our photometric data.
We obtained a second near-IR spectrum on 2005 October 26, namely fifty days later than the first-one (on 2005 September 10, see Paper I), covering the band from 0.8 to 2.3 m, although in Figure 2 is depicted only the HK portion. Although the second spectrum appears more noisy, all the emission features (from Hydrogen recombination and other ionic and molecular species) identified in the first spectrum are very well recognizable and do not show any flux variation within the errors.
However, the real novelty is represented here by a third spectrum (2006 September 5) taken one year later, covering just the HK part of the near-IR band and shown in Figure 2 together with the previous spectra. Surprisingly, no emission line is detected, at our sensitivity, and the continuum shows a redder shape. At our knowledge, such a dramatic variation was never observed before in an EXor source. Moreover, a confirmation to this featureless appearance is provided by a fourth spectrum, acquired a couple of weeks later and depicted in Figure 2, as well.
4.4 N-band imaging
Imaging in the N10.4 broadband filter was carried out on January 2006 with TIMMI2 (Saviane & Doublier 2005) at the 3.6m ESO telescope (La Silla, Chile). The adopted plate scale is 0.3 arcsec/pxl corresponding to a 96 72′′ field of view. The observations were obtained by chopping the signal and by nodding and jittering the telescope around the pointed position in the usual ABB′A′ mode. The raw data were reduced by using standard procedures for bad pixel removal, flat fielding, and sky subtraction. The observed field was flux calibrated by using the photometric standard star HD29291. The only two objects present in the field are V1118 Ori and the brighter source V372 Ori, located 47 arcsec in the SE direction; both present a point-like appearance without any sign of diffuse emission. The photometric results are given in Table 8. In the same Table other observations are presented: they consist of both Spitzer photometry at 4.5 and 8.0 m, that we have obtained by reducing maps from that archive and MSX data (Paper I), listed for completeness. In this respect is noticeable that the Spitzer IRAC 4.5 m channel contains several H2 lines that are commonly excited in shocked molecular gas (e.g. Smith 1995). Hence, the lack of any detectable 4.5 m emission in the proximity of V1118 Ori, provides a further clue to exclude this star as the driver of a molecular jet.
Those presented in Table 8 are the first observations of V1118 Ori in the mid-IR. Although these data refer to different effective wavelengths and different epochs, ground-based values agree with Spitzer data, but they are largely lower than IRAS/MSX determinations. These discrepancies have been remarked several times in the literature concerning YSO’s (e.g. Walsh et al. 2001) and may be due to the larger environmental contamination suffered by the larger IRAS/MSX beams.
| object | UT date | MJDa | Band | Flux (Jy) |
|---|---|---|---|---|
| V1118 Ori | 06 Jan 12 | 53747 | N(10.4 m) | 0.07 0.01 |
| 04 Oct 27 | 53005 | Spitzer 8.0m | (52.70 0.03) 10-3 | |
| 04 Oct 27 | 53005 | Spitzer 4.5m | (42.91 0.03) 10-3 | |
| (9.05 mag) | ||||
| 02 Jan 09 | 52283 | MSX 8.28m | 0.3 | |
| 02 Jan 09 | 52283 | MSX 12.13m | 0.5 | |
| V372 Orib | 06 Jan 12 | 53747 | N(10.4 m) | 1.97 0.03 |
| 02 Jan 09 | 52283 | MSX 8.28m | 2.8 | |
| 02 Jan 09 | 52283 | MSX 12.13m | 3.1 | |
| - | - | IRAS 12m | 5.0 |
5 Results and discussion
5.1 Catalogue results
5.1.1 Near-IR spectroscopy
The correlation of the line emission variability during the outburst/quiescence stages and the stellar properties of the source is crucial to understand the physical mechanism(s) active during the EXor evolutionary phase.
By examining the near-IR EXor spectra appeared sofar in the literature (see Table 6), a systematical study of the emission line variability results unaffordable in terms of neither intensity nor profile. This derives from both the lack of any spectroscopical monitoring and the variety of different ways exploited to obtain, reduce and (un)calibrate the spectra. Nevertheless two exceptions exist: two objects (XZ Tau and PV Cep) show significant Br flux variations (by a factor of two or more) on timescale of years or less. In XZ Tau, F(Br)= 2.1 0.6 10-13erg s-1cm-2 (Nov. 1983 - Evans et al. 1987), 0.42 0.06 and 0.9 0.1 in the same units, in 1986-87 and 1988-89, respectively (Carr 1990; Giovanardi et al. 1991). In PV Cep, while F(Br) varied from 0.44 0.05 (Jul. 1986 - Carr 1990) and 0.8 0.1 (Oct. 1986 - Carr 1990), F(2.12m) remained constant (0.33 0.05 and 0.36 0.1) in the same two occasions. This result thus suggests that HI recombination should be more prompt than molecular material to response to accretion events, or even more adequate to trace them. Unfortunately, XZ Tau and PV Cep were not observed photometrically in that periods, so that any correlation between spectral behaviour and brightness status is prevented.
Near-IR spectra of all the EXors present similar features: they are emission line spectra usually dominated by the hydrogen recombination (Brackett and Paschen series), which signals the presence of ionized gas close to the star. CO overtone emission v=2-0, v=3-1 is commonly detected along with weaker atomic features (e.g. MgI at 1.503 m and NaI at 2.208 m). The observed spectra are much more similar to those of the accreting T Tauri stars (Greene & Lada 1996) than the FUor ones (Reipurth & Aspin 1997), apart a couple of exceptions.
Remarkably, some photospheric absorption lines (mainly atomic) detected in EXor and other young accreting objects, that are used to estimate the near-IR veiling, are sometimes observed in emission. Such circumstance, already noted in Paper I, has been interpreted as a clue that chromospheric emission lines more than a continuum source are the cause of the veiling (Fohla & Emerson 1999).
5.1.2 Near-IR colours vs. K magnitude
The aim of this section is to investigate whether or not a
recognizable trend exists among the EXors to become bluer (or
redder) while they dim; in other words to present a variable SED (in
the near-IR) moving from a flat to a more peaked one (or vice versa)
while the source is progressively fading. The answer should help in
clarifying the mechanism(s) which are active during the outburst
phases. The analysis of individual objects (e.g. Kenyon et al. 1994;
Lorenzetti et al. 2006) allows to recognize a trend toward the
blueing. Now, to provide a statistically significant sample of
data, we use the catalog listed in Table 3 to construct
near-IR colour vs. magnitude diagrams. All of them show a
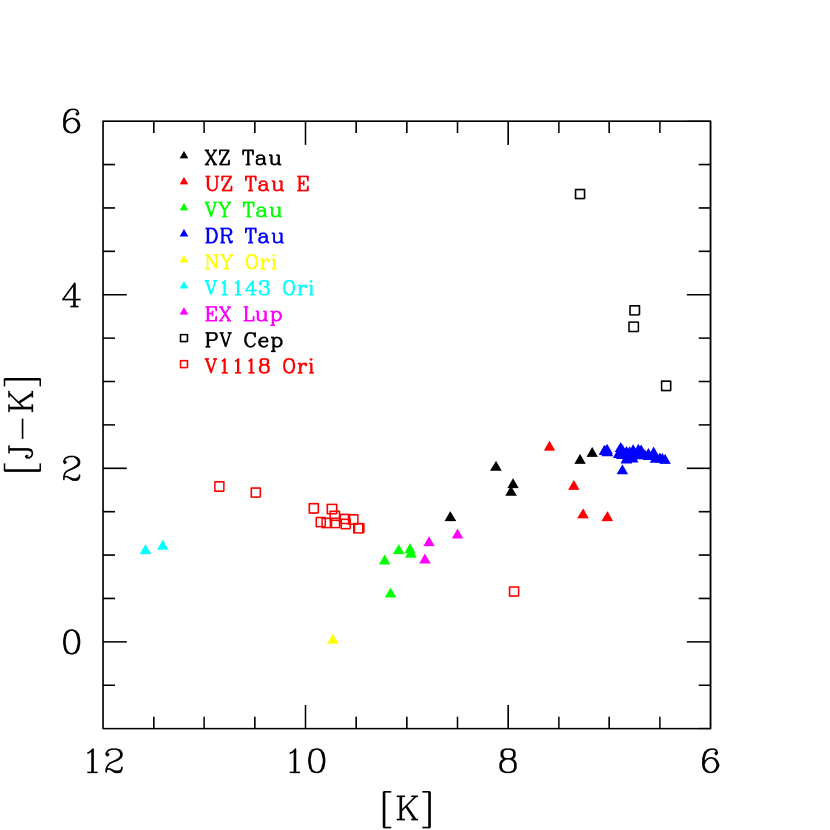
similar behaviour, so we give in Figure 3 the [J-K] vs.
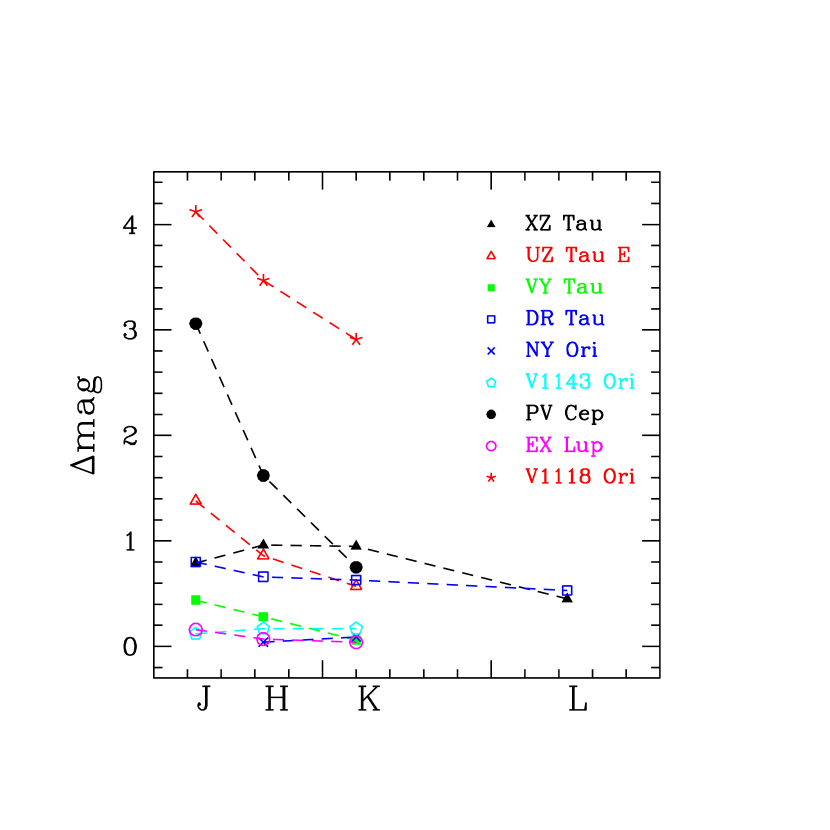
K plot as a typical example. Additionally, Figure 4
depicts for each source the magnitude difference ( =
mag(min) - mag(max)), as a function of the wavelength, between the
two epochs corresponding to the maximum and minimum flux in the J
band (arbitrarily chosen). Bias effects could be introduced if
different brightness variations were attributable to substantially
different time-scales for the various sources, but looking at the
dates of the observations (Table 3), the sampling times
seem quite similar (typically months, years), thus the occurrence of
peculiar time-scales can be ruled out.
(i) from Figure 4 we see that a substantial brightness variation (mag above the 1mag level) has been clearly observed only in two sources, namely V1118 Ori and PV Cep, and marginally in UZ Tau E. Such result is a direct consequence of the random plans of the IR observations: indeed, while V1118 Ori has been monitored to probe brightness variations, all the other sources were not observed systematically, hence the observed photometric variation (mag 1) represents just a lower limit to the intrinsic amplitude.
The presented observational scenario, being a direct consequence of the random plans of the IR observations, does not reflect any peculiar property of that couple of sources; indeed, all the EXors underwent large (mag 4) optical variations (see Table 2) typical of the class, that were not monitored the IR band.
(ii) Irrespectively of the source brightness (from 12 to 7 mag in K band, see Figure 3) the amplitude of the [J-K] colour variations is substantially similar (about 1 mag) for all the sources with respect to a mean value of about 1.5-2.0 mag: PV Cep, sometimes also classified as an Herbig or a FUor star, represents the only exception.
(iii) EXors do not behave all in the same way: while becoming fainter (see Figure 3), some sources tend to become bluer or not to exhibit a definite colour trend (V1143 Ori, EX Lup, DR Tau, XZ Tau, VY Tau); while others become definitely redder (V1118 Ori, PV Cep, UZ Tau E). Noticeably, these are the same three sources for which the full amplitude of the IR variation has been observed (see above). Thus, it seems that only during the outburst phase a peak at a relatively high temperature becomes more and more evident (blueing). In the other sources colder contributions typical of a disk temperature stratification prevail.
(iv) extinction variations are to be ruled out since the very low values of AV (1-2 mag, see Table 2).
Summarizing, the present view tends to identify the EXOrs appearance during the active phase with that of the classical T-Tauri stars. This issue will be discussed in more detail in Sec.5.1.4. at the light of the EXor complete SED’s, including the mid- and far-IR contributions, as well.
5.1.3 N band data
The observations in the N band (8-13 m) given in Table 4 are quite sparse and almost never simultaneous with the near-IR ones. Nevertheless two facts can be pointed out:
1) in few occasions, K and N band observations can be considered quasi-simultaneous (in the sense that both are carried out within one month) with respect to the time scale of the EXor variations. By comparing K and N variations, they appear quite correlated within the errors.
2) A very crude evaluation of the [K-N] colour indicates values for all the sources that range between 4 and 7, typical of thick disks. Remarkably, any EXor exhibits a [K-N] colour between 0 and 1, which is typical of normal Main Sequence stars. This finding confirms a known result (e.g. Strutskie et al. 1990), according to which the transition phase between the thick disk stage and the end of the active disk survival could be very fast.
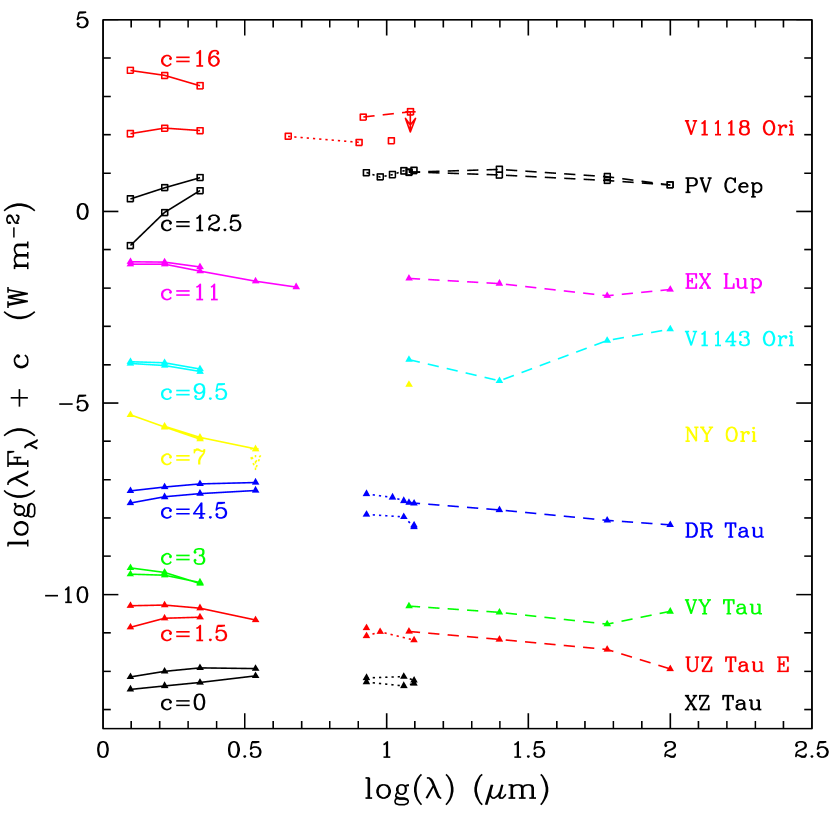
5.1.4 Far-IR data
A summary of all the literature far-IR data (12-100 m) of EXors is given in Table 5. Any evaluation for possible far-IR variability is prevented at the moment, since a single observation per source is available from the IRAS and MSX database. Only for PV Cep a second observation (about 15 years later) was obtained by combining the ISO spectrophotometry with IRAS bandpasses; no significant variation seems to occur in this wavelength range. The far-IR data are useful to construct comprehensive SED’s over a wide (2 decades) band where EXors are expected to emit a large part of their power. These are given in Figure 5: two determinations, mainly in the near-IR (1-5 m solid line), correspond to the maximum and minimum observed brightness; mid-IR ground-based observations (8-13 m dotted lines) partially overlap with the IRAS/MSX data (12-100 m dashed line); when connected, the data points refer to the same epoch. The ground-based mid-IR photometric values, although carried out in different occasions, are equal to or weaker than the IRAS 12 m fluxes, that could be contaminated by diffuse circumstellar emission. Mid-IR data are also characterized by a certain degree of variability quite comparable with the near-IR one. As already commented in Sec.5.1.2, only the sources V1118 Ori, PV Cep and UZ Tau E present a SED which tends to peak at shorter wavelength during the outburst, when the brightness increases. The remaining sources that show some variations do not change their SED slope. In essence, only during the active burst phase the EXor SED seems to look like the T Tauri averaged SED (D’Alessio et al. 1999), while for the remaining time EXors show a flatter spectral distribution more typical of a disk temperature stratification.
5.1.5 Catalog data viewed in a phenomenological framework
The results derived from the catalog data (see Sect. 5.1.2, 5.1.3 and 5.1.4), although not obeying to any observational strategy, can be still referred to a comprehensive interpretation. Indeed, an active disk can show two types of instabilities: dynamical and thermal. While the former (Adams & Lin 1993) are unlikely responsible for the observed time-scale of the photometric variations, the latter (Hartmann, & Kenyon, 1985) offer a more acceptable explanation. The disk accretion hypothesis is based on the viscous friction between particles with different velocities. The efficiency of this coupling is an increasing function of the temperature: in fact a local increase of the temperature augments the viscosity, the efficiency of transferring angular momentum, the accretion rate and, again, the disk temperature. Depending on the characteristics of the initial perturbation, it will propagate along the whole disk or will become exhausted before. According to this scheme, the predicted IR spectral shape of the continuum emitted by the disk is characterized by an initial brightening at a given wavelength which is different depending on the distance (from the disk center) at which the perturbation onsets. By assuming an onset around 10 m, the source tends to become initially redder, but while the propagation is going toward the center, the source becomes bluer and bluer and the power emitted at smaller wavelengths becomes progressively larger. This picture agrees quite reasonably with the observational evidences: only when the outburst phase is fully sampled we are able to see the blueing while brightening, otherwise we can see just smaller amplitude variations showing a barely defined (bluer or redder) trend.
5.2 New results on V1118 Ori
5.2.1 Near-IR photometry
The near-IR photometric data listed in Table 7 and shown in Figure 1 agree quite well with the light curve of the outburst recently monitored in the V band (Garcia, Parsamian & Velazquez 2006). Our data indicate that the post-outburst phase has been sampled only during the short period between October and November 2005 (Figure 1), characterized by irregular fluctuations without any superposition of an appreciable fading trend. The further declining down to the lowest level of IR intensity has remained undetected, while the subsequent monitoring between September and December 2006 (bottom part of Table 7 and right panels of Figure 1) has been performed once the quiescent phase was already reached (likely around May-June 2006, as deduced by extrapolating the visual light curve). The near-IR monitoring allows us to state some observational facts: (i) the quiescent phase of V1118 Ori corresponds to mag levels of about 12.7, 11.7 and 11.0, in the bands J, H and K, respectively. (ii) The dispersion around the quiescence mean value is significantly smaller (e.g. 0.04 mag in the J band) with respect to the value (0.20 mag) derived during the previous fading phase. This circumstance suggests that quiescence is a much more stable phase than declining, which is accompanied by significant and irregular magnitude variations (0.5 mag or more, see left panels of Figure 1) on a daily time-scale. Such a behaviour signals a reduced level of activity during the quiescence and hence the existence of some correlation between the mechanism(s) responsible for both the outburst and the short time-scale activity. If, as widely accepted, the accretion rate variation regulates the outburst occurrence, then our results support the hypothesis that this mechanism also regulates the irregular and rapid variations and it is indeed dynamical on (at least) two time-scales, namely months and days. (iii) The colours [J-H] and [H-K] corresponding to the quiescent phase have reached once again their maximum values of 1.0 and 0.7 mag, respectively, already indicated as typical of the quiescence during the year 2000 (Paper I). This means that V1118 Ori has a periodical behaviour, namely tends to show always the same colours in the same phase, even if in different epochs. Moreover, these observations definitely confirm that the object becomes redder when fading (as already indicated in Figure 3 and discussed in Sect.5.1.2).
5.2.2 Near-IR spectroscopy
The real asset among this data set collected after Paper I is
certainly represented by the third near-IR spectrum, taken in 2006
September, namely one year later than the first two. As illustrated
in Figure 2 (green plot) it does not show (
at our sensitivity) the presence of any emission line, as if V1118
Ori were apparently become a featureless object once its quiescent
phase has been reached. Such a behaviour is confirmed by the fourth
spectrum taken 18 days later (blue plot). By considering the maximum
line flux detected in the first spectrum within the range 1.44 -
2.35 m, namely the value 1.2 0.2 10-13erg
s-1cm-2 relative to the Br transition (see Paper
I), and the more recently detected 3 upper limit (0.2
10-13erg s-1cm-2) measured at the Br
frequency, we obtain that the line emission has faded by more
than a factor of 6. The only spectral feature still
present in the third spectrum is the 2.3 m CO band (2-0) now
seen in absorption. This feature is totally absent in the fourth
spectrum. This occurrence is surprising since the first two spectra
taken one year before, when the source was brighter of about 1.5
mag, presented the same features, but in emission at a S/N level of
4 (see Figure 2).
A couple of similar cases of spectral variations occurred in more
embedded YSO’s, not related to external phenomena (e.g. variable
extinction or binary occultation), but indicative of changes in the
physical conditions of the star and its circumstellar environment,
have been discussed in the literature. The source NGC2024 IRS2 had a
burst of its IR continuum of about one magnitude and a simultaneous
brightening in HI recombination line intensities together with a
large velocity shift (50-70 km s-1) in the line emission
(Nisini et al. 1994). More recently, different outburst phases of
the source V1647 Ori have been monitored by means of near-IR
spectroscopy (Gibb et al. 2006), demonstrating how the post-outburst
phase is characterized by a declining temperature of the hot CO gas
formed in the inner part of the disk, and by a substantial decrease
of the fast
wind.
The disappearing of all the emission lines at our sensitivity is indeed quite dramatic and remains a very rare case of a directly documented spectral variation. Nevertheless, such an event can be easily accounted for in the currently accepted framework which describes the EXors phenomenology.
The recurrent outbursts are interpreted (see also Sect.5.1.5) as
caused by variable mass accretion. A suddenly increase of the
accretion rate forces the disk to re-radiate with a consequent
brightening of the IR continuum. The same accretion event
regulates also the mass loss rate which is strictly related to the
accretion rate (e.g. Shu al. 1994); it determines an intermittent
mass loss monitored by observing the alternate appearance and
disappearance of emission lines and molecular (CO) bands that
originate, respectively, in the ionized and neutral component of the
stellar wind. Concerning the CO variability, Biscaya et al. (1997)
investigated this topic and their results indicate that the majority
of the YSO’s with CO bands in emission are variable on time-scales
as short as a few days (DG Tau even periodically). Therefore, in
this respect, V1118 Ori does not represent an exception, although
our data tend to exclude CO variability on short time-scales. A
systematical monitoring of the CO variability has been never
afforded to date, however, Biscaya et al. (1997) consider the
different models able to account for CO emission vs. absorption. All
of them are based on accretion processes on circumstellar disk, but
their predictions are often conflicting: the spectra presented here
tend to support those models where an increasing accretion rate may
lead to a significant increase of UV radiation in the accretion
shock that will heat the surface layer
of the disk, so favoring CO emission.
The shape of the continuum is also remarkable
(Figure 2) since confirms once again (see Sect.
5.1.2) an intrinsic reddening of V1118 Ori as it fades.
Finally, the two near-IR spectra of V1118 Ori (taken in 2005) do not show any clue of line emission variability on 50 days time-scale. The repeatability of the second near-IR spectrum provided us the opportunity to identify emission lines that, although present in the first spectrum as well, were not mentioned in Paper I because appeared weak and/or blended features. The list of these newly identified lines is given in Table 9 where the line fluxes (computed on the first spectrum) are given only for those having S/N 3. Similarly to those identified in Paper I, also these additional features are all characteristic of the ionic emission component typical of T Tauri stars.
5.2.3 Polarization
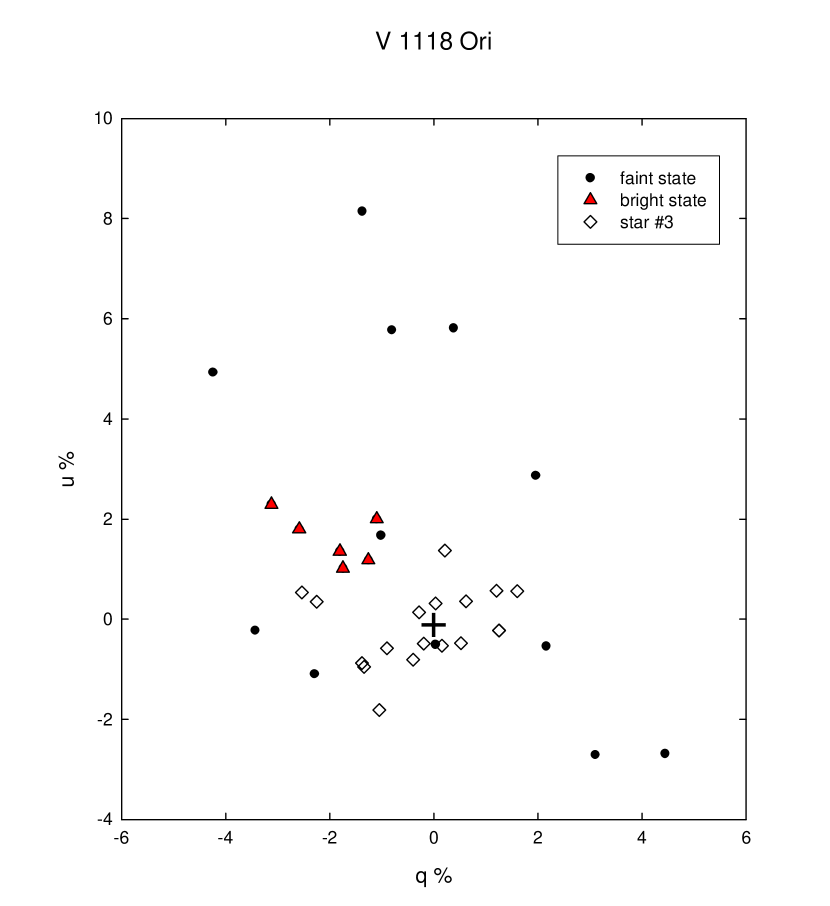
The results of our polarimetric monitoring performed in the I band are given in Table 10; data were also obtained for a source located 80 arcsec to the North of V1118 Ori (indicated in that Table as reference star). The behaviour of the normalized Stokes parameters is depicted in Figure 6, where different symbols are related to a fainter state (14-15 mag in I band), a brighter (12-13 mag) state of V1118 Ori, and the reference star, which has approximately the same brightness as V1118 Ori in the fainter state.
The difference between V1118 Ori and the reference star is noticeable. The parameters distribution of the latter is scattered around the origin, substantially showing a lack of any intrinsic polarization. On the contrary, the u,q values corresponding to the brighter state of V1118 Ori are definitely less scattered, certainly displaced from (0,0) position and give indication of a substantial polarization (p = 2.5% 0.4% and = 64 4). Such polarization is likely intrinsic, since an interstellar origin is not compatible with the low reddening (AV 1-2 mag, see Paper I). Also scattering by dust lost by the star during previous outbursts tend to be ruled out by the same argument. According to the previous discussion (Sect.5.1.5), when the star+disk system fades, it is expected to come back to the original and stationary pre-outburst status provoking also a wind decreasing and, consequently, we can see the real heavily spotted and magnetized photosphere. This could be the reason for having detected high and variable values of polarization during the fainter state (Figure 6).
Our data suggest that short time-scale variability might be associated to variations in polarization. Wood et al. (1996) investigated the photo-polarimetric variability of a magnetic accretion disk model for pre-main-sequence T Tauri stars. In their model the matter from the disk accretes along the magnetic field lines onto the stellar surface producing hot and polarized spots; stellar rotation causes the photometric and polarimetric variations; these latter are also caused by the scattering from the disk. At the present status, a direct comparison with model predictions is difficult since the behaviour of V1118 Ori is not so straightforward: rotation might not be the main responsible for the observed photometric variations; further causes of scattering (namely of polarization) may exist, as asymmetric envelopes or accretion disk, and we cannot exclude that remnants of them are still present during fainter stages, complicating the whole picture.
| Ident. | F F | |
|---|---|---|
| (m) | (10-13erg s-1cm-2) | |
| 1.1290 | OI | 0.8 0.2 |
| 1.1756 | CI | 0.6 0.2 |
| 1.1831 | MgI | 0.5 0.2 |
| 1.1972 | HeI | 1.0 0.2 |
| MJD | V1118 Ori | reference star | |||||||
|---|---|---|---|---|---|---|---|---|---|
| I (mag) | pI (%) | () | pI (%) | () | |||||
| 53689.04 | 11.96 | 2.0 | 0.4 | 75 | 5 | 0.7 | 0.6 | 60 | 20 |
| 53689.05 | 11.95 | 3.9 | 0.4 | 72 | 3 | – | – | – | – |
| 53698 | 12.36 | 2.3 | 0.3 | 59 | 4 | 1.1 | 0.3 | 104 | 8 |
| 53702 | 12.41 | 1.7 | 0.1 | 68 | 2 | 1.6 | 0.3 | 105 | 6 |
| 53703 | 12.49 | 3.1 | 0.3 | 73 | 2 | 0.7 | 0.3 | 160 | 12 |
| 53713 | 12.99 | 2.2 | 0.4 | 72 | 4 | 1.5 | 0.4 | 43 | 8 |
| 53779 | 13.25 | 3.4 | 0.2 | 92 | 2 | – | – | – | – |
| 53781 | 13.12 | 8.3 | 0.5 | 50 | 2 | 1 | 1 | 180 | 23 |
| 53782 | 12.98 | 1.9 | 0.4 | 60 | 5 | 0.5 | 0.2 | 120 | 11 |
| 53785 | 13.39 | 6.5 | 0.3 | 65 | 1 | 2.6 | 0.9 | 80 | 10 |
| 53786 | 13.50 | 2.5 | 0.4 | 103 | 5 | – | – | – | – |
| 53787 | 13.52 | 2.2 | 0.5 | 173 | 6 | 1.3 | 0.3 | 14 | 7 |
| 53788 | 13.51 | 3.5 | 0.8 | 28 | 7 | 1.6 | 0.5 | 110 | 10 |
| 53789 | 13.31 | 0.5 | 0.4 | 140 | 20 | 0.9 | 0.3 | 120 | 10 |
| 54029 | 14.69 | 6 | 1 | 43 | 7 | 1.7 | 0.3 | 9 | 6 |
| 54038 | 14.55 | 6 | 1 | 49 | 7 | 0.3 | 0.4 | 40 | 30 |
| 54085 | 14.59 | 5.2 | 0.6 | 164 | 3 | 0.7 | 0.1 | 195 | 6 |
| 54086 | 14.61 | 4.1 | 0.8 | 159 | 5 | 2.5 | 0.3 | 72 | 3 |
6 Concluding remarks
We have compiled the first catalog of all the IR (1-100 m) photometric and spectroscopic observations of EXors appeared in the last 30 years literature. Analyzing the catalogued data the following can be summarized:
-
•
The constructed database shows that the 9 EXors have been photometrically observed in the 1-10 m range on only 88 occasions, apart a daily monitoring of DR Tau. A (quasi-)simultaneous entire SED in that range has never been observed, but in 6 occasions a partial coverage (typically KLMN bands) has been obtained. Reference is given to the far-IR photometry obtained with IRAS/MSX/ISO and all the available mid- and far-IR spectroscopy is also mentioned. Although the IR monitoring of EXors conducted so far does not obey to any observational strategy, some conclusions on the general behaviour of these sources can be drawn.
-
•
Spectroscopically, two objects present significant Br flux variations on timescale of years or less and all EXors tend to show line emission spectra dominated by hydrogen recombination, where CO overtone emission is commonly detected with weaker atomic features. EXor IR spectra resemble those of the accreting T Tauri stars more than those of FUor objects.
-
•
The objects showing larger (mag 1) flux variations, namely those where we are reasonably confident to have monitored the full amplitude of the IR variation, become definitely bluer when brightening, and such property can be assigned to the whole class. Extinction variations can be ruled out because of the low AV values (1-2 mag).
-
•
Near- and mid-IR variations appear correlated and the [K-N] colour confirms that, for the EXors as well, the transition phase between the thick disk stage and the end of disk survival could be very fast.
-
•
Far-IR (12-100 m) variability cannot be evaluated since a single observation per source exists at the moment; one source was observed twice on a timescale of 15 yrs and does not show any significant variation. However, far-IR data are essential to construct comprehensive SED’s over a wide (2 decades) band. These SED’s tend to peak at shorter wavelengths during the active burst phase, namely while brightening they look like the T Tauri averaged SED; the remaining time EXors show a flatter SED more typical of a disk temperature stratification.
-
•
The observational evidences can be coherently interpreted in the framework of the disk accretion hypothesis based on a viscous friction between particles with different velocities. A local increase of the accretion along the disk causes thermal instability. Depending on the characteristics of the initial perturbation it will propagate along the whole disk or will become exhausted before. Therefore the initial brightening can occur at any wavelength, causing a bluer o redder SED, but while the propagation is going toward the center the source appear bluer and bluer.
Moreover, our monitoring program on the EXor variable V1118 Ori is still going on, and the following results complement those presented in Paper I:
-
•
Near-IR (JHK) photometric monitoring has covered part of the post outburst phase and the quiescent phase. The former is characterized by irregular fluctuations, whose amplitude is significantly reduced (from 0.5 mag to 0.04 mag) during the latter phase. This testifies the existence of some correlation between the mechanism(s) responsible for both the outburst and the short timescale variability. Being accepted that the accretion rate variation regulates the outburst, our observations indicate that such accretion rate is dynamical on (at least) two timescales (months and days).
-
•
A second near-IR spectrum (0.83-2.35 m) taken 50 days after the first one (Paper I) does not show any clue of line emission variability, but provides us a cross-confirmation of features not mentioned before because appeared weak or blended. These additional features are all characteristic of the ionic emission component typical of T Tauri stars.
-
•
A third near-IR spectrum, taken one year later, during the quiescent phase, surprisingly lacks of any spectral feature at our sensitivity except the CO (2-0) band that appears now as a weak absorption instead of emission. This observational circumstance, although very rarely detected, agrees quite naturally with the interpretation of the EXor events as due to variable accretion.
-
•
The lack of molecular component of shock excitation (H2 emission) is also given by the analysis of the archival Spitzer images in the 4.5 m channel. Spitzer data, complemented with ground-based N-band photometry (10.4 m), constitute the first mid-IR detection of V1118 Ori.
-
•
Finally, the first polarimetric observations (in the I band) indicate that V1118 Ori is intrinsically polarized (at a level of 2.5%). Moreover, higher and more variable values of polarization are observed during the fainter state suggesting that when the envelope is expected to partially disappear, we can see the real heavily spotted and magnetized photosphere.
References
- (1) Ábrahám, P., Leinert, C., Burkert, A., Henning, T., & Lemke, D. 2000 A&A 354, 965
- (2) Acke, B. & van den Ancker, M.E. 2004 A&A 426, 151
- (3) Adams, F.C. & Lin, D.N.C. 1993 Protostars and Planets III, eds.E.H. Levy & J.I. Lunine, p.721
- (4) Audard, M., Güdel, M., Skinner, S.L. et al. 2005 ApJ 635, L81
- (5) Appenzeller, I., Jankovics, I. & Krautter, J. 1983 A&A 53, 291
- (6) Biscaya, A.M., Rieke, G.H., Gopal Narayanan, Luhman, K.L. & Young E.T. 1997 ApJ 491, 359
- (7) Breger, M., Gehrz, R.D. & Hackwell, J.A. 1981 ApJ 248, 963
- (8) Carr, J.S. 1990 AJ 100, 1244
- (9) Close, L., Roddier, F., Northcott, M.J., Roddier, C. & Graves, E. 1997 ApJ 478, 766
- (10) Coffey, D., Downes, T.P. & Ray, T.P. 2004 A&A 419, 593
- (11) Cohen, M. 1974 MNRAS 169, 257
- (12) Cohen, M., Kuhi, L.V., Harlan, E.A. & Spinrad, H. 1981 ApJ 245, 920
- (13) Cohen, M. & Witteborn, F.C. 1985 ApJ 294, 345
- (14) Cohen, M. & Witteborn, F.C. 1985 ApJ 294, 345
- (15) Cutri, R.M., Strutskie, M.F., Van Dyk, S. et al. 2003 Explanatory Supplement to the 2MASS All Sky Data Release (Pasadena: Caltech)
- (16) D’Alessio, F., et al. 2000 Proc. of the SPIE Symp. on Astronomical Telescopes and Instrumentation, eds. M. Iye & A.F.M. Moorwood, 4008, 748
- (17) D’Alessio, P., Calvet, N., Hartmann, L., Lizano, S. & Cantó, J. 1999 ApJ 527, 893
- (18) Eiroa, C., Oudmaijer, R.D., Davies, J.K. et al. 2002 A&A 384, 1038
- (19) Elia, D., Strafella, F., Campeggio, L., Maiolo, B. & Pezzuto, S. 2005 New Astronomy vol.10, issue 7, 545
- (20) Elias, J.H. 1978 ApJ 224, 857
- (21) Edwards, S., Fisher, W., Hillenbrand, L. & Kwan, J. 2006 ApJ 646, 319
- (22) Edwards, S., Fisher, W., Kwan, J., Hillenbrand, L. & Dupree, A.K. 2003 ApJ 599, L41
- (23) Evans II, N.J., Levreault, R.M., Beckwith, S. & Strutskie, M. 1987 ApJ 320, 364
- (24) Folha, D.F.M. & Emerson, J.P. 1999 A&A 352, 517
- (25) Folha, D.F.M. & Emerson, J.P. 2001 A&A 365, 90
- (26) Furlan, E., Hartmann, L., Calvet, N. et al. 2006 ApJSS 165, 568
- (27) Kenyon, S.J. & Hartmann, L. 1995 ApJS 101, 117
- (28) García, J.G., Mampaso, A., Parsamian, E.S. 1995 Information Bulletin of Variable Stars n.4268
- (29) García, J.G. & Parsamian, E.S. 2000 Information Bulletin of Variable Stars n.4925
- (30) García, J.G., Parsamian, E.S. & Velazquez, J.C. 2006 Information Bulletin of Variable Stars n.5691
- (31) Ghez, A.M., Emerson, J.P., Graham, J.M., Meixner, M. & Skinner, C.J. 1994 ApJ 434, 707
- (32) Gibb. E.L., Rettig, T.W., Brittain, S.D. et al. 2006 ApJ 641, 383
- (33) Giovanardi. C., Gennari, S., Natta, A. & Stanga, R. 1991 ApJ 367, 173
- (34) Glass, I.S. & Penston, M.V. 1974 MNRAS 167, 237
- (35) Gras-Velázquez, A. & Ray, T.P. 2005 A&A 443, 541
- (36) Greene, T.P. & Lada, C.J. 1996 AJ 112, 2184
- (37) Hamann, F., Simon, M., Carr, J.S. & Prato, L. 1994 ApJ 436, 292
- (38) Hartmann, L. & Kenyon, S. 1985 ApJ 299, 462
- (39) Hartmann, L., Kenyon, S. & Hartigan, P. 1993 Protostars and Planets III, eds. E.H. Levy & J.I. Lunine, p.497
- (40) Hartmann, L., Megeath, S.T., Allen, L. et al. 2005 ApJ 629, 881
- (41) Herbig, G.H. 1989 Proc. of the ESO Workshop on Low Mass Star Formation and Pre-Main Sequence Objects, ed. B. Reipurth, p.233
- (42) Herbig, G.H. 1990 ApJ 360, 639
- (43) Herbig, G.H. & Bell, K.R. 1988 Lick Obs. Bulletin No.1111
- (44) Herbig, G.H., Aspin, C., Gilmore, A.C. et al. 2001 PASP 113, 1547
- (45) Hillenbrand, L.A., Strom, S.E., Calvet, N. et al. 1998 AJ 620, L107
- (46) Honda, M., Kataza, H., Okamoto, Y.K. et al. 2006 ApJ 646, 1024
- (47) Kenyon, S.J. & Hartmann, L. 1995 ApJS 101, 117
- (48) Kenyon, S.J., Hartmann, L., Hewett, R. et al. 1994 AJ 107, 2153
- (49) Kessler-Silacci, J., Augerau, J-C., Dullemond, C.P. et al. 2006 ApJ 639, 275
- (50) Lacasse, M.G. 1982 ApLett. 23, L61
- (51) Li, W., Evans II, N.J., Harvey, P.M. & Colome, C. 1994 ApJ 433, 199
- (52) Lorenzetti, D., Giannini, T., Calzoletti, L. et al. 2006 A&A 453, 579 (Paper I)
- (53) Lorenzetti, D., Tommasi, E., Giannini, T. et al. 1999 A&A 346, 604
- (54) Mampaso, A. & Parsamian, E.S. 1995 Information Bulletin of Variable Stars n.4269
- (55) McCabe, C., Ghez, A.M., Prato, L. et al. 2006 ApJ 636, 932
- (56) Molinari, S., Liseau, R. & Lorenzetti, D. 1993 A&A Supp. 101, 59
- (57) Moneti, A. & Zinnecker, H. 1991 A&A 242, 428
- (58) Muzerolle, J., Hartmann, L. & Calvet, N. 1998 AJ 116, 2965
- (59) Neckel, T. & Staude, H.J. 1984 A&A 131, 200
- (60) Nisini, B., Smith, H.A., Fischer, J. & Geballe, T.R. 1994 A&A 290, 463
- (61) Przygodda, F., van Boekel, R., Ábrahám, P. et al. 2003 A&A 412, L43
- (62) Reipurth, B. & Aspin, C. 1997 AJ 114, 2700
- (63) Rydgren, A.E. et al. 1984 Publ. Naval Obs. 25, 1
- (64) Rydgren, A.E. & Vrba, F.J. 1983 AJ 88, 1017
- (65) Rydgren, A.E., Strom, S.E., & Strom, K.M. 1976 ApJS 30, 307
- (66) Sato, S., Nagata, T., Tanaka, M. & Yamamoto, T. 1990 ApJ 359, 192
- (67) Saviane, I. & Doublier, V. 2005 User Manual doc. LSO-MAN-ESO-36100-0007
- (68) Shu, F., Najita, J., Ostriker, E. et al. 1994 ApJ 429, 781
- (69) Simon, M., Chen W.P., Howell, R.R., Benson, J.A. & Slowik, D. 1992 ApJ 384, 212
- (70) Smith, M.D. 1995 A&A 296, 789
- (71) Strutskie, M.F., Dutkevitch, D., Strom, S.E. et al. 1990 AJ 99, 1187
- (72) Tamura, M. & Sato, S. 1989 AJ 98, 1368
- (73) Thi, W.F., Van Dishoeck, E.F., Blake, G.A. et al. 2001 ApJ 561, 1074
- (74) Van Citters, G.W. & Smith, R.G. 1989 AJ 98, 1328
- (75) Walsh, A.J., Bertoldi, F., Burton, M.G. & Nikola, T. 2001 MNRAS 326, 36
- (76) Weaver, W.B. & Jones, G. 1992 ApJS 78, 239
- (77) Whitney, B.A., Kenyon, S.J. & Gomez, M. 1997 ApJ 485, 703
- (78) Woitas, J., Leinert, Ch. & Köhler, R. 2001 A&A 376, 982
- (79) Wood, K., Kenyon, S.J., Withney, B.A. & Bjorkman, J.E. 1996 ApJ 458, L79