Molecular Dynamics Simulation of Vascular Network Formation
Abstract
Endothelial cells are responsible for the formation of the capillary blood vessel network. We describe a system of endothelial cells by means of two-dimensional molecular dynamics simulations of point-like particles. Cells’ motion is governed by the gradient of the concentration of a chemical substance that they produce (chemotaxis). The typical time of degradation of the chemical substance introduces a characteristic length in the system. We show that point-like model cells form network resembling structures tuned by this characteristic length, before collapsing altogether. Successively, we improve the non-realistic point-like model cells by introducing an isotropic strong repulsive force between them and a velocity dependent force mimicking the observed peculiarity of endothelial cells to preserve the direction of their motion (persistence). This more realistic model does not show a clear network formation. We ascribe this partial fault in reproducing the experiments to the static geometry of our model cells that, in reality, change their shapes by elongating toward neighboring cells.
pacs:
87.10.+e, 87.17.-d, 87.18.BbKeywords: Molecular dynamics, Classical phase transitions (Theory), Pattern formation (Theory)
1 Introduction
Vascular networks are complex structures resulting from the interaction and self organization of endothelial cells (ECs). Their formation is a fundamental process occurring in embryonic development and in tumor vascularization. In order to optimize the function of providing oxygen to tissues, vascular network topological structure has to involve a characteristic length practically dictated by the diffusion coefficient of oxygen [1]. In fact, observation of these networks reveals that they consist of a collection of nodes connected by thin chords with approximately the same length. In this work, we study the process of formation of vascular networks by means of two-dimensional off-lattice molecular dynamics simulations involving a finite number of interacting simple units, modeling endothelial cells. The interaction among cells is due to the presence of a chemical signal, in turn produced by the cells themselves. This mechanism of motion is called chemotaxis, a mechanism still object of intensive experimental and theoretical research. The relevance of chemotaxis reflects its important role in many situations of biomedical interest such as wound healing, embryonic development, vascularization, angiogenesis, cell aggregation, to cite a few. On the theoretical side, the first partial differential equation based models of chemotaxis appeared in the early ’70s [2], and were soon followed by “more microscopic” models (eg. the Reinforced Random Walk) and kinetic models [3].
The study of the particular biological process of vascular network formation and its relations to tumor vascularization has also been accomplished by means of several mathematical models. First studies were presented by Murray et al. [4, 5], who explained the phenomenon by focusing mainly on its mechanical aspects, i.e. on the interaction between cells and the substrate. Gamba et al. [6, 7, 8, 9] proposed a continuous model, based on chemotaxis, which applies to early stages of in vitro vasculogenesis, performed with Human Umbilical-Vein ECs (HUVEC) cultured on a gel matrix. More recently, some of these authors managed to unify both the mechanical aspect and the chemical one into a more complete model [10, 11].
Blood vessel formation may be divided into two different processes. In the first stage, occurring in embryonic development, ECs organize into a primitive vascular network (Vasculogenesis). In a second moment, existing vessels split and remodel in order to extend the circulation of blood into previously avascular regions by a mechanism of controlled migration and proliferation of the ECs (Angiogenesis) [12]. ECs are the most essential component of the vessel network: each vessel, from the largest one to the smallest one, is composed by a monolayer of ECs (called endothelium), arranged in a mosaic pattern around a central lumen, into which blood flows. In the capillaries the endothelium may even consist of just a single EC, rolled up on itself to form the lumen.
Although there are several mechanisms involved during vessel formation, in this work we shall focus on the characteristic migration motion of cells driven in response to an external chemical stimulus: the chemotaxis. ECs secrete an attractive chemical factor, the Vascular Growth Factor-A (VEGF-A), while they start to migrate. Each of them perceives the chemical signal with its receptors at its extremities and starts to move along the chemical concentration field gradient, toward areas of higher concentration corresponding to higher density of cells. ECs are able to move extending tiny protrusions, the pseudopodia, on the side of the higher concentration. The pseudopodia attach to the substratum, via adhesion molecules, and pull the cell in that direction.
In parallel with chemotaxis, another mechanism resulting in cell motion is the haptotaxis, i.e. the movement of cells along an adhesive gradient: the substratum is not usually homogeneous and its varying density can affect cell adhesion and hence migration. We will not consider haptotaxis in this work. Cell-cell and cell-membrane contacts are really essential in the process of vascular network formation and their loss can cause cell apoptosis (death) [12, 13, 14, 15, 16, 17].
2 Review of the experimental data
The experimental data on which all theoretical studies till now
hinge, are those collected by tracking the behavior of cells
initially displaced at random onto a proteic gel matrix, generically
called Extra-Cellular Matrix, which mimics at best the
original living environment.
In our analysis, we explicitly refer to the in
vitro vasculogenesis experiments of Gamba et al. [6], and
shall use the same numerical values of parameters therein introduced.
In the experiments, HUVEC cells are randomly dispersed and cultured
on a gel matrix (Matrigel) of linear size ,2,4,8 mm. Cells
sediment by gravity on the matrix and then move on its horizontal
surface, showing the ability of self-organizing in a structured
network characterized by a natural length scale. The whole process
takes about hours.
Four fundamental steps can be distinguished in the experiments
[18]:
-
During the first two hours, the ECs start to move by choosing a particular direction dictated by the gradient of the concentration of the chemical substance VEGF-A. Single ECs migrate until collision with neighboring cells, keeping a practically fixed direction with a small superimposed random velocity component. The peculiarity of ECs of maintaining the same direction of motion is known as persistence, and has been explained by cells inertia in rearranging their shapes. In fact, in order to change direction of motion, ECs have first to elongate towards the new direction, with the result that to change path is a relatively slow process. In this phase of amoeboid motion, the mechanical interactions with the substrate are weak.
-
After collision, ECs attach to their neighboring cells eventually forming a continuous multicellular network. They assume a more elongated shape and multiply the number of adhesion sites. In this phase the motion is slower than in the previous step.
-
In the third phase the mechanical interactions become essential as the network slowly moves, undergoing a thinning process that would leave the overall structure mainly unalterated.
-
Finally cells fold up to create the lumen.
The final capillary-like network can be represented as a collection of nodes connected by chords, whose experimentally measured average length stays around 200 m for values of the cell density between 100 to 200 cells/mm2. Outside this range no network develops. More precisely, below a critical value of 100 cells/mm2, groups of disconnected structures form, while at higher densities (above 200-300 cells/mm2) the mean chord thickness grows to hold an increasing number of cells and the structure resembles a continuous carpet with holes (swiss cheese pattern).
3 Theoretical model
In this article we present an off-lattice particle model of vasculogenesis where the equations of motion are governed by the gradient of the concentration of a chemoattractant substance produced by the particles themselves. The discrete -particle system we are proposing, gives evidence of the important role of the pure chemotaxis process in forming well structured networks with a characteristic chord length size.
| A | B | C | D |
|---|---|---|---|
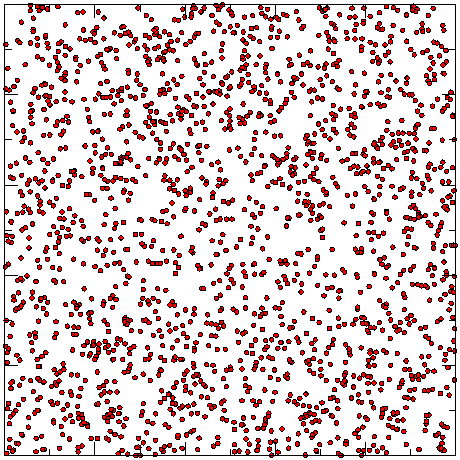 |
 |
 |
 |
 |
 |
 |
 |
We developed our model with increasing complexity, refining it by
gradually adding features that would allow a closer resemblance with
experiments. Particles, which we shall also refer to as “cells” in
the following, are constrained inside a square box of given edge
with periodic boundary conditions. The number of cells will be kept
constant during the simulations, i.e. we will consider neither cell
creation nor cell destruction.
At first, we consider cells as adimensional point-like particles
moving only under the effect of the concentration gradient of the
chemoattractant substance . The chemoattractant
is released by cells. It diffuses according to a diffusion
coefficient m2/s and degrades within a
characteristic finite time min. The combination of
the diffusion and degradation processes introduces a characteristic
length in the system, with m. As a further step, we introduced in the system a dynamical
friction proportional to the velocity of cells in order to simulate
the dragging force to which cells are subjected in the matrigel. The
net result of this friction is to slow down the overall simulation
time, leaving unaltered the main features of the system history.
Although point-like cells are a very simplified representation of real
cells, their motion, driven by chemotaxis, yields the formation of the
expected network of filaments with a characteristic length
(see bottom row of Fig. 1).
In order to further refine the simulation, we introduced an inelastic isotropic repulsion mechanism between cells (see the following paragraph for its definition), imitating the fact that cells do not penetrate each other in reality. Since the chemotactic field acts as an attractive potential between cells, the result of both processes is to stick together cells after collision. Cells are no more adimensional but now possess their own effective radius m. The introduction of a cell effective radius changes sensibly the simulation. One important side effect is that of imposing a limit on the density of cells in the simulation, which must lie well below the close-packing density.
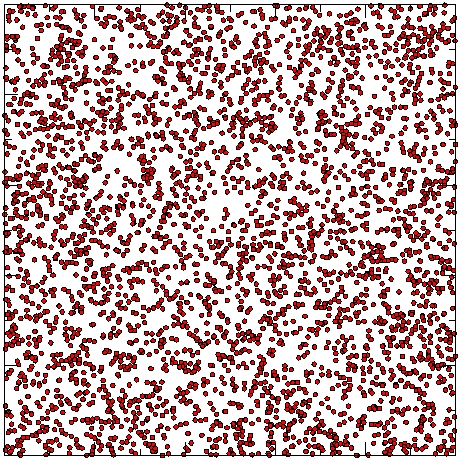
| A | B | C | D |
|---|---|---|---|
 |
 |
 |
 |
 |
 |
 |
 |
The last refinement deals with the problem of the “cell persistence” of motion, i.e. the observed large inertia of cells in changing the direction of their motion. The solution to this issue in terms of pure galilean inertia proposed by Gamba et al. in their continuous model [6] has been criticized in [19], where it was pointed out that cells must rely onto a more involved mechanism of resistance to changes of direction. As a result some of the authors of [6] recently proposed variations of their model to explicitly include cell persistence [11, 18]. In our case, we use the advantage of a molecular dynamic simulation to have full control of all forces acting on all cells at each time step. For each cell, we simply reduce the component of the gradient of the chemical field along the direction orthogonal to the direction of cell motion by a factor with a constant modulating the effect of persistence and the position and velocity of the -th cell.
To summarize, the dynamical system of equations we solve with is
where , , and are respectively the diffusion
coefficient, the rate of production and the characteristic
degradation time of the soluble chemo-attractant mediator, and
measures the strength of the cell response to the chemical factor.
Here is the total chemical field acting on the position
at time . By linearity it is given by the sum of the
chemotactic fields generated by all cells
.
The force
stands for the inelastic isotropic repulsion force between two
colliding cells.
Let be the vector joining the centers cells and ,
we define the force
for
(overlapping cells) and zero otherwise,
where is the cell radius, is an elastic constant,
is an inelastic coefficient and .
the cell
persistence force discussed above, with the symbol standing for the projection of the gradient
orthogonal to the direction of .
is the non-conservative friction
term.
The function is responsible of chemo-attractant
production. It is an even non-negative function of ,
normalized to unity in the whole space. We took as a step
function with constant value inside the circle and zero
outside.
In order to match the experimental set up conditions, cell initial positions were extracted at random with a poissonian process, while all velocities were set to zero. In the case of two-dimensional cells with repulsion, cells were dropped in the random extracted position only if no overlap with other cells occurred, otherwise another position had to be extracted. The concentration of the chemo-attractant was also initially set to zero.
We integrated the equations of motion by means of a standard Verlet algorithm [20] with time step s, while the numerical solution of the diffusion partial differential equation was accomplished by using a second order explicit finite differences scheme [21] on a square grid with step equal to m. The edge of the simulation box was set to mm. By posing , and the equations can be written in terms of the dimensionless starred unknowns, so that all the dependence on the constant parameters , , is carried upon a rescaled value of and all forces .
As already mentioned, we performed our simulations with increasing complexity. Firstly we consider point-like model cells moving inside the chemotactic field. Secondly, we switched on the inelastic cell-cell repulsion term and the velocity dependent persistence force . In both cases, we included the dynamical non-conservative friction force in the simulations, the presence of which did not change substantially the results.
4 Results
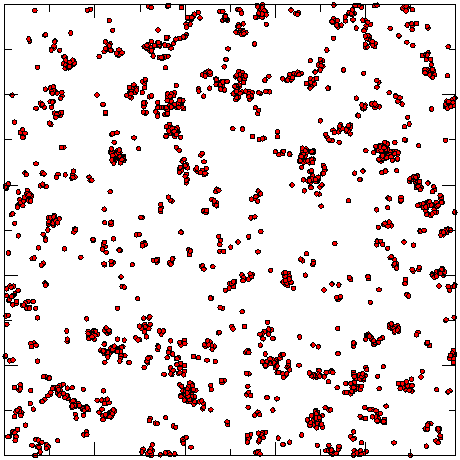
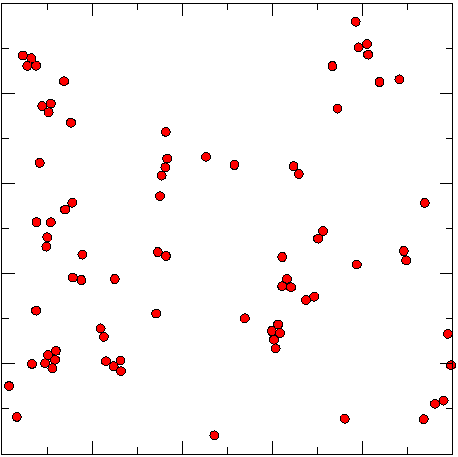
The results of the simulation of point-like cells under chemotaxis,
without the effect of repulsion and persistence forces, are shown in
Fig. 1, where the system is
analyzed depending on the number of particles. These simulations, far
from representing the dynamics of real cell populations, are
nevertheless interesting since they deliver a picture of the
capillary network with a characteristic chord size of length
m and uncover the different behavior of the
system with respect to the cell density. For , network chords
do not develop and after a short transient of slow motion, in which
the chemical substance diffuses throughout the simulation box,
cells collapse all together. The situation improves as the number of
particles increases and the best network is obtained for . In
that case, thin filaments are visible with a thickness of very few
cells. Finally, for chords are obtained with a thickness of
many cells. In some senses this last situation resembles the
swiss cheese pattern visible in the experiments. The
characteristic length is still detectable in the form of holes with
characteristic area value around .
We notice that in the case of pointless particles, cell densities
resulting in vascular networks are very large compared to the
experimental ones. This is obviously an issue stemming from the
vanishing excluded volume of the chosen model particles that represent
cells.
Moreover, these unrealistic high cellular densities result in a
correspondingly high production of chemo-actractant and consequently
high chemotactic field gradients, so that the
simulation runs faster than the characteristic times of experiments.
In fact, with these semplified model we find the formation of network
resembling structures after hours, much less than the
experimental value of 12 hours.
Without both the repulsion and persistence terms, the organized capillary network structure arises as a brief transient, after which cells collapse all together. The appearance of network structures only during a transient is a feature shared by other different models of continuous type [22]. At this stage, the dynamical friction term, although strictly unnecessary, helps to lengthen the duration of the transient. Therefore, as a first result we observe that a simple molecular dynamics model captures the essence of the process of chemotaxis, which is capable of organizing cells in a non-trivial functional network displacement, although only during a brief transient.
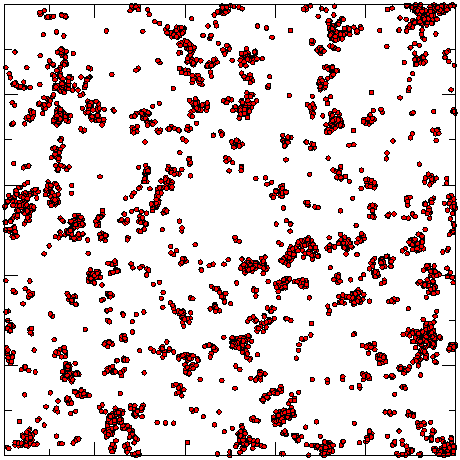
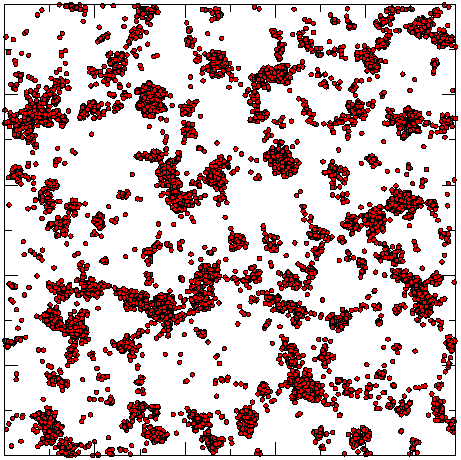
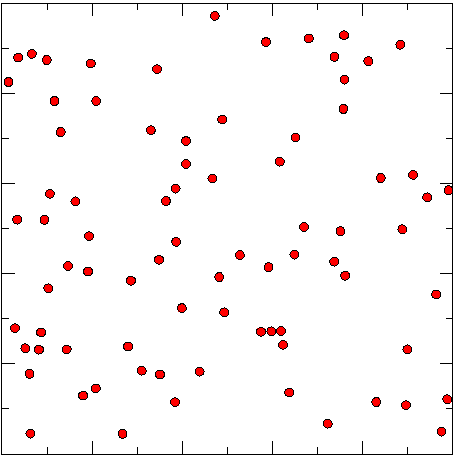
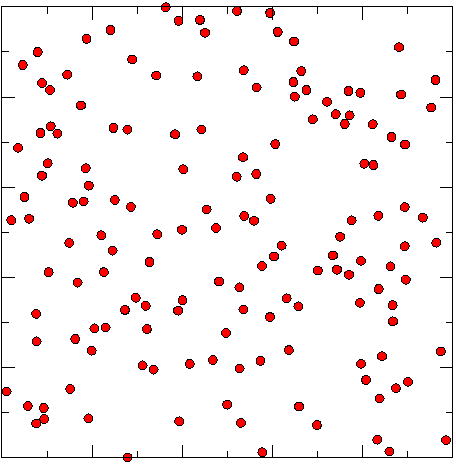
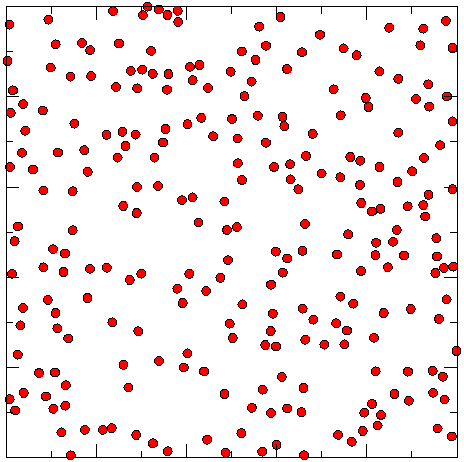
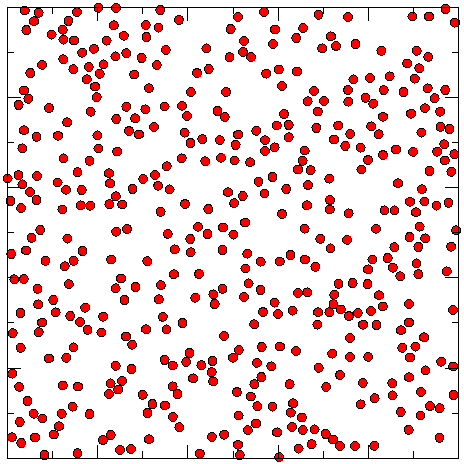
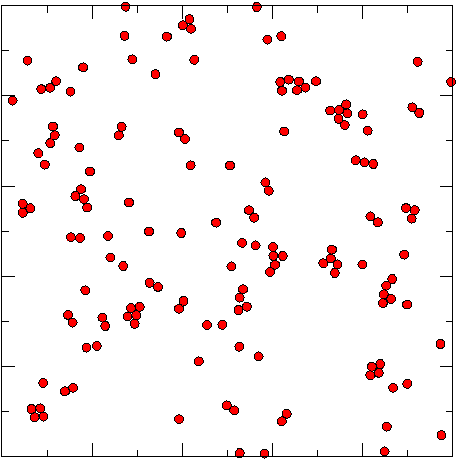
As an attempt to stabilize the temporary capillary network, we introduce the inelastic repulsion force , intended to glue together colliding cells of certain effective radius (in co-operation with the actractive chemotactic field) and to reduce bouncing effects (due to its inelastic character), and the persistence force , which should provide a better alignment of cells such to enhance the network-like structure. The inelastic repulsion term , because of the effective cell radius introduced, imposes a limit on the number of cells that can be inserted in the simulation box without overlap. Our simulations were set up with cell densities equal to the experimental values, i.e. varying from cells/mm2 to cells/mm2.
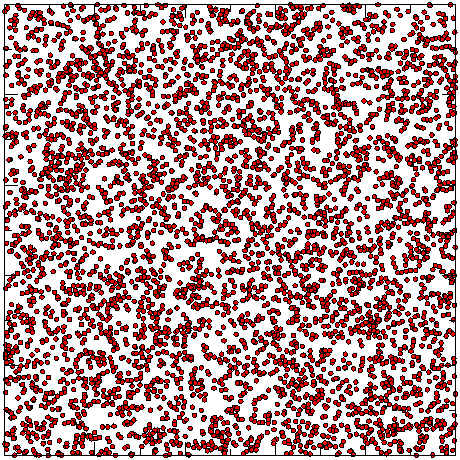
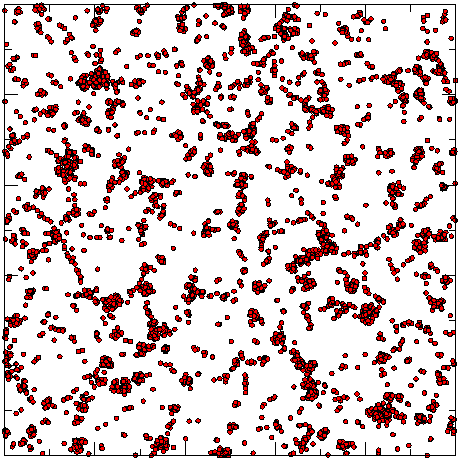
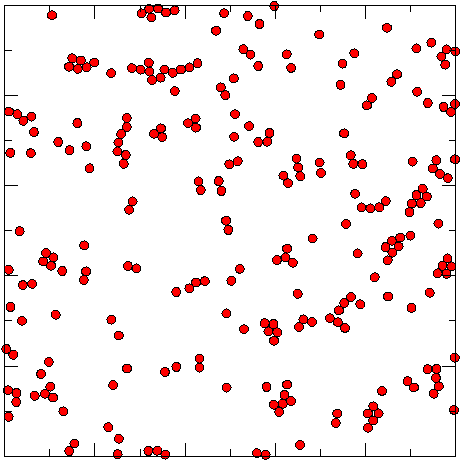
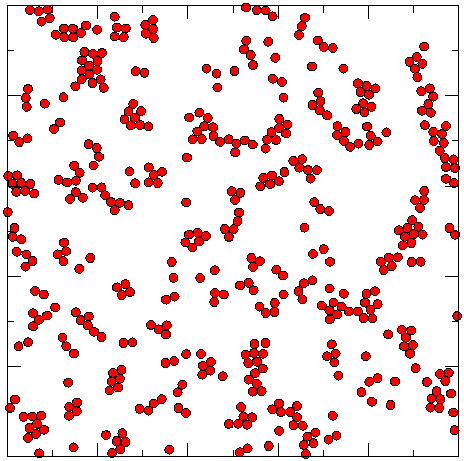
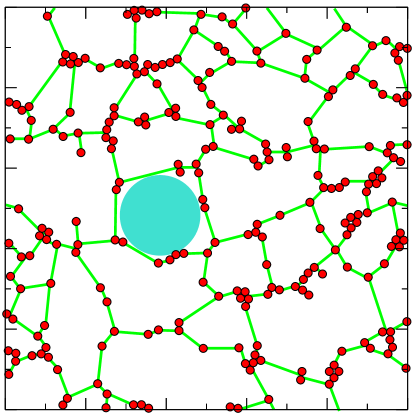
Despite our intention of improving the model, we find there is no clear formation of capillary networks. By examining Fig. 2A and Fig. 2B, we find disconnected patterns for cells, as also foreseen by the experiments, while we do not find a clear evidence of network formation with cells, although empty spaces of characteristic area can be observed in Fig. 2C and Fig. 2D. In particular, the case of cells shows thick structures of cells reminiscent of the swiss cheese pattern, but still disposed in a rather unorganized geometry. In Fig. 3, we show the possible resulting network in the case of 250 cells, by drawing cell connections by hand (by connecting cell neighbors by eye) and by superposing a circle with diameter . As in the simpler point-like cell model, the observed (unclear) network-like structures continue to appear during a short transient, although with longer lifetimes, after simulation times of hours, comparable with the experimental ones. Thus, the introduction of the persistence and inelastic repulsive forces tends to stabilize the network-like geometry.
The network-like capillary structure raising only during a transient in the simulation is an unrealistic feature common to the hydrodynamical models as well [6, 22]. A possible explanation of this fact, which may lead to more realistic simulations, is that cells have been modeled as (quasi) static geometrical entities. In fact, in reality, cells elongate their shape in the act of moving toward higher chemo-attractant concentrations [23], which is a process intimately bound to the phenomenon of cell persistence of motion. This is the main reason that led us to introduce the persistence force . With this term, in fact, the transient phase gets longer and the network structures become slightly more clear. In the elongated form and after they come in contact, the real cells stick together, in some sense imitating those connections that we added by hand in Fig. 3.
5 Conclusions
We showed that two-dimensional molecular dynamics simulations of point-like cells whose motion is governed by the process of chemotaxis, reproduce the main features of real cells to form networks having chords with a characteristic length. However, this networks are metastable and collapse after a brief transient. Similar results are present in literature, where the problem is faced by solving PDE of hydrodynamic type, with individual cells represented by gaussian bumps. To our knowledge our method is the first attempt to describe endothelial cell systems in terms of a discrete collection of particles, whose motion can be tracked throughout the whole history of capillary network formation. The peculiar advantage of molecular dynamics methods is the extreme ease with which one can introduce forces acting to individual particles.
In particular, in order to stabilize the metastable network state, we introduce both an inelastic repulsion force between cells and the so called “persistence” force, which mimics the observed tendency of cells to preserve the direction of their motion. Unfortunately, this model, although more complete and closer to reality, is not fully able to reproduce the formation of a clear capillary network in correspondence of realistic cell densities beyond the percolation threshold. A vague network-like structure appears during a short transient, whereas the introduction of the persistence of motion force and the inelastic repulsive force helps to lengthen this metastable geometry, before all cells collapse in a unique large cluster. We ascribe this unsuccess to the geometry of single cells, which in reality change their shape by elongating towards the direction of motion, a feature that we are not considering at the moment.
Acknowledgments
This research has been partly supported by the TAGora project funded by the Future and Emerging Technologies program (IST-FET) of the European Commission under the EU RD contract IST-34721. P.B. and L.T. kindly acknowledges partial support from COFIN-MIUR.
Bibliography
References
- [1] Ambrosi D, Bussolino F and Preziosi L, 2005 J. Theor. Medic. 6 1
- [2] Keller E F and Segel L A, 1970 J. Theor. Biol. 26 399
- [3] Othmer H G and Stevens A, 1997 SIAM J. Appl. Math. 57 1044
- [4] Murray J and Oster G, 1984 J. Math. Biol. 19 265
- [5] Manoussaki D, Lubkin S R, Vernon R B and Murray J, 1996 Acta Biotheor. 44 271
- [6] Gamba A, Ambrosi D, Coniglio A, de Candia A, Di Talia S, Giraudo E, Serini G, Preziosi L and Bussolino F, 2003 Phys. Rev. Lett. 90 118101
- [7] Serini G, Ambrosi D, Giraudo E, Gamba A, Preziosi L and Bussolino F, 2003 The Embo Journal 22 1771
- [8] Ambrosi D, Gamba A and Serini G, 2004 Bull. Math. Biol. 66 1851
- [9] Ambrosi D, Gamba A, Giraudo E, Serini G, Preziosi L and Bussolino F, 2001 Internal Report
- [10] Manoussaki D, 2003 ESAIM: M2AN 37 581
- [11] Tosin A, Ambrosi D and Preziosi L, 2006 Bull. Math. Biol. 68 1819
- [12] Plank M J and Sleeman B D, 2003 J. Theor. Medic. 5 137
- [13] Dye J F, Lawrence L, Firth J A and Linge C, 2004 Endothelium - J. Endoth. Cell. Res. 11 151
- [14] Levine H A and Sleeman B D, in 2003 Cancer Modeling and Simulations, L. Preziosi ed. (Chapman Hall/CRC Press), ISBN 9781584883616.
- [15] Turner H E, Harris A L, Melmed S and Wass J A H, 2003 Endocrine Reviews 24 600
- [16] Serini G et al., 2003 Nature 424 391
- [17] Di Talia S, Gamba A and Lamberti F, 2006 Phys. Rev. E 73 041917
- [18] Preziosi L and Astanin S, in 2005 Integration of complex Systems in Biomedicine, A. Quarteroni ed. (Springer-Verlag Press).
- [19] Merks R M H and Glazier J A, 2006 Nonlinearity 19 C1
- [20] Allen M P and Tildesley D J, 1989 Computer simulation of liquids, (Clarendon Press, New York, NY, USA), ISBN 0-19-855645-4.
- [21] Press W H, Teukolsky S A, Vetterling W T and Flannery B P, 1992 Numerical Recipes in C: The Art of Scientific Computing, (Clarendon Press, New York, NY, USA), ISBN 0521437148.
- [22] Gamba A, private communication
- [23] Merks R M H, Brodsky S V, Goligorksy M S, Newman S A, Glazier J A, 2006 Developmental Biology 289 44