Multi-Particle Decays of Light Mesons Measured by PHENIX at RHIC
Abstract
The PHENIX experiment at RHIC measured , and -meson production at high in , +Au and Au+Au collisions at = 200 GeV. Measurements performed in different hadronic decay channels give consistent results. This paper presents measured meson-to- ratios and Nuclear Modification factors in the most central +Au and Au+Au collisions. No suppression seen in +Au interactions is in contrast to a strong suppression of meson yields revealed in central Au+Au collisions at the same energy.
1 Analysis
The layout of the PHENIX detector [2] and the decay modes of the particles presented in this analysis are shown in Fig. 1. The reconstruction begins with pairing photons (straight lines)
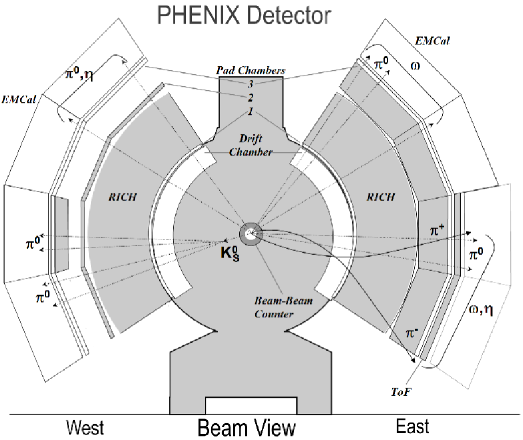
and selecting the candidates based on the invariant mass of the pair. The candidates are then combined between themselves, other photons or with the charged tracks and corresponding invariant mass distributions are analyzed to extract the particle yields by simultaneous fitting of the peaks and the background. The positions of the mass peaks were found to be in agreement with the particle masses measured in vacuum and the widths of the peaks, depending predominantly on the detector resolution, change from 10 MeV/ for to 20 MeV/ for and and to 30 MeV/ for . The values above vary within less then 5 MeV/ depending on the bin which agree with the widths resulting from the detector resolution.
The analysis discussed in these paper is based on the event samples accumulated during PHENIX physics Runs3,4, and 5 with integral statistics, after quality assurance selection, corresponding to the integrated luminosity of 1.5 nb-1 () 129 b-1(+Au) and 2.5 pb-1 (Au+Au) in these runs respectively. The background conditions, depending on the mode of study for 4-5 GeV/, is smaller than 1:5 to 1:20 in and +Au and 1:70 in Au+Au.
The raw yields have to be corrected for the limited detector acceptance, the -trigger efficiency, various analysis cuts, the gamma conversions in the detector preceding the calorimeter and the branching ratios of the specific decay mode. The magnitude of the corrections is calculated based on the full detector simulation and analysis of the data. The efficiencies measured in the detector configuration used during the data taking are shown in Fig. 2.
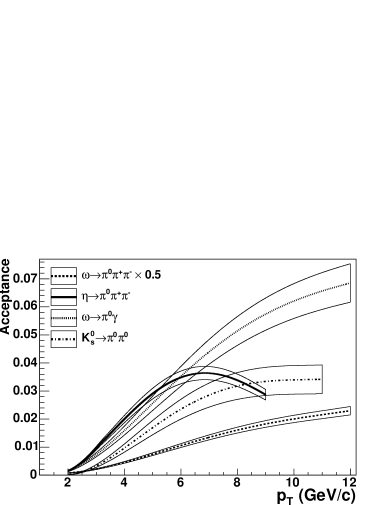
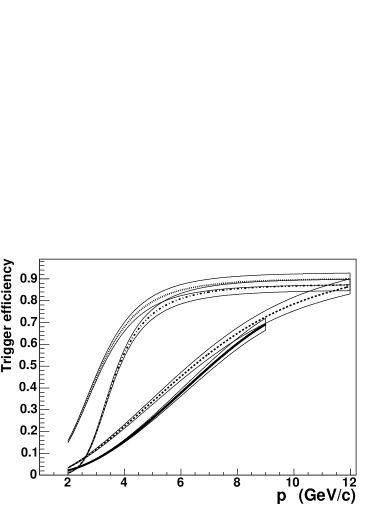
The phase space density distribution of the true three-body decay modes , known from the literature [6] was taken into account in the simulation. More details about this analysis can be found in [3, 4, 5]. For Au+Au events we applied an additional correction for reconstruction losses due to the detector occupancy.
The systematic errors of the measurement are listed in Tab. 1. The main source of error is the extraction of the raw yield made by fitting. The procedure is described in [3].
Source Acceptance Trigger efficiency 5 - 5 Yield extraction 10 9 MB trigger 10 8 10 8 4 10 8 Total
2 Results
The results of the multi-particle decay measurements are presented in Fig. 3
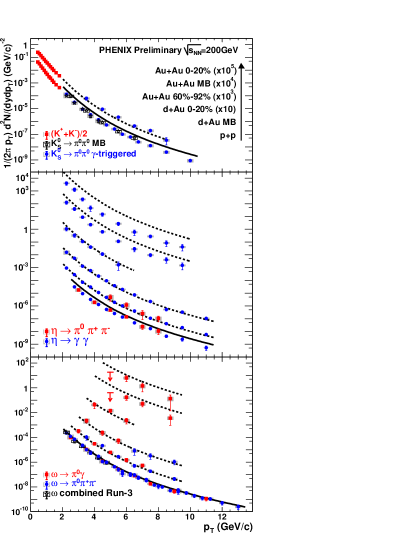
for K-meson in the top panel, -meson in the middle panel and -meson in the bottom panel.
The -meson is measured in two decay modes, , and -meson is measured in , . The results of the measurements for the same meson agree. The K cannot be compared to K from PHENIX because of the detector-induced background at the mass of the K-meson. The results are in agreement with the STAR experiment measurement in [8]. We also see very good agreement between the results obtained in PHENIX physics Run3 and Run5 and between the results measured in triggered and Minimum Biased event samples. In the latter case the correction shown in right panels of Fig. 2 does not apply.
In the data the range of the measurement is limited by the detector acceptance on the lower side of the range and by the available statistics on the upper side. In Run5 the -meson production in is measured out to 13 GeV/ making it the second in -reach identified particle after the . In the heavier collision systems the combinatorial background effectively reduces the available statistics.
The lowest data points shown in each panel of Fig. 3 are the yields measured in collision. Plotted above them are the Minimum Biased and 0-20% central +Au events data. The 60%-92% peripheral, Minimum Bias and 0-20% central Au+Au collision spectra are plotted on top. For such data are not available. All measurements are done at GeV. Central +Au and Au+Au data are scaled by different factors for the clarity.
The solid line shown in each panel is the parameterization of the invariant yield of measured in collisions [7]. For the - and the -mesons this line is above the data points and for the -meson the points are much closer. Using this parameterization the non-identical meson ratios can be calculated. We find that in the collisions these ratios are flat above the =2.5 GeV/. Fitted by a constant the particle ratios are: = 0.810.020.07, = 0.480.020.02 and = 0.450.010.05.
Each set of points shown in Fig. 3 has a corresponding dashed line. These lines are constructed in the following way: the spectra measured in (solid line) is scaled with the corresponding meson-to- ratio given above. Since all ratios are found to be flat in the region of the measurement, the scaled reference corresponds to the invariant yield of the meson in the collisions. Those yields are further scaled by the number of binary collisions for each centrality bin in +Au and Au+Au presented in the figure.
As one can see for all analyzed mesons the +Au data in Minimum Bias and 0-20% most central events are very close to the dashed lines. The ratio of the two is the Nuclear Modification Factor and for the analyzed mesons it was found to be flat within the errors of the measurement. For the Minimum Bias event sample the ’s are above unit but agree with 1 within the errors of the measurement.
In the peripheral Au+Au collisions the nuclear modification factor is not very different from 1 as the dashed line lays close to the points. This is not so in the Minimum Biased and 0-20% central Au+Au events. For -meson we find the to be 0.40.15. The -meson production in central Au+Au events is suppressed by a factor of 5 compared to scaled reference.
3 Acknowledgments
Work of the speaker is supported by the Goldhaber Fellowship at BNL with funds provided by Brookhaven Science Associates.
References
-
[1]
Slides:
http://indico.cern.ch/contributionDisplay.py?contribId=93&sessionId=7&confId=9499 - [2] K. Adkox et al., Nucl. Instrum. Meth. A499 469 (2003).
- [3] S.S. Adler et al., Phys. Rev. C75 024909 (2007).
- [4] S.S. Adler et al., Phys. Rev. C75 051902(R) (2007).
- [5] V. Riabov (for the PHENIX Collaboration), nucl-ex/0702046v1.
- [6] C. Alff et al., Phys. Rev. Lett. 9 325 (1962).
- [7] A. Adare et al., arXiv:0704.3599v1.
- [8] B.I. Abelev et al., Phys. Rev. C75 064901 (2007).
- [9] S.S. Adler et al., Phys.Rev. C74 (2006) 024904.