An X-ray jet in the BL Lac S5 2007+777
Abstract
The BL Lac S5 2007+777 was observed by us with Chandra, to find the X-ray counterpart to its 18′′ radio jet, and study its structure. Indeed, a bright X-ray jet was discovered in the 33 ks ACIS-S image of the source. We present its properties and briefly discuss the implications.
NASA/GSFC, NASA/GSFC, NRAO and Stanford, Oss. Merate, Oss. Brera
1. Introduction
One of the most important legacies of Chandra is the discovery and the study of kpc-scale X-ray jets in Active Galactic Nuclei (AGN). Mostly, Chandra detected X-ray emission from the jets of FRIs and FRIIs (see Harris & Krawczynski 2002, for a review), raising important questions of the mechanisms of emission of the high-energy radiation and the acceleration processes in these sources.
The study of extended structure in BL Lac objects, however, lags behind. X-ray emission from extended structures were so far detected in only 3 of such sources: PKS 0521–365 (Birkinshaw, Worrall, & Hardcastle 2001), 3C 371 (Pesce et al. 2001), and PKS 2201+044 (Sambruna et al. 2007a ). These objects are peculiar, in the sense that broad optical emission lines were occasionally detected from their nuclei, leading to an intermediate classification between BL Lacs and QSOs. Indeed, their X-ray jets present properties both of FRIs and FRIIs.
Here we report the discovery of an X-ray counterpart to the 18′′ radio jet in the BL Lac S5 2007+777 (z=0.342). The source is a well-known BL Lac from the 1 Jy sample (Stickel et al. 1993) with a narrow radio jet (Fig. 1). A more detailed discussion of the results is in preparation (Sambruna et al. 2007b ).
2. Chandra Observations and Results
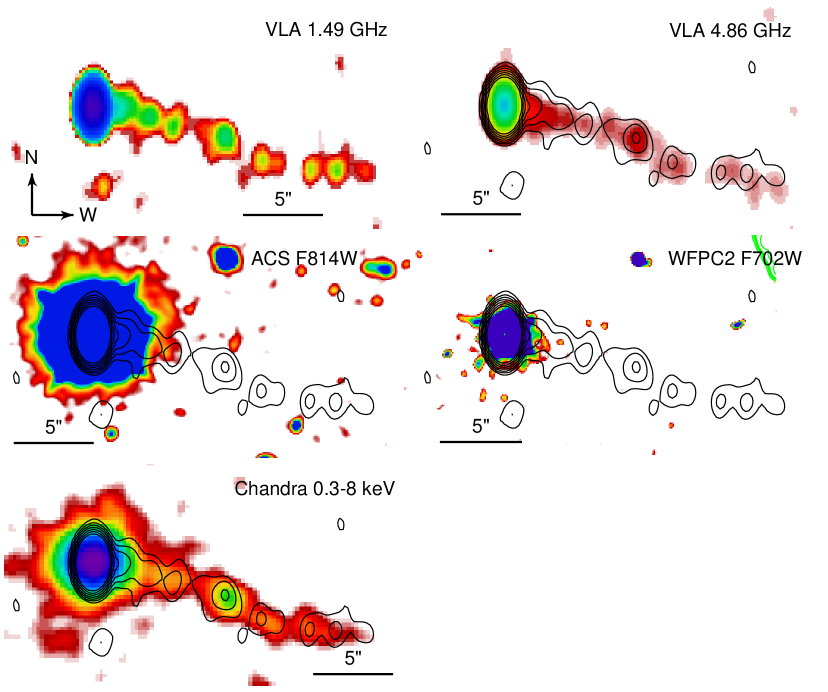
We observed S5 2007+777 with Chandra on May 23, 2005. The ACIS-S data were reducted according to standard procedures yielding 33 ks of good data. Archival HST (ACS F814W and WFPC2 F702W) and VLA 1.5 and 4.8 GHz observations were also used.
Figure 1 shows a montage of the multiwavelength images of the jet. At
radio, the jet appears knotty with several well-defined knots of
emission.
X-ray emission is present from all the radio knots. Figure 1, bottom,
shows that there is a remarkable correspondence between the radio and
the X-ray emission. Table 1 lists the properties of the jet, including
the radio spectral index and the radio-to-X-ray broad-band index. The
X-ray flux and flux densities were calculated with PIMMS using
the knot’s count rate in column 2 and assuming a power-law spectrum
with photon index and Galactic
NH=8.58cm-2 (Table 2). There are no variations of
the X-ray-to-radio flux ratio along the jet.
We extracted the X-ray spectrum of the full jet and of the brightest knot at 8.5′′ from the core (Table 2). As for the latter a total of 43 counts were collected, the spectral fit was performed using the C-statistics. The full jet X-ray spectrum is well described by a power law with . A thermal model is equally acceptable, but the fitted temperature, kT=64 keV, effectively mimicks a power law. Similarly, knot K8.5 is fitted with a power law with rather hard slope (Table 2), albeit within large uncertainties.
Table 2 also reports the spectral parameters from a fit to the core X-ray spectrum. The latter is described by a power law with , softer than the jet. Thus, as in the cases of 3C 371 and PKS 2201+044, there is evidence for hardening of the X-ray emission going from the core to the jet. No diffuse X-ray emission is detected around the core.
3. Discussion
This paper presents new Chandra and archival HST and VLA observations of the kpc-scale jet in the BL Lac S5 2007+777. An X-ray counterpart to the radio jet was detected, with a remarkable morphological correspondence at the two wavelengths.
This morphological similarity provides first clues to the origin of the high-energy emission. A likely possibility is that the X-rays are produced via inverse Compton scattering of seed photons (CMB?) off the same electrons responsible for the synchrotron radio emission. Indeed, a similar 1:1 correspondence between the radio and X-ray jet is also present in powerful FRIIs and similar or higher z, where IC/CMB is thought to play a dominant role (Sambruna et al. 2004). Note that if the X-rays were the high-energy tail of the longer-wavelength synchrotron emission the size of the X-ray knots would be smaller than at radio, due to the shorter lifetimes of the higher-energy electrons, unless acceleration occurs throughout the entire volume.
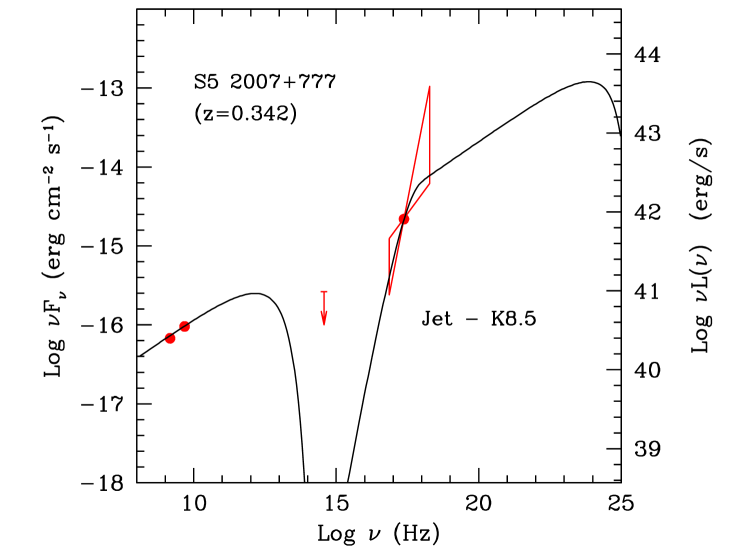
To better quantify the properties of the X-ray jet, we assembled its Spectral Energy Distribution (SED) from radio to X-rays. Knot K8.5 was used, as it is the brightest. A 3 upper limit to the optical emission was derived from the ACS data. The SED is shown in Figure 2. We also report the result of the modeling of the SED with the synchrotron+IC/CMB model (Tavecchio et al. 2000). The hard X-ray emission can be reproduced assuming that it belongs to the low energy tail of the IC/CMB component: this choice implies a relatively large value for the minimum energy of the relativistic electrons, , compared to the “typical” value (Sambruna et al. 2002). The bulk Lorentz factor is .
One of the motivations for observing this source with Chandra was to test the structure of the jet. It has been proposed, and supported by radio observations, that AGN jets may have two components - a fast spine and a slow wall. The latter contributes synchrotron X-ray emission when the jet is seen at larger viewing angles (as in FRIs), while the fast-moving plasma in the spine is responsible for the beamed IC/CMB emission seen in FRII jets.
BL Lacs are more aligned versions of FRIs. Thus, a significant fraction of their jet X-ray emission should originate via IC/CMB off the fast spine. S5 2007+777 was chosen for this study because of it exhibits a long, collimated jet, while in most BL Lacs the radio jets appear larger and more diffuse (Murphy, Browne, & Perley 1993), perhaps because of smaller viewing angles.
Our results confirm the original expectations that, at a favorable angle, the X-ray emission from the jet of a BL Lac is dominated by IC/CMB as in powerful FRIIs. This also provides circumstantial evidence in support of a spine-wall structure for the jet.
| Knot | Net c/s | F0.3-8keV | F | F | F | ||
|---|---|---|---|---|---|---|---|
| (1) | (2) | (3) | (4) | (5) | (6) | (7) | (8) |
| K3.6 | 0.18 | 2.24 | 0.123 | 0.780 | 2.092 | 0.834 | 0.885 |
| K5.2 | 0.36 | 4.49 | 0.247 | 0.530 | 1.961 | 1.107 | 0.824 |
| K8.5 | 1.32 | 16.45 | 0.904 | 1.956 | 4.550 | 0.714 | 0.824 |
| K11.1 | 0.55 | 6.85 | 0.377 | 1.030 | 2.432 | 0.727 | 0.838 |
| K14.1 | |||||||
| K15.7 | 0.64 | 7.97 | 0.438 | 1.530 | 4.655 | 0.941 | 0.851 |
| K17.5 |
Columns explanation: 1=Knot name labeled as a function of the distance from the core (in arcsec) in the 1.49 GHz image; 2=Net count rate in the 0.3–8 keV band in units of c/s; 3=X-ray flux in the 0.3–8 keV band in units of erg cm-2 s-1; 4=X-ray flux density at 1 keV (in nJy); 5-6=Radio flux densities at the indicated frequencies (in mJy); 7=Spectral index in the radio band (between 1.49 and 4.86 GHz); 8=Broadband spectral index between 1 keV and 4.86 GHz.
NOTE: The values for knot at 15.7′′ are obtained with an extraction region considerably large to increase the significance of the X-ray detection. This area collects photons from all the 3 contiguous knots (i.e., K14.1 K15.7, and K17.5)
| Source | Net c/s | /d.o.f. | F0.3-8keV | L0.3-8keV | |
|---|---|---|---|---|---|
| (1) | (2) | (3) | (4) | (5) | (6) |
| CORE | 23.59 | 1.980.23 | 0.89/201 | 246.65 | 90.555 |
| FULL JET | 0.28 | 1.02 | 1.38/3 | 4.30 | 1.308 |
| K8.5 | 0.12 | 0.84 | …. | 2.11 | 0.608 |
Columns explanation: 1=Source; 2=Net count rate in the 0.3–8 keV band in units of c/s; 3=Photon index; 4=Reduced and degrees of freedom; 5=Observed X-ray flux in the 0.3–8 keV band in units of erg cm-2 s-1; 6=Intrinsic X-ray luminosity in the 0.3–8 keV band in units of erg s-1.
References
- Birkinshaw, Worrall, and Hardcastle (2002) Birkinshaw, M., Worrall, D.M., & Hardcastle, M.J. 2002, MNRAS, 335, 142
- Harris & Krawczynski (2002) Harris, D.E. & Krawczynski, H. 2002, ApJ, 565, 244
- Murphy, Browne, & Perley (1993) Murphy, D. W., Browne, I. W. A., & Perley, R. A. 1993, MNRAS, 264, 298
- Pesce et al. (2001) Pesce, J.E., Sambruna, R.M., Tavecchio, F., Maraschi, L., Cheung, C.C., Urry, C.M., Scarpa, R. 2001, ApJ, 556, L79
- (5) Sambruna, R.M. et al. 2007a, ApJ, submitted
- (6) Sambruna, R.M. et al. 2007b, in preparation
- Sambruna et al. (2004) Sambruna, R.M., Gambill, J.K., Maraschi, L., Tavecchio, F., Cerutti, R., Cheung, C.C., Urry, C.M., & Chartas, G. 2004, ApJ, 608, 698
- Sambruna et al. (2002) Sambruna, R.M., Maraschi, L., Tavecchio, F., Urry, C.M., Cheung, C.C., Chartas, G., Scarpa, R., & Gambill, J.K. 2002, ApJ, 571, 206
- Stickel et al. (1993) Stickel, M., Fried, J. W., Kuehr, H., Padovani, P., & Urry, C.M. 1993, ApJ, 374, 431
- Tavecchio et al. (2000) Tavecchio, F., Maraschi, L., Sambruna, R.M., & Urry, C.M. 2000, ApJ, 544, L23