Environmental dependence of AGN activity in the supercluster A901/2
Abstract
We present XMM data for the supercluster A901/2, at , which is combined with deep imaging and 17-band photometric redshifts (from the COMBO-17 survey), 2dF spectra and Spitzer 24m data, to identify AGN in the supercluster. The 90ksec XMM image contains 139 point sources, of which 11 are identified as supercluster AGN with erg cm-2s-1. The host galaxies have and only 2 of 8 sources with spectra could have been identified as AGN by the detected optical emission lines. Using a large sample of 795 supercluster galaxies we define control samples of massive galaxies with no detected AGN. The local environments of the AGN and control samples differ at per cent significance. The AGN host galaxies lie predominantly in areas of moderate projected galaxy density and with more local blue galaxies than the control sample, with the exception of one very bright Type I AGN very near the centre of a cluster. These environments are similar to, but not limited to, cluster outskirts and blue groups. Despite the large number of potential host galaxies, no AGN are found in regions with the highest galaxy density (excluding some cluster cores where emission from the ICM obscures moderate luminosity AGN). AGN are also absent from the areas with lowest galaxy denstiy. We conclude that the prevalence of cluster AGN is linked to their environment.
keywords:
Galaxies: clusters: individual: A901/2 - Galaxies: active1 Introduction
The properties and evolution of galaxies are known to be strongly linked to their external environment. In particular, populations of galaxies in clusters are strikingly different to those in the field, as shown by the morphology–density relation (Oemler 1974, Dressler 1980) and dramatic changes in star-formation rates (e.g. Lewis et al. 2002 and Gómez et al. 2003). It appears that galaxies change significantly as they join denser environments such as groups and clusters.
It is increasingly evident that many of the changes in galaxy properties between cluster cores and the field are triggered in intermediate density environments, and that a distinction between field and cluster populations is overly simplistic. For example, Wake et al. (2005) find that galaxy colour is a function of local rather than extended galaxy density, and Lewis et al. (2002 ) and Gómez et al. (2003) find the same result for star-formation rate. Wolf et al. (2005) find that dusty star-forming galaxies are generally found in moderate density environments.
Various processes have been suggested to account for the rapid transformation of cluster galaxies, from local effects such as mergers (e.g. Mihos & Hernquist 1996) and repeated close gravitational encounters (e.g. Moore et al. 1998) to the large scale effects like the tidal field (e.g. Byrd & Valtonen 1990) and the intra-cluster medium, via ram-pressure stripping (e.g. Abadi et al. (1999)) or ‘strangulation’ (e.g. Larson et al. 1980).
The processes which affect galaxy properties may also, directly or indirectly, affect the accretion onto the central black hole found in most, if not all, galaxies with a stellar bulge (e.g Magorrian et al. 1998). Both local and large-scale processes which may affect cluster galaxies also have the potential to affect the distribution of gas in the galaxies, and hence may trigger or suppress AGN activity. Recently large and moderate sized surveys have begun to shed light on the local and extended environments of AGN, and produce observational evidence for some of these processes.
The first evidence of a suppression of AGN in the cores of galaxy clusters was found in the optical survey of Dressler et al. (1984), although a large source of bias was suggested by Edge (1994). Further optical surveys (such as Coldwell et al. 2002 and Kauffmann et al. 2004) have also found a deficit of luminous AGN in dense regions. However Miller et al. (2003) find that the fraction of luminous galaxies with AGN is independent of galaxy density, a conclusion also drawn from the auto-correlations of AGN and galaxies presented by Wake et al. (2005). Surprisingly, some of these studies use the same datasets, but draw contrasting conclusions, probably due to different AGN selection techniques.
The picture is further complicated when detections in other wavebands are considered. In contrast to the optical results, many radio studies (e.g. Best et al. 2002, Miller & Owen 2003, Barr et al. 2003, Reddy & Yun 2004, and Best 2004) show an increase in radio-loud AGN activity in galaxy clusters, at a range of redshifts and in both relaxed and merging systems. Best (2004) find that the majority of radio-loud AGN in the densest regions are not emission-line sources, and so may be missed by optical studies.
However, radio-loud AGN are not representative of AGN as a whole, and optical studies are prone to selection effects: studies of X-ray emission are an alternative method to remove some selection effects, and to detect a larger population of AGN. Indeed, Martini et al. (2006) find that only four of at least 35 X-ray detected AGN in a sample of clusters have optical spectral signatures of AGN activity. The majority of studies in the X-ray have focused on galaxy clusters, which have the advantage of a large number of galaxies and high density, but are complicated by the X-ray emission from the intra-cluster medium. This tends to mask any detections of AGN in the very centre of the cluster, in particular in the central galaxy, if one exists, which is often a massive elliptical and radio loud (e.g. Peres et al. 1998, Best et al. 2006). The exclusion of such galaxies may in fact be an advantage as they are in very different environments from the other cluster galaxies, frequently lying in the centre of the potential well. This unusual environment probably has a very different effect on AGN activity compared to the other cluster members, and it is therefore preferable to distinguish between central and normal galaxies when evaluating the environments of AGN.
Statistical studies of point sources in the fields of galaxy clusters have found numerous clusters that have more luminous point sources than expected from a non-cluster field (e.g. Henry & Briel 1991, Lazzati et al. 1998, Molnar et al. 2002, Cappi et al. 2001, Johnson et al. 2003, Cappelluti et al. 2005 and Ruderman & Ebeling 2005 and Gilmour et al. in prep.) and which are therefore likely to contain AGN. Others studies find clusters which appear to have no excess of sources (e.g. Molnar et al. (2002), Kim et al. 2004a and 2004b), and therefore no detectable (generally moderate luminosity) AGN.
Martini et al. (2006) confirm spectroscopically that eight low-redshift clusters each contain between 2 and 10 X-ray sources with erg s-1, the majority of which are AGN without optical emission lines. This corresponds to 5 per cent of galaxies with hosting AGN with erg s-1, which is a far higher AGN fraction than previously determined from optical surveys. Recent results (Martini et al., 2007) show that the radial distribution of the fainter AGN in this sample follows that of the cluster population, but the more luminous AGN are found preferentially in the central regions. This result is in agreement with a recent statistical survey of 18 clusters (Branchesi et al., 2007).
Given that many galaxy transformations occur in intermediate density environments, it may be that AGN are also altered by the host galaxy environment. To understand the links between AGN activity and their extended environment it is desirable to look beyond galaxy clusters as a single entity, and instead determine the effect of local ( kpc) and large scale ( Mpc) environment, from the field through groups and cluster outskirts to the cluster cores.
Superclusters are ideal testbeds for such a study as they consist of a large number of galaxies in a range of environments, but at the same epoch. The correlations between environment and AGN properties can therefore be studied in one field, without complications due to galaxy or AGN evolution. For example, the AGN population in galaxy groups can be compared to that in cluster outskirts of similar local galaxy density to distinguish between local and large scale environments. In addition superclusters contain both disturbed and relaxed regions, which may affect AGN in different ways.
This paper presents the results of investigations into AGN in the supercluster A901/2, which has extensive multi-wavelength imaging and spectroscopy, summarised in Section 2. The data reduction and identification of the supercluster AGN are described in Sections 3 and 4. The properties of the AGN and their host galaxies are investigated, along with the environments in which they are found, and the environments of the AGN hosts are compared to other supercluster galaxies in Section 5. The results are summarised in Section 6. Details of individual AGN candidates are given in the Appendix. Throughout the paper the cosmological parameters and are set to 0.3, 0.7 and 70 km s-1 Mpc-1, and all COMBO-17 absolute magnitudes are converted to this cosmology.
2 The supercluster A901/2
2.1 Optical data
The supercluster consisting of Abell 901 and Abell 902 (A901/2), first identified by Abell (1958), is ideal for a study of the effect of environment on AGN due to the low redshift () and wealth of optical data available. It is one of the fields in the COMBO-17 survey (Classifying Objects by Medium-Band Observations in 17 Filters, Wolf et al. 2003), and in addition 2dF spectra are available for 282 supercluster galaxies, from observations with the two degree field (2dF) spectrograph on the Anglo–Australian telescope.
The COMBO-17 survey used the Wide Field Imager (WFI) at the MPG/ESO 2.2 m telescope to obtain images of a degree field with a pixel size of . Images were taken in 5 broad and 12 narrow band filters and matched to a set of template spectra to determine photometric redshifts (). Reliable photometric redshifts were found for the 18000 objects with , with errors of order (which is comparable to the velocity dispersion of the supercluster) at , and for (Wolf et al. (2005), hereafter WGM05). The accuracy of the photometric redshifts when compared to the available spectroscopic redshifts is shown by Wolf et al. to be good, such that it is possible to select a magnitude-limited supercluster sample with minimal contamination from interlopers and only a few percent loss of true supercluster galaxies.
A cut of gives 795 galaxies with total absolute V band magnitude , which are used in WGM05 and Lane et al. (2007). This large sample makes it possible to determine very accurately the distribution and properties of the galaxies in A901/2 (Gray et al. , 2004).
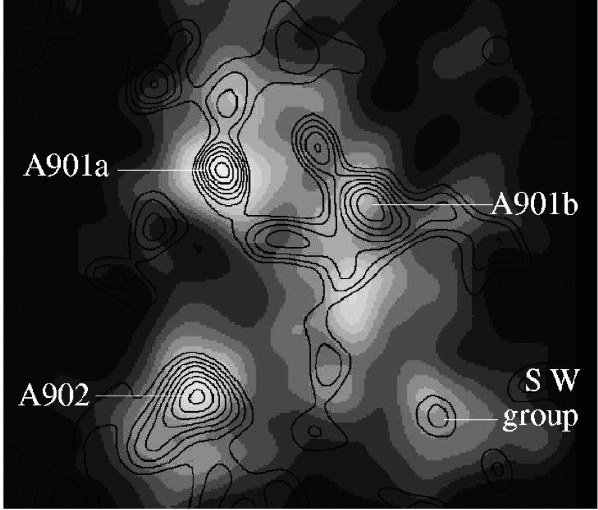
The optically identified structure of A901/2 is shown in Figure 1. A901 consists of two dark matter halos of comparable size, A901a and A901b, each with a massive galaxy in the centre. A901a contains far more galaxies and is far more concentrated than A901b. A tail of smaller, bluer galaxies extends south of A901b towards A902, which is a more optically diffuse cluster. There is also a group of galaxies in the south-west corner, and optical data and 3D weak lensing analysis (Taylor et al. , 2004) has identified a cluster at redshift almost directly behind A902. It is clear that the supercluster contains a wide range of environments with differing ratios of dark to optically visible matter. The effect of these environments on the galaxy star-formation rate has been investigated by Gray et al. (2004), who found that the proportion of galaxies that are star-forming is a strong function of local dark-matter density, with far less star-formation in galaxies in denser regions. In addition, the WGM05 study found a population of dusty star-forming galaxies which preferentially exist in medium galaxy-density environments, avoiding both the field and the cluster cores.
2dF spectra are available for 282 of the brightest galaxies in the supercluster, and cover the wavelength range 3900–6000A (Gray et al. in prep.). The COMBO-17 SEDs and 2dF spectra are not sufficient to compile a sample of AGN as many AGN are optically obscured. In comparison, X-ray samples are far more complete (see for example Martini et al. 2006 and Szokoly et al. 2004) but suffer from confusion with heavily star-forming galaxies. Combining an X-ray source list with the 2dF spectra and COMBO-17 data can help identify supercluster X-ray sources and distinguish between X-ray emission from AGN and that from other sources such as star-formation and populations of low mass X-ray binaries. Comparing the positions of AGN hosts with the other identified supercluster galaxies will determine whether AGN activity is enhanced or suppressed in a range of environments.
2.2 Infra-red data
This field is currently being surveyed using MIPS (Multi-band Imaging Photometer for Spitzer) on Spitzer. An early release catalogue of the 24 micron sources in this field (1/7 of the final data, from Bell and Papovich, private communication) will help in the identification of some AGN, as shown in Section 4.2.
2.3 X-ray data
The A901/2 supercluster region had previously been observed for ksec as part of the ROSAT All Sky Survey (Ebeling et al. , 1996) and in addition with the ROSAT High Resolution Imager for ksec. Schindler (2000) found seven sources in the field, two of which coincide with A901a and A901b. The bright emission coincident with A901a was found to be a point source.
In this paper a new, deep (90ksec) XMM-Newton image of the supercluster, obtained in 2003, is presented. By combining the deep X-ray image and the optical data a sample of AGN in the supercluster are selected and analysed.
3 X-ray data reduction
3.1 Data reduction
A 90ksec XMM image of A901/2 was taken on 6th/7th May 2003 using the three EPIC cameras (MOS1, MOS2, PN) and a thin filter. The level 1 data were taken from the supplied pipeline products, and reduced with SAS v5.4 and the calibration files. The data were filtered for bad pixels, the standard good patterns of 0–12 and XMMEA_EM or XMMEA_EP and energy between 0.5 and 7.5 keV. Removing times when the count rate was counts s-1 for MOS1 and MOS2 detectors and counts s-1 for PN resulted in an exposure time of ksec for MOS and ksec for PN, and removed all episodes of significant flaring.
3.2 Source detection
Sources were detected using WAVDETECT (Freeman et al. , 2002) on 600 x 600 pixel unvignetted full-band images for each detector. The images and the corresponding exposure maps had a pixel size of 4.1″. A mask was created for each detector, which removed areas with less than 25 per cent of the maximum exposure or an exposure map gradient of over 0.4 for MOS or 0.03 for PN. Three areas of streaking were removed by hand in the PN mask.
102 sources were detected in the MOS1 image, 96 in MOS2 and 128 in PN. The total number of unique sources detected, without applying any cut on source significance, was 150 (of which 64 were detected in all three images, 33 in two and 53 in one). The vast majority of those missed in one or two images were outside the field of view of those detectors, or only detected in the more sensitive PN image.
A point source catalogue was constructed for each detector by removing all detections of extended supercluster emission. As the size and shape of the PSF is not well defined in XMM two methods were used to determine which were point sources:
-
•
The FWHM was found for each object. As the sources become increasingly elliptical towards the edge of the image, it was required that the semi-minor axis had a FWHM of pixels. This includes all bright on-axis point sources, which have a FWHM of pixels, and allows some margin of error for the fainter sources. This method was only useful for moderate to bright sources.
-
•
The catalogue was compared to the results for this field from the XCS survey (private communication, see M. Davidson, in prep.). This survey uses a sophisticated wavelet reconstruction method to find extended emission in XMM images. Due to problems with the raw dataset this method could only use the MOS data in the NE quarter of the image, whereas all data are used in the rest of the image. Detections of extended emission are therefore less accurate in the NE quarter.
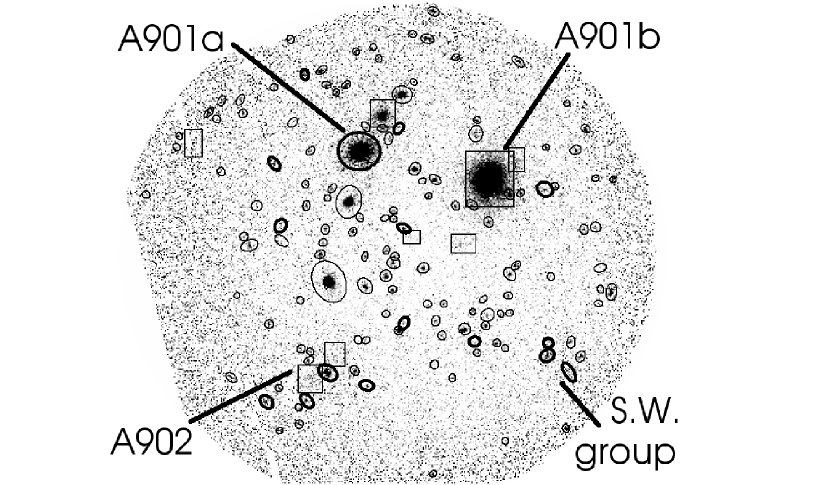
The results of these methods are broadly in agreement, within the errors described, and identified eight areas of possible supercluster emission, shown in Figure 2. Of these, the smallest three are likely to be artifacts as they all occur near the chip boundary of one image only. All of these sources were removed from the catalogue. Analysis of the extended emission will be covered in Gray et al., in prep.
A further consideration is the brightest source in the field, which has the FWHM of a point source. As this source is so bright (similar in flux to the X-ray emission from A901b) and lies very close to the centre of A901a, it could be concentrated cluster emission or a cooling flow. These scenarios were ruled out by analysis of the spectrum, which is a power law rather than thermal and the fact that the X-ray emission is centred on a galaxy which is not the brightest cluster galaxy and which has radio emission (from the NVSS, Condon et al. 1998). It is therefore concluded that this object is an AGN.
3.3 Point source properties
The reality, position and positional error of the sources were found by comparing the sources found in each of the three detectors. For sources that were detected in more than one image the position was defined as the midpoint of the two closest positions for that source. (In the most common case of sources detected in all three images this removed errors due to one detection being near a chip boundary.) For singly detected sources the given position was used.
The wavdetect 1-sigma positional errors were found to be generally less than one arcsecond even for the faintest sources. In comparison, the separations between detections of the same source in different images were on average 3 arcseconds, which is just less than one pixel. This is a random error, rather than astrometric, due to the difficulty of finding the centre of faint objects with a large pixel size compared to the PSF, and is a better measurement of the ‘true’ error on the stated source position. The wavdetect errors are dependent on the source size and counts, and are correlated with the distance between detections in different images. This distance is on average 7 times the wavdetect error for low-significance sources (only changing to 6 times higher for high-significance sources). Therefore, although the wavdetect errors are unphysically low they can be used to estimate the true error, especially for singly detected sources. For this reason the error on the source position was given by the larger of the following three measurements: the distance between the two closest detections (if they existed), 7 times the stated wavdetect error, or 0.5 pixel (an error of less than half a pixel was defined as unphysical).
As a final stage, all sources that were not detected at significance in at least one image were removed, where the significance is given by , for source counts and background counts . (This means that all sources are not random fluctuations to at least significance, but in most cases is overly conservative as it doesn’t take into account the spatial distribution of photons within the source area). This cut removed 11 sources, and also agrees well with the reality determined by eye. At least one of these sources is real (at 09:56:24 -10:01:52, probably matching a =2.2 quasar in the COMBO-17 catalogue), as it was marginally detected in two images; however it has a very large positional error, and for consistency and accuracy was not included in the catalogue.
The final list of 139 significant point sources, including positional errors, is given in Table LABEL:A901table and shown in Figure 2.
4 Finding the Supercluster Active Galactic Nuclei
4.1 Matching X-ray and Optical catalogues
The COMBO-17 catalogue consists of 63776 objects detected using SExtractor on the R-band image (Wolf et al. , 2003). These were matched with the XMM point sources to identify the X-ray sources in the supercluster. Some saturated stars and fainter objects near diffraction spikes are not included in the COMBO-17 catalogue, so the areas around each X-ray source were examined manually for missing objects, and four such optical objects which could possibly match an X-ray source were added to the catalogue.
A maximum-likelihood technique was used to match the X-ray sources to the COMBO-17 optical catalogue. Matching was performed by comparing the value (a measure of the association between two sources, i and j, see Equation 1) with the distribution of this value for X-ray sources placed randomly within the field. Because depends on the error on the source co-ordinates, which varies significantly in the X-ray sample, the expected distribution of was calculated for each X-ray source, , by randomly placing 14000 X-ray sources with error over the optical catalogue. The resulting (normalised) distribution gives the probability of obtaining each likelihood ratio by chance (if source had no optical counterpart), as shown for one source in Figure 3.
The likelihood ratio was defined (following Mann et al. 1997 and Taylor E. L. et al. 2005, who use a method described in detail in Sutherland & Saunders 1992) as
| (1) |
where is the positional error on X-ray source , the distance to optical object from X-ray source , and the number of optical objects brighter than object in the r band image. This takes account of angular separation and optical magnitude, but made no distinction between object classification or photometric redshift. The errors on the positions of the optical objects were small enough to neglect compared to those in the X-ray, and the astrometric errors were also found to be negligible as the minimum error on the X-ray position of 0.5 pixels is significantly larger than the astrometric error on this image.
This method treats optical quasars and galaxies of the same flux in the same way, and does not account for the fact that quasars are rarer and more likely to be X-ray sources. In addition, the method does not distinguish between the brightest galaxies, which are rare and quite likely to be X-ray sources, and stars of a similar magnitude. These issues are important when a faint QSO is the only match and is assigned too low a probability. This will lead to incompleteness in the X-ray matching, but will not affect the supercluster sample. In addition, the probabilities will not be accurate if more than one possible match is identified, and one of the matches is a QSO or bright star. This can affect the supercluster sample, and in these cases the optical classifications, locations and errors of all the possible matches were examined in detail to determine the true source of the X-rays.
In addition this technique compares likelihoods to the average over the field and ignores any clustering, which gives slightly higher likelihood values for X-ray sources in the line of sight to cluster centres, and slightly lower for those in areas with few supercluster galaxies. This is very unlikely to change any results, especially as the catalogue is dominated at all optical magnitudes by non-supercluster objects ( per cent of optical objects are not in the supercluster at , and per cent at ).

The standard method of calculating the reliability of a match requires a large sample of sources, so instead the reliability for each X-ray – optical pair was defined as the probability of not obtaining randomly,
| (2) |
Most X-ray sources have more than one potential optical counterpart, as well as a significant probability of having no match, such that the reliabilities sum to . The probability that optical object is the true counterpart to , () and the probability that there is no counterpart (), given a set of possible counterparts, , are calculated following Rutledge et al. (2000),
| (3) |
| (4) |
where S is a normalisation factor so that the probabilities sum to 1, and is the number of possible optical counterparts to the X-ray source.
A liberal catalogue of possible and secure matches was constructed. The thresholds used were deliberately loose as many factors could increase the likelihood of a match on a case by case basis. These include matching with other wavelengths, visual inspection of the shape and centring of the X-ray point source, and characteristics of the optical counterpart, for example if it is a faint quasar. In addition, some of the X-ray sources have such large errors that the chance of a random association will always be high, even if the match appears to be excellent. Therefore all matches which fulfill the criteria described below are included in Table LABEL:A901table, and the additional factors which may affect the probability of a match are listed in the ‘Notes’ column. The possible supercluster AGN are evaluated on a case by case basis.
For sources with only one likely optical counterpart, a match is defined as , which is confirmed by visual inspection. For sources with more than one possible counterpart the conditions for object to be a unique counterpart given a set of options, , were and . This resulted in 66 secure identifications out of 139 sources, of which fewer than 6 are expected to be random associations. For sources with multiple possible counterparts ( and ) all optical objects with were included as possible matches. This resulted in 17 sources with two possible counterparts and 3 sources with three options.
4.2 Matching with the 24-micron data
The Spitzer 24 micron catalogue of 1194 sources in the X-ray field of view was used to improve the X-ray to optical matching. These data are useful as AGN often have infra-red emission, but also in a purely statistical sense there are far fewer Spitzer sources than optical objects in the field of view, so the probability of a random association is far lower. As the 24m sources have smaller positional errors than the X-ray sources, and are rarer than the optical objects, a match between an X-ray and 24m source can significantly improve the accuracy of the optical match.
A simple likelihood ratio test, following the method for the optical catalogue, produced 81 unique matches between the X-ray and 24m sources, and 20 X-ray sources with more than one possible 24m counterpart. The same probability cuts as the X-ray matching were applied, and the low surface density of 24m and X-ray sources mean that very few false matches are expected. Examination of the optical images for the few X-ray sources with more than one possible 24m counterpart shows that in most cases the 24m ‘point sources’ are likely to be multiple detections of nearby galaxies, which are significantly larger than the 24m PSF.
The 24m sources were then matched with the optical catalogue. The errors for the 24m catalogue were taken as , which is half a pixel. This will underestimate the errors on faint 24m sources, and give a more conservative catalogue. The advantage of taking the same errors for all sources is a reduction in computing time as only one expected distribution needs to be calculated. In addition, as the sample was large enough, a true reliability was calculated by comparing the likelihood ratio distribution for the sample () with that of 10 random catalogues () following the method of Taylor E. L. et al. (2005). The reliability is defined as a function of likelihood ratio,
| (5) |
Probabilities for each possible match were calculated using Equations 3 and 4, and the criteria for unique and multiple matches used in the X-ray matching were applied. The 24m sources that matched the X-ray catalogue were examined by eye to identify those which had good optical matches, but were rejected due to underestimated positional errors in the 24m data.
The combined probability of the X-ray – 24m – optical match was used to identify the 24m counterparts and to help identify optical matches in previously ambiguous cases. For 97 X-ray sources the addition of the 24m data confirmed the result of the previous matching, including 49 cases where neither the 24m data nor the optical catalogue gave a good match. This includes cases where the 24m data confirm the existence of two possible matches, and cases where two 24m sources correspond well to one X-ray and one optical object (and appear to be multiple detections of nearby galaxies). For a further 14 X-ray sources the 24m matching identifies at least one of the optical counterparts but at a lower probability (between 0.65 and 0.8). Four X-ray sources had a secure 24m match with no optical counterpart, and 20 X-ray sources had an optical counterpart but no likely 24m match. For four X-ray sources the 24m data changed the assigned optical match, by eliminating or confirming possible optical objects, and these sources are flagged in Table LABEL:A901table.
The final list of X-ray sources with unique and multiple counterparts is given in Table LABEL:A901table, which lists the X-ray IDs, positions, positional error and count rates, and the possible COMBO-17 matches, optical position and photometric redshift. The probabilities and reliabilities of the optical matches are given to allow an evaluation of the accuracy and uniqueness of each match. The 24m flux of any matching Spitzer sources and the combined probability of the X-ray – Spitzer match and the Spitzer – Optical match both being true are also given.
4.3 Criteria for identifying supercluster AGN
To identify the AGN in the supercluster it is necessary to use the photometric and, if possible, spectroscopic redshifts from the COMBO-17 survey. A cut of was used to ensure that all AGN associated with the supercluster were identified (see WGM05 for details of the redshift cut). This range also allows for the errors in the photometric redshifts, which may also be affected by the AGN emission. It is found that adding / subtracting the COMBO-17 redshift error for each X-ray emitting source does not reveal any more possible supercluster X-ray sources. In addition some galaxies have bimodal photometric redshift distributions, so the second choice redshifts were checked and no extra supercluster X-ray sources were found.
The presence of an AGN may cause the template fitting in the COMBO-17 survey to give wrong photometric redshifts, as the COMBO-17 templates do not include Seyfert-like spectra with both AGN and host galaxy contributions. To check for missed supercluster X-ray sources we examined all optical counterparts with (between the faintest supercluster X-ray source and the brightest supercluster galaxy), and (on or bluer than the supercluster red sequence) which were classified as galaxies according to their template spectra.111Photometric redshifts of objects classed as high redshift quasars are accurate as the chance of a galaxy at being mistaken for a quasar is very small (Wolf et al. , 2004).. The photometric data for these galaxies were manually compared to spectral templates at the supercluster redshift. Two optical counterparts (COMBO catalogue numbers 12953 and 41435, matching X-ray sources #3 and #135) were found to fit well with templates at despite having different photometric redshifts in the COMBO catalogue. These are discussed in detail in the Appendix.
X-ray emission of the luminosities seen in this sample could be caused by a large population of low mass X-ray binaries (LMXBs), hot coronae of massive galaxies, or high levels of star formation, as well as AGN activity. Emission from LMXBs is ruled out following the method of Martini et al. (2006), who compare their observations to the tight relation between B-band galaxy luminosity and the total X-ray broad band luminosity from all LMXBs (Kim & Fabbiano, 2004). Even without correcting for the wider X-ray band used in this relation (keV compared to keV for the A901/2 sources) the X-ray emission from the possible supercluster X-ray sources is at least a factor of 6, and median factor of 32 higher than the Kim & Fabbiano average relation. This is significantly higher than the scatter in their observations. Emission from hot coronae is also highly unlikely to be the cause of the X-ray emission, as the upper limit on the relationship between B-band and X-ray luminosity for such sources is very similar to that for LMXBs (Sun et al. , 2007) and the A901/2 sources have far higher X-ray to B-band luminosity ratios.
To distinguish between X-ray emission from high levels of star formation and that from AGN, various methods were used depending on the information available for each source. Used alone most of these methods cannot distinguish absolutely between star-forming galaxies and those with AGN, but combining the available data can give a reliable indicator of the nature of the X-ray emission.
-
•
X-ray Luminosity – Star forming galaxies generally have low X-ray luminosities. A source in the local universe with is extremely unlikely be purely star forming (Bauer et al. , 2004), and any source with is likely to be an AGN (see Figure 7 of Bauer et al. – most sources with which are not near the flux limit are securely identified as AGN by their column density or hardness ratio). Luminosities were calculated using aperture photometry on images with the mean background subtracted. The background subtraction process followed the method of Arnaud et al. (2002), and will be described in the forthcoming paper on the extended emission (Gray et al. in prep.). The redshift of the supercluster AGN (0.17) means that the observed 0.5–7.5 keV counts can be converted into an emitted 0.58–8.7 keV luminosity. As this study does not require very accurate luminosities, and as the errors on the count rates are large, this is taken as an approximation to the 0.5–8 keV luminosity. The true luminosities may be slightly higher, but this depends on the X-ray spectrum.
-
•
[OII] Star-Formation Rates – If the X-ray emission is purely due to star-formation, with no AGN present, then the star-formation rate (SFR) can be estimated from the soft band X-ray luminosity as
(6) (Ranalli et al. , 2003). If there is no AGN and minimal absorption then this must be near to the SFR derived from the [OII]3727 line flux (Hopkins et al. , 2003);
(7) where can be estimated for those objects with 2dF spectra from the equivalent width of the line and the COMBO-17 magnitude in the rest-frame Johnson U band. (This method assumes a flat spectrum in the U band, but will give an estimate of the flux at 3727Å to within at least a factor of two, as the U band magnitude has minimal contamination from flux above the 4000Å break).
-
•
X-ray / Optical Flux Ratio – Sources with are very likely to be AGN, and those with are likely to be AGN (see Bauer et al. 2004 and references therein).
-
•
X-ray Hardness Ratio – A good indication of the spectral properties and absorption of X-ray sources is given by the luminosity hardness ratio, , where and . Sources with are unlikely be star-forming due to the very large amounts of absorption required (Mainieri et al. , 2002) (unless the emission is dominated by hard X-ray binaries), and sources with are more likely to be AGN than star-forming (Szokoly et al. , 2004). Hardness ratios were calculated from the background subtracted images which will be described in detail in the paper on extended emission in this field.
-
•
Optical Line Ratios – Line ratios in optical spectra can distinguish between star-forming galaxies and AGN. As the 2dF spectra are not flux calibrated only the [OIII] and H lines were used, as they are close together in wavelength so considering the line equivalent widths, and assuming a flat continuum spectrum, will not introduce overly large errors. Most of the 2dF spectra of the optical counterparts have very faint or no lines so only upper limits can be measured. Lamareille et al. (2004) compare the classification of emission line galaxies using the traditional Baldwin et al. (2003) diagnostic method, and a method based on only blue emission lines (). Their results show that if then the object is almost certainly an AGN. However if the ratio is the object could still contain some AGN activity, and if no lines are visible it may be an obscured AGN, so this method can confirm the presence of an AGN but cannot rule out any AGN activity.
4.4 Details of supercluster AGN candidates
After applying the redshift cut, the candidates for supercluster AGN are reduced to eleven optical matches with secure photometric or spectroscopic supercluster redshifts, two matches with revised photometric redshifts and three less secure matches with confirmed supercluster galaxies. Eleven of the candidate supercluster AGN host galaxies were observed with 2dF, and five do not have spectra.
The details of the candidates are given in the Appendix and in Table 1, including their X-ray and optical properties, images of the host galaxies and spectra where applicable. The spectral energy distribution (SED) of the supercluster galaxies is given in each case as either ‘old red’, ‘dusty star-forming’ or ‘blue-cloud’, as defined in the WGM05 sample from photometric fits to galaxy templates. The morphologies of the host galaxies which are included in the sample of Lane et al. (2007) are also given.
The candidates were assigned to be supercluster AGN, possible supercluster AGN, or rejected outright. The supercluster AGN are sources #20, #24, #34, #37, #71, #79, #81, #104, #105, #135 and #139. The possible AGN is #3. The final sample therefore consists of 11 likely supercluster AGN and 1 possible member. Two sources, #3 and #135, show significant variability in the broad band photometry. These are also the two most luminous sources in the X-ray, and due to the rapid variability must be optical Type I AGN.
All of the AGN hosts appear to be massive galaxies and some appear to be morphologically disturbed. The morphologies assigned to the AGN hosts are indistinguishable from the parent population of luminous cluster members. Detailed study of the smaller scale morphologies of the AGN hosts is beyond the scope of this work, and will be left until recently obtained Hubble Space Telescope images of this field are analysed. The fraction of ‘old red’, ‘dusty star-forming’ and ‘blue-cloud’ host galaxies (as defined in the WGM05 sample from photometric fits to galaxy templates, and excluding the very bright AGN as it is significantly contaminated with AGN optical light) are 0.5, 0.2 and 0.3, compared to fractions in the intermediate density galaxy population of , and , so the AGN hosts are again indistinguishable from the parent population.
It is worth noting that all of the supercluster AGN candidates are classed as galaxies in the COMBO-17 survey as the photometric method is not sensitive to low luminosity Seyfert-like AGN and obviously misses optically obscured AGN. In addition, of the 8 supercluster AGN with optical spectra only 5 have emission lines, and only two have [OIII]/H ratios which would lead to a classification as an AGN using optical data alone. This highlights again the need for X-ray studies to investigate the AGN population.
5 Analysis of AGN properties and environments
The supercluster A901/2 is very diverse and contains a wide range of environments which may have an effect on AGN activity. Eleven X-ray sources in this field are likely to be supercluster AGN. Using the COMBO-17 dataset the properties of the host galaxies of these AGN can be found, and the number of galaxies hosting AGN can be calculated. This information can be used to construct a control sample of galaxies which appear similar to AGN hosts, but do not have significant X-ray emission. By looking at nearby galaxy distributions, the environments of the AGN hosts can then be compared to those of the control sample to determine whether environment and AGN activity are linked.
5.1 Properties of the AGN hosts
The WGM05 supercluster sample contains 795 galaxies, where all galaxies with and absolute Johnson V magnitude were identified as supercluster members. The large redshift range (the same as applied for the AGN in Section 4.3) allows for the errors in the photometric redshifts, and the magnitude cut removes faint objects, which have far less accurate photometric redshifts.

The colour–magnitude diagram for the supercluster is shown in Figure 4, with the supercluster AGN host galaxies indicated (it is important here to note that the R band magnitudes of the host galaxies are not significantly changed by the presence of an AGN, as can be seen directly from the 2dF spectra). All of the AGN and possible AGN lie in bright () galaxies. The X-ray luminosity of the AGN, as indicated by the size of the symbols in Figure 4, shows that the lack of AGN in fainter galaxies is not due to fainter X-ray AGN being found in optically fainter galaxies, which would lead to AGN in lower luminosity galaxies falling below the detection threshold. In fact, if any correlation exists it is likely to be the opposite – there is an 84 per cent chance that more X-ray luminous AGN are found in optically fainter galaxies, according to a Spearman rank test.
To find the range of accretion rates covered by this sample, was calculated for each AGN, where it was assumed that 10 per cent of the bolometric luminosity is emitted in the 0.5–8keV band. The relation of McLure & Dunlop (2002) was used to calculate the black hole mass from the rest frame R-band absolute magnitude () given in the COMBO-17 catalogue (as derived from the galaxy template, corrected to the cosmology of this paper). The resulting plot (Figure 5, excluding the bright source #135), although crude due to the approximations made, appears at first glance to show a correlation between and (which would not be changed by altering many of the assumptions above, for example the 10 per cent emitted in the X-ray, as they would only change the scale of the plot). However, there are more galaxies at than and for the fainter galaxies lower efficiency AGN may fall below the detection limit. To calculate whether the lack of more efficient AGN in more luminous galaxies is due to the smaller sample size or a physical effect it is necessary to know the number of possible AGN hosts as a function of .

5.2 The fraction of galaxies containing a detected AGN
To determine the proportion of galaxies with AGN and the properties of the AGN hosts it is necessary to define a control area in which AGN could have been detected, and compare the galaxies with and without an AGN in this area. To select the control area the COMBO-17 catalogue was cut to remove objects within of the top and sides and of the bottom of the image. This cut ensures the returned area is 97 per cent covered by the X-ray image, and also ensures that the edge of the catalogue does not affect properties such as local density. In addition areas where the sensitivity to point sources decreased significantly due to extended sources or very bright X-ray emission, were removed from the control area: three areas were bright enough to obscure moderate luminosity AGN: a circle around the extended emission to the north-west of A901a (marked with a rectangle in Figure 2), around the AGN in A901a (#135) and around A901b. In these regions the noise level is at least 50 per cent higher than for the rest of the field. At the edge of the excluded regions the faintest detected supercluster AGN (1.8erg/sec) would be detectable at low significance, but the sensitivity towards the centre of #135 and A901b decreases to a level where only AGN brighter than erg/sec would be detectable. No sources are detected in these areas (except for #135 itself), even at low significance. The small changes in detection sensitivity due to emission from A902 and the SW group and the changes in PSF were not included as they only affect very marginal detections, such that the faintest supercluster AGN would still be detected at low significance, and a small change in sensitivity is not significant in a sample of this size. The applied cuts also remove the AGN in A901a (#135) from the sample, which is necessary as it obscures possible AGN activity from all of the surrounding large galaxies so will bias the sample. In addition its high accretion efficiency and luminosity and optical variability show that it, and the one possible supercluster AGN, are the only X-ray Type-I AGN in the sample. The control sample contains 604 supercluster galaxies, as 149 were removed in the edge cut and 42 were in regions where AGN could not be detected.
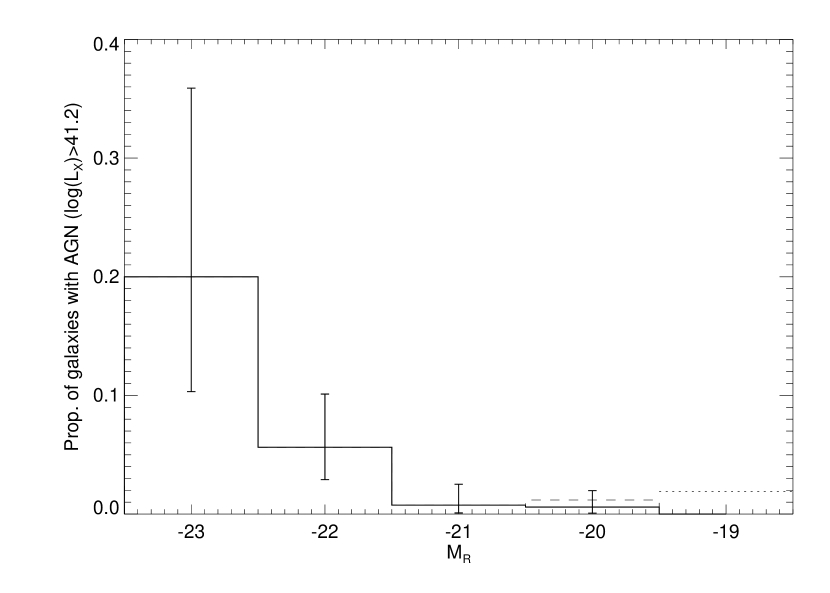
The number of AGN hosts in the supercluster can be directly compared to the number of possible host galaxies in the control sample area. The number of AGN per possible host galaxy is shown in Figure 6 for a range of host luminosities. The total fraction of galaxies with hosting AGN with erg s-1 is 10/253, or 4 per cent. This is similar to the results of Martini et al. (2006), who found a 5 per cent X-ray detected AGN fraction for galaxies with in low redshift clusters at a flux limit of erg s-1. Figure 6 also shows an increase in AGN fraction (above the luminosity limit) in increasingly massive galaxies, but the small sample size means that the error bars are very large. In this supercluster AGN are only found in galaxies with . As stated previously, the luminosities of the AGN show that this is not due to the flux limit of the sample. Rather, it appears that fainter AGN are more likely to be found in more luminous galaxies, brighter AGN in moderately luminous galaxies, and no AGN in the least luminous galaxies.
Returning to Figure 5, it is now clear that the lack of AGN with and is probably due to the lack of bright galaxies, rather than a tendency for more luminous host galaxies to have lower efficiencies: there are only 19 possible AGN host galaxies above this luminosity, and as 3 per cent of fainter () galaxies have accretion efficiencies above it is not surprising to find no bright galaxies with AGN efficiencies above this level. Similarly, the one supercluster AGN with efficiency only corresponds to 0.5 per cent of the galaxies in that 0.5 magnitude bin, explaining the lack of brighter galaxies with similar efficiencies. However there must be a significant decrease in the efficiency of any AGN in galaxies with as the number of supercluster galaxies is very large yet no AGN are observed above the X-ray flux limit.
5.3 Defining a control sample
To compare the AGN environments and properties, control samples were created, consisting of galaxies similar to the AGN hosts, where AGN activity could have been detected but was not found. Whereas a randomly selected control sample would contain many faint galaxies, it is instead preferable to define a control sample with a similar distribution of galaxy properties as the AGN hosts. Any difference between the AGN hosts’ environments and the control sample environments would therefore be due to an environmental effect on AGN.
100 control samples were made, each consisting of 65 of the 183 supercluster galaxies with aperture magnitude which lie in the control area described in Section 5.2 and are not AGN hosts. These samples were selected at random such that there are equal numbers of galaxies in each 0.5 aperture magnitude bin to replicate the distribution of AGN host magnitudes. This method ignores the possible increase in the number of AGN in brighter galaxies (Figure 4) but this is less significant when aperture magnitudes are used, and due to the small number of galaxies selected should not affect any results significantly.
The 100 samples are identical at , due to the small number of available galaxies, but at different sets of galaxies were chosen, although the samples still have considerable overlap with each other. Each of the 100 control samples was compared to the AGN sample and the median statistic taken to reduce the errors. A Kolmogorov–Smirnov (K–S) test (to identify changes in the mean) and Kuiper test (a K–S test using Kuiper’s statistic which is better at identifying changes in spread) confirm that the control samples and AGN hosts are drawn from the same R-band magnitude distribution (at at least 56 per cent confidence for the supercluster AGN).
The colour–magnitude diagram in Figure 4 also shows that at least three AGN hosts are significantly bluer than the red sequence. K–S and Kuiper’s tests on the deviation from the red sequence give 0.59 and 0.48 probabilities that the supercluster AGN hosts and control galaxies are drawn from the same distribution. Martini et al. (2002) found a propensity for AGN hosts to be bluer than similar galaxies in the cluster A2104, but this sample is so small that such an effect cannot be confirmed here.
5.4 The local galaxy densities of AGN host galaxies

The environments of the AGN were evaluated by comparing the local densities of the AGN host galaxies to those of the control samples. The surface mass density from the weak-lensing analysis in Gray et al. (2002) was not used as the sample of AGN is small and they lie in areas (outside cluster cores) where the errors are quite large, such that any results would have very low significance. Instead, the projected galaxy density was used, following the method for the WGM05 sample, where is defined as the number of supercluster galaxies per (Mpc h-1)2 within a circle with a radius given by the average distance to the 9th and 10th nearest neighbours. The supercluster sample uses only the brightest galaxies as defined in Section 5.1.
The distributions of for the control samples and the supercluster AGN are shown in Figure 7. The AGN host galaxies lie predominantly in areas of moderate density compared to the control sample, with a significance of 98.4 per cent and 99.0 per cent from Kuipers and the K–S test respectively. It is particularly clear that AGN hosts avoid the densest regions of the supercluster, even accounting for the fact that two of the cluster cores are removed from this study. The exception, of course, is the very luminous AGN in the core of A901a, which was excluded, along with the surrounding galaxies, as they do not lie in the control area. This source is different in both properties and position from the other AGN in the supercluster.
5.5 The types of environments that contain AGN
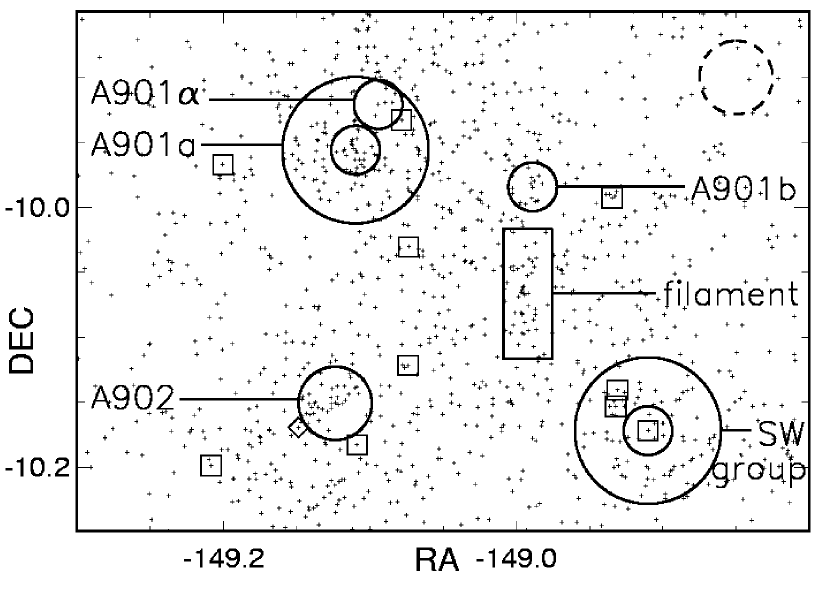
The supercluster contains a wide range of environments which are evident by eye, such as clusters, groups and filaments of galaxies. In order to better classify the environments of AGN, it is desirable to find a method of distinguishing between these environments in terms of their properties. As a first step, areas which fall into a clear environmental category were selected by eye, as shown in Figure 8. Although arbitrarily defined, the properties of galaxies in these areas can help to work out what properties distinguish different environments, and hence to define the environments of other supercluster galaxies and the AGN hosts.
The regions were defined as follows: cluster and group regions are circles of radius, centred on the brightest cluster galaxy. As A902 does not have a clear centre, a radius of is used to include the whole cluster region. For the rich cluster A901a and the SW group a second region out to radius is considered, marking the cluster and group edge environments. The filament region, with a large number of blue galaxies, is marked with a rectangle.
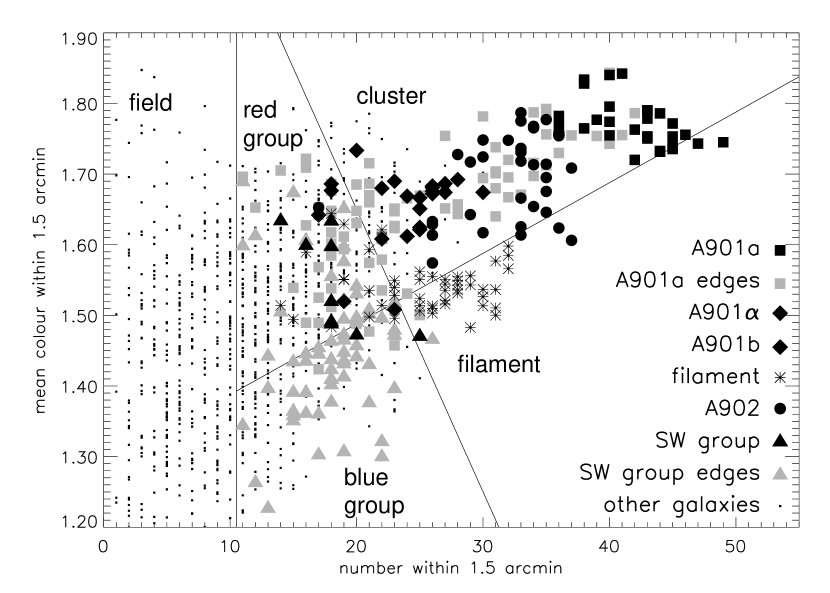
There are many possible ways to define galaxy environments, such as mean local luminosity, galaxy colour or distance from the rest frame U-V colour-magnitude main sequence (as used by Gray et al. 2004), but not all of these were found to be useful in distinguishing between the predefined areas in Figure 8. It was found that the galaxies in different environments could not be separated well purely in terms of local projected density, and that two other factors are also important: firstly the number of less luminous galaxies, and secondly the colour of the local galaxies. The distance from the colour-magnitude relation was investigated as a measure of colour, but the environments were better separated using the measured colour, as the latter combines colour with a distinction between bright and faint galaxies. The mean local colour was used as this measure is sensitive to the presence of a few very blue or active galaxies, wheras the median colour is dominated by red galaxies on the colour-magnitude main sequence (Figure 4), and is more a measure of local magnitude. To include fainter galaxies the supercluster sample was widened to include galaxies with aperture magnitudes . At this magnitude the redshift errors are larger, and so a magnitude dependent redshift cut was used to give an 80 per cent complete sample. The magnitude dependent redshift cut traces the increase in photometric redshift errors, and is given by
| (8) |
where
| (9) |
with a minimum cut of 0.015 as used previously. The broader redshift cut starts to take effect at , and the level of contamination is per cent at and per cent at . Although the broader sample includes far more contamination from field galaxies, this will be uniform across the field of view. Plotting the spatial positions of the fainter galaxies shows that a significant number are associated with the supercluster, and these are instrumental in distinguishing between the different environments in the following analysis.
Using this sample, the number and mean B-R colour of all supercluster galaxies within a projected distance of 1.5 arcmin was found for each supercluster member, which corresponds to 250kpc at the supercluster redshift. The size of this region is illustrated in Figure 8, and was chosen to be large enough to include a statistically significant number of galaxies, with an average of 14 supercluster members within this radius for objects in the control area.
Plotting the local galaxy density and local mean colour is a good method of distinguishing between different environments, as shown in Figure 9. The galaxies in clusters all lie on a local number density and local colour ‘main sequence’ of increasing local number and red colour, whereas the environment of filament galaxies is considerably bluer than that of cluster galaxies at the same number density. It is conceivable that the slope of the ‘main sequence’ could be caused by contamination by field galaxies, as galaxies with higher redshift errors are fainter and therefore bluer than secure supercluster members. Although these field galaxies will be uniformly distributed across the field they will have a larger effect on the mean local colour in sparsely populated areas. Indeed the faint galaxies are found to be a major contributor towards the slope of the ‘main sequence’. However a closer analysis finds that the faint galaxies which contribute to the local colour and density at the dense red end of the ‘main sequence’ are significantly (0.2 magnitudes) redder than those contributing to the group end. This fact, together with their spatial distribution, confirms that significant numbers of the faint galaxies are supercluster members, and shows that the colour variation between different environments is not caused by random field contamination but rather is influenced by changes in the faint galaxy population.
Locations in the local colour – number plane can now be used as a means of defining the local environment for other supercluster galaxies, which don’t lie in the defined regions in Figure 8. The regions are separated as shown in Figure 9: a line parallel to the best fit to the ‘main sequence’ is used to mark the boundary between cluster and filament-like environments, and a line perpendicular to this marks the beginning of group-like environments. The redder part of the group-like environments contains galaxies in the outskirts of A901a, so this region is split into red group-like and blue group-like environments by a continuation of the cluster/filament boundary. Finally, the field-like environment was selected to contain none of the galaxies from the defined regions.
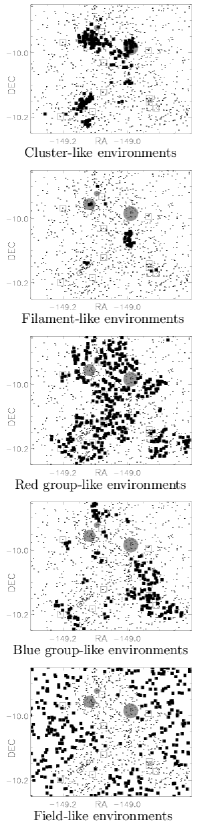
Figure 10 shows the distribution of supercluster galaxies in each type of environment – it is clear that local colour and density are indeed excellent at separating environments. This classification by local environment rather than by arbitrarily defined region is important – for example, although some galaxies in the cluster-like environment are not actually in the defined clusters, the galaxy will experience many of the same environmental effects as a cluster galaxy. In addition this method identifies regions such as small groups which are difficult to define by eye. The red and blue group-like environments contain mainly galaxies in cluster outskirts and the SW group respectively. It is worth noting that the same analysis for local density alone, or by , is far less successful, with mixing between filaments and cluster cores, and also groups and smaller clusters. Also, by plotting local colour, rather than deviation from the colour-magnitude red sequence, this plot also has a mass dependence, as the bluer galaxies are generally less massive.
The environments of the AGN and control samples can now be evaluated in terms of this scheme. Figure 11 shows the distribution of the supercluster AGN (excluding the bright source #135) and that of the control samples described in Section 5.3. As the control samples do not include galaxies in three regions where AGN activity could not be detected (shown in Figure 10) there are less galaxies in the top right of this figure compared to Figure 9, but there are still many control galaxies in the cluster-like environment. Figure 11 shows that the supercluster AGN all lie within or very close to the red and blue group-like environments in local number – colour space. This is very different from the distribution of the control samples, where a significant proportion lie in filament or cluster-like environments, as well as in the field. In particular the AGN hosts in slightly higher density areas (15 to 20 local galaxies) are all found in bluer areas, whereas in the control sample the average local colour at this density is far redder. A two-dimensional K–S test in the local number vs local mean colour plane gives a probability of only 0.042 that the supercluster AGN were drawn from the control samples. Comparing with the control samples in each region separately, the probability that the AGN are drawn purely from the control sample in the red and blue group-like environments is 0.27, compared to for the other environments. In addition a Kuiper’s test on the deviation from the line perpendicular to the local colour / density ‘main sequence’ gives a probability of 0.009 that the AGN hosts are drawn from the same population as the control samples (compared to 0.3 for deviation in density only). It can therefore be asserted, at a per cent confidence level, that the prevalence of AGN is affected by the environment. With the exception of the very densest areas (35 galaxies within 1.5 arcminutes, where we are not generally sensitive to X-ray emission from AGN) the supercluster AGN are preferentially found in moderate density red or blue environments or slightly denser environments if the local environment is also bluer.
To search for large scale or local effects, the local number and mean colour of the AGN and control samples were also investigated taking regions of radius 0.5′and 3.0′. There are no significant deviations (to 95 per cent) between the AGN and control samples, so there is no evidence for AGN activity being triggered by very local effects, such as mergers, and also by larger scale effects.

As an aside, it is interesting to note that both the possible supercluster AGN and the excluded source #135 do not follow the trend for the main sample of supercluster AGN in Figure 11. The co-ordinates where #135 would fall is given in the figure caption. Both of these AGN are confirmed as optical Type-I by their high () optical variability, which is not seen in the other sources. Source #135 is in a very different environment from the rest of the AGN, being very close to the centre of the A901a cluster, but the possible supercluster AGN host, #3, is in a less distinct environment.
6 Conclusions
6.1 AGN host galaxies and properties
This sample consists of 11 X-ray sources which are likely to be AGN in the supercluster A901/2, with erg s-1. Ten of these sources lie outside the very cores of the clusters. The one bright AGN very near the centre of A901a is not included in this study as it is in an unusual environment, being near the centre of a massive potential well, as well as being in an area that has to be excluded from the analysis due to the high level of X-ray emission, to the extent that moderate luminosity AGN could not be detected in this region. The purpose of this study is not to investigate the most extreme environments, but rather to focus on more ‘normal’ galaxies and environments, beyond 200 kpc from the cluster centre. It is possible that a source which is classed as a ‘supercluster AGN’ is actually a galaxy with a highly obscured massive starburst, or a chance alignment with a background quasar.These scenarios are unlikely, as explained in previous sections, and removing a source from the sample will not change the conclusions of this study. The properties of the AGN host galaxies and a comparison with the galaxies without AGN led to the following results;
-
•
The AGN host galaxies are all luminous, with . Most of the host galaxies lie on the cluster colour–magnitude red sequence, but a number are bluer, possibly due to emission from the AGN. Of the 8 AGN with optical spectra, only two would have probably been identified as AGN from optical data alone.
-
•
There is a no increase in AGN luminosity with optical luminosity of the host galaxies. Formally, the best fit correlation is negative, with the brightest AGN lying in galaxies with , but this is of low significance.
-
•
More luminous galaxies are more likely to host an AGN above the X-ray flux limit. However, when the AGN accretion is measured in terms of luminosity per unit black hole mass, the small sample size and flux limits mean that that no clear correlation is seen.
-
•
There is no propensity for AGN host galaxies to have a particular morphology, as defined in Lane et al. (2007).
These results are generally unsurprising. The preference for optically detected AGN to lie in more luminous galaxies is well known (see for example Ho et al. 1997, and Kauffmann et al. 2003), and is even more pronounced for radio-loud AGN (e.g. Best et al. 2005). The fraction of galaxies hosting AGN is comparable to the Martini et al. (2002) result for the cluster A2104.
The lack of direct correlation, and possible inverse correlation between and is not what might have been expected. Similar results were found for cluster AGN by Martini et al. (2006), who find that galaxies more luminous than are more likely to host faint rather than bright X-ray sources, whereas no such statement could be made for fainter galaxies. This is possibly due to the effect of the supercluster environment. If the AGN are being triggered by the supercluster environment then smaller galaxies are more likely to suffer large gravitational disturbances which can affect the central regions of the galaxy, and perhaps provide fuel for the AGN. However, it may simply be that larger galaxies are older and have used up much of the gas in the central regions in previous AGN activity.
6.2 AGN environments
The environments of the AGN host galaxies were compared to those for a control sample of similar galaxies in which AGN activity could have been detected but was not (the cores of three clusters were therefore excluded from this analysis). The following conclusions were drawn;
-
•
The AGN host galaxies are in areas of moderate galaxy density, and strongly avoid the densest areas, with the exception of one AGN very near the centre of a cluster. The distribution of for AGN is different to that for the control samples with per cent significance.
-
•
There are strong correlations between AGN activity and the local environment within 250 kpc, but much less so with larger scale or smaller scale environments. There is no correlation with distance to the nearest neighbour.
-
•
The environments in A901/2 can be split according to local galaxy number density and local mean B-R colour (which also traces mass as smaller galaxies are bluer). The distribution of the AGN host galaxies is significantly (98 per cent) different to that of the control sample, with AGN found in areas of moderate density or slightly higher density and bluer colour, similar to cluster outskirts and groups. Galaxies in cluster-like environments, the blue filament and the field are less likely to host AGN. No secure AGN are found in areas with nearby galaxies but red colours, such as the centres of small clusters, whereas AGN are found in similar density environments with more blue galaxies.
It is clear from these results that the AGN are affected by their environment, although the small sample size requires caution when drawing conclusions. As three cluster centres (with radii of 90, 190 and 240 kpc, shown in Figure 10) are not studied due to the high X-ray background, conclusions cannot be drawn for cluster cores, but there are still many control galaxies in high density regions that do not have AGN activity. The lack of AGN in low density regions suggests that the AGN activity is enhanced relative to the field, and the lack of AGN in the highest density regions shows that this enhancement is followed by either suppression or a return to the field values. The main conclusion, that AGN lie predominantly in cluster outskirts and groups, suggests that AGN are triggered by joining a denser environment. Heckman et al. (2004) find that the peak of optically detected AGN activity ([OIII] emission) occurs in galaxies with properties between those of young star-forming galaxies and old, quiescent bulge-dominated galaxies. These results suggest that AGN activity could be linked to the transformation of field galaxies to cluster members.
This result at first appears to be in contrast to that of Martini et al. (2007), who show that AGN with erg s-1 in eight clusters have a radial distribution, measured from the cluster centre, which is consistent with that for the luminous galaxies without AGN. However, when the same analysis is performed on A901/2, using the distance to the nearest cluster (both including and excluding the SW group), there is also no significant difference between the distributions for the AGN and control samples. The links between environment and AGN activity in this supercluster are therefore not detectable if only cluster-centric distance is compared, and are not in opposition to the results of Martini et al..
The AGN exist in areas of moderate density, but also in slightly denser areas which are dominated by bluer galaxies. Two possible interpretations for this are either that the bluer mean colour indicates a higher level of activity in the surrounding galaxies, or that the local environment is dominated by smaller galaxies. In the latter case, if the bluer environments of some AGN are due to a larger number of small galaxies, this would possibly suggest minor mergers with small galaxies as the trigger for AGN activity. Adding a third dimension of local mean may help to resolve this issue, but the current sample is considered too small for this analysis.
If, on the other hand, the bluer environments of some AGN are due to areas with enhanced star-formation, it suggests that the same processes that trigger star-formation also trigger AGN activity. This would agree with the results of Coldwell & Lambas (2003), who find that optically identified AGN lie in regions containing more emission line galaxies. In A901 the correlations between optically detected star-formation and density (Gray et al. , 2004) show that star-formation is suppressed in cluster cores, rather than triggered in cluster outskirts. In contrast the photometrically detected “dusty star-forming galaxies” in the WGM05 sample are, like the AGN hosts, mainly found in intermediate density environments. However, there is no propensity for AGN to reside in galaxies of any particular type in this scheme. Also no correlation is found between the WGM05 host type and the AGN local density, luminosity or position. The transformation processes which create the dusty red population could also cause AGN activity, but the two populations do not appear to be linked directly.
In conclusion, in this supercluster AGN activity is strongly linked to environment, and occurs predominantly in moderate density regions, which are often bluer than average for this supercluster, similar to (but not limited to) cluster outskirts and blue groups.
Acknowledgments
The authors wish to thank Kyle Lane and Alfonso Aragón-Salamanca for supplying the morphologies of the AGN hosts from their sample in Lane et al. (2007). OA and PNB acknowledge the support of the Royal Society. CW was supported by a PPARC Advanced Fellowship.
References
- Abadi et al. (1999) Abadi M. G., Moore B., Bower R. G., 1999, MNRAS, 308, 947
- Abell (1958) Abell G. O., 1958, ApJS, 3, 211
- Arnaud et al. (2002) Arnaud, M. et al , 2002, AAP, 390, 27
- Baldwin et al. (2003) Baldwin J. A., Phillips M. M., Terlevich R., 1981, PASP, 93, 5
- Barr et al. (2003) Barr J. M., Bremer M. N., Baker J. C., Lehnert M. D., 2003, MNRAS, 346, 229
- Bauer et al. (2004) Bauer F. E., Alexander D. M., Brandt W. N., Schneider D. P., Treister E., Hornschemeier A. E., Garmire G. P., 2004, AJ, 128, 2048
- Bauer et al. (2000) Bauer F. E., Condon J. J., Thuan T. X., Broderick J. J., 2000, VizieR Online Data Catalog, 212, 90547
- Best (2004) Best P. N., 2004, MNRAS, 351, 70
- Best et al. (2005) Best P. N., Kauffmann G., Heckman T. M., Brinchmann J., Charlot S., Ivezić Ž., White S. D. M., 2005, MNRAS, 362, 25
- Best et al. (2002) Best P. N., van Dokkum P. G., Franx M., Röttgering H. J. A., 2002, MNRAS, 330, 17
- Best et al. (2006) Best P. N., von der Linden A., Kauffmann G., Heckman T. M., Kaiser C. R., 2007, MNRAS in press ArXiv0611197
- Branchesi et al. (2007) Branchesi, M., Gioia, I. M., Fanti, C., Fanti, R., Cappelluti, N., 2007, AAP, 462, 449
- Byrd & Valtonen (1990) Byrd G., Valtonen M., 1990, ApJ, 350, 89
- Cappelluti et al. (2005) Cappelluti N., Cappi M., Dadina M., Malaguti G., Branchesi M., D’Elia V., Palumbo G. G. C., 2005, AAP, 430, 39
- Cappi et al. (2001) Cappi M. et al. , 2001, ApJ, 548, 624
- Coldwell & Lambas (2003) Coldwell G. V., Lambas D. G., 2003, MNRAS, 344, 156
- Coldwell et al. (2002) Coldwell G. V., Martínez H. J., Lambas D. G., 2002, MNRAS, 336, 207
- Condon et al. (1998) Condon J. J., Cotton W. D., Greisen E. W., Yin Q. F., Perley R. A., Taylor G. B., Broderick J. J., 1998, AJ, 115, 1693
- Dressler (1980) Dressler A., 1980, ApJ, 236, 351
- Dressler et al. (1984) Dressler A.,Thompson, I. B. Shectman, S. A., 1984, BAAS, 16, 881
- Ebeling et al. (1996) Ebeling H., Voges W., Bohringer H., Edge A. C., Huchra J. P., Briel U. G., 1996, MNRAS, 281, 799
- Edge (1994) Edge A., 1994, in Robinson A. & Terelevich R., ed., The Nature of Compact Objects in Active Galactic Nuclei: Active galactic nuclei in clusters of galaxies. CAP, pp 125–128
- Freeman et al. (2002) Freeman P. E., Kashyap V., Rosner R., Lamb D. Q., 2002, ApJS, 138, 185
- Gómez et al. (2003) Gómez P. L. et al. ,2003, ApJ, 584, 210
- Gray et al. (2002) Gray M. E., Taylor A. N., Meisenheimer K., Dye S., Wolf C., Thommes E., 2002, ApJ, 568, 141
- Gray et al. (2004) Gray M. E., Wolf C., Meisenheimer K., Taylor A., Dye S., Borch A., Kleinheinrich M., 2004, MNRAS, 347, L73
- Heckman et al. (2004) Heckman, T. M., Kauffmann, G., Brinchmann, J., Charlot, S., Tremonti, C., White, S. D. M., 2004, ApJ, 613, 109
- Henry & Briel (1991) Henry J. P., Briel U. G., 1991, AAP, 246, L14
- Ho et al. (1997) Ho L. C., Filippenko A. V., Sargent W. L. W., 1997, ApJS, 112, 315
- Hopkins et al. (2003) Hopkins A. M. et al. ,2003, ApJ, 599, 971
- Johnson et al. (2003) Johnson O., Best P. N., Almaini O., 2003, MNRAS, 343, 924
- Kauffmann et al. (2003) Kauffmann G. et al. ,2003, MNRAS, 346, 1055
- Kauffmann et al. (2004) Kauffmann G., White S. D. M., Heckman T. M., Ménard B., Brinchmann J., Charlot S., Tremonti C., Brinkmann J., 2004, MNRAS, 353, 713
- Kim & Fabbiano (2004) Kim D.-W. & Fabbiano, G. 2004, ApJ, 611, 846
- Kim et al. (2004) Kim D.-W. et al. ,2004, ApJS, 150, 19
- Kim et al. (2004) Kim D.-W. et al. ,2004, ApJ, 600, 59
- Lamareille et al. (2004) Lamareille F., Mouhcine M., Contini T., Lewis I., Maddox S., 2004, MNRAS, 350, 396
- Lane et al. (2007) Lane K, 2007, MNRAS in press.
- Larson et al. (1980) Larson R. B., Tinsley B. M., Caldwell C. N., 1980, ApJ, 237, 692
- Lazzati et al. (1998) Lazzati D., Campana S., Rosati P., Chincarini G., Giacconi R., 1998, AAP, 331, 41
- Lewis et al. (2002 ) Lewis I. et al. ,2002, MNRAS, 334, 673
- Magorrian et al. (1998) Magorrian J. et al. ,1998, AJ, 115, 2285
- Mainieri et al. (2002) Mainieri V., Bergeron J., Hasinger G., Lehmann I., Rosati P., Schmidt M., Szokoly G., Della Ceca R., 2002, AAP, 393, 425
- Mann et al. (1997) Mann R. G. et al. , 1997, MNRAS, 289, 482
- Martini et al. (2007) Martini P., Mulchaey, J. S., Kelson D. D., 2007, ApJ in press, Astro-ph arXiv0704.3455
- Martini et al. (2006) Martini P., Kelson D. D., Kim E., Mulchaey J. S., Athey A. A., 2006, ApJ, 644, 116
- Martini et al. (2002) Martini P., Kelson D. D., Mulchaey J. S., Trager S. C., 2002, ApJl, 576, L109
- McLure & Dunlop (2002) McLure R. J., Dunlop J. S., 2002, MNRAS, 331, 795
- Mihos & Hernquist (1996) Mihos J. C., Hernquist L., 1996, ApJ, 464, 641
- Miller et al. (2003) Miller C. J., Nichol R. C., Gómez P. L., Hopkins A. M., Bernardi M., 2003, ApJ, 597, 142
- Miller & Owen (2003) Miller N. A., Owen F. N., 2003, AJ, 125, 2427
- Molnar et al. (2002) Molnar S. M., Hughes J. P., Donahue M., Joy M., 2002, ApJl, 573, L91
- Moore et al. (1998) Moore B., Lake G., Katz N., 1998, ApJ, 495, 139
- Oemler (1974) Oemler A. J., 1974, ApJ, 194, 1
- Pellegrini (2005) Pellegrini S., 2005, ApJ, 624, 155
- Peres et al. (1998) Peres C. B., Fabian A. C., Edge A. C., Allen S. W., Johnstone R. M., White D. A., 1998, MNRAS, 298, 416
- Ranalli et al. (2003) Ranalli P., Comastri A., Setti G., 2003, AAP, 399, 39
- Reddy & Yun (2004) Reddy N. A., Yun M. S., 2004, ApJ, 600, 695
- Ruderman & Ebeling (2005) Ruderman J. T., Ebeling H., 2005, ApJl, 623, L81
- Rutledge et al. (2000) Rutledge R. E., Brunner R. J., Prince T. A., Lonsdale C., 2000, ApJS, 131, 335
- Schindler (2000) Schindler S., 2000, AAPs, 142, 433
- Sun et al. (2007) Sun M., Jones C., Forman W., Vikhlinin A.,Donahue M. Voit M., 2007 ApJ, 657, 197
- Sutherland & Saunders (1992) Sutherland, W. and Saunders, W., 1992, MNRAS, 259, 413
- Szokoly et al. (2004) Szokoly G. P. et al. ,2004, ApJS, 155, 271
- Taylor et al. (2004) Taylor A. N. et al. ,2004, MNRAS, 353, 1176
- Taylor E. L. et al. (2005) Taylor E. L. et al. , 2005, MNRAS, 361, 1352
- Wake et al. (2005) Wake D. A., Collins C. A., Nichol R. C., Jones L. R., Burke D. J., 2005, ApJ, 627, 186
- Wolf et al. (2003) Wolf C., Meisenheimer K., Rix H.-W., Borch A., Dye S., Kleinheinrich M., 2003, AAP, 401, 73
- Wolf et al. (2004) Wolf C. et al. ,2004, AAP, 421, 913
- Wolf et al. (2005) Wolf C., Gray M. E., Meisenheimer K., 2005, AAP, 443, 435
7 Appendix
This appendix contains details of the individual X-ray sources which were possibly supercluster AGN and their classifications. The images and spectra, where applicable, are shown in Figures 12 and 14, and details are given in Table 1.
-
X-ray ID LX (erg/sec) HR Optical ID Redshift Optical properties 3 5.25 0.18 12953 1.4(phot) variable, blue-cloud or contaminated by AGN 20 8.1 0.03 31178 0.158 Sa, blue-cloud 24 7.8 -1.0 36966 0.170 E, old-red 34 6.9 0.7 39549 0.163 Sab, dusty-starforming 37 2.4 -1.0 14161 0.171(phot) E, old-red 71 3.0 0.53 11827 0.175(phot) Sb, blue-cloud 79 1.8 -0.75 44351 0.161 E, old-red 81 1.8 -1.0 19305 0.168 S0, blue-cloud 104 8.6 0.95 15698 0.170 Sab, dusty-starforming 105 3.6 0.0 17675 0.171 E, old-red 135 1.55 0.03 41435 0.33(phot) early-type, variable, contaminated by AGN 139 2.56 1.0 9020 0.169 S0, old-red Table 1: Properties of supercluster AGN and possible supercluster AGN. Details of each source are given in the text. -
•
# 3 – possible supercluster AGN. The high X-ray flux indicates that this source is clearly an AGN if it is in or behind the supercluster. The host galaxy identification is secure, with a photometric redshift of 1.4, but the optical object is highly variable and the broad band photometric data points taken on different days vary by up to 15. This indicates AGN activity, and this contamination may explain the photometric redshift. It is very unlikely that the redshift of 1.4 is correct as the galaxy would then have to be three magnitudes more luminous than the brightest supercluster member. However, a visual fit to a galaxy template (Figure 13) is fair, suggesting that it may be in the supercluster. In addition the colours of this galaxy place it on the cluster main-sequence. Over 77 per cent of similar galaxies (within ) are within the supercluster.
-
•
# 11 – rejected. A high hardness ratio (0.49) and moderate flux indicate a probable AGN. However, there are two possible optical counterparts, and only object #51604 is in the supercluster. The spectrum and image of the supercluster member show a very luminous Sa galaxy with an ‘old red’ SED and no emission lines. The non supercluster member is both closer to the X-ray source and a probable quasar, which are often X-ray luminous (50 per cent of the COMBO-17 QSOs with are detected as X-ray sources, and per cent of the possible QSOs are also detected) and are rare compared to galaxies. Combining the distance of each object from the X-ray source and the number of bright QSOs in the field to that of bright galaxies, both matches are 99 per cent significant. However, the match with the QSO is four times more probable, and when the Spitzer data is taken into account the QSO match becomes even more likely (see Table LABEL:A901table).
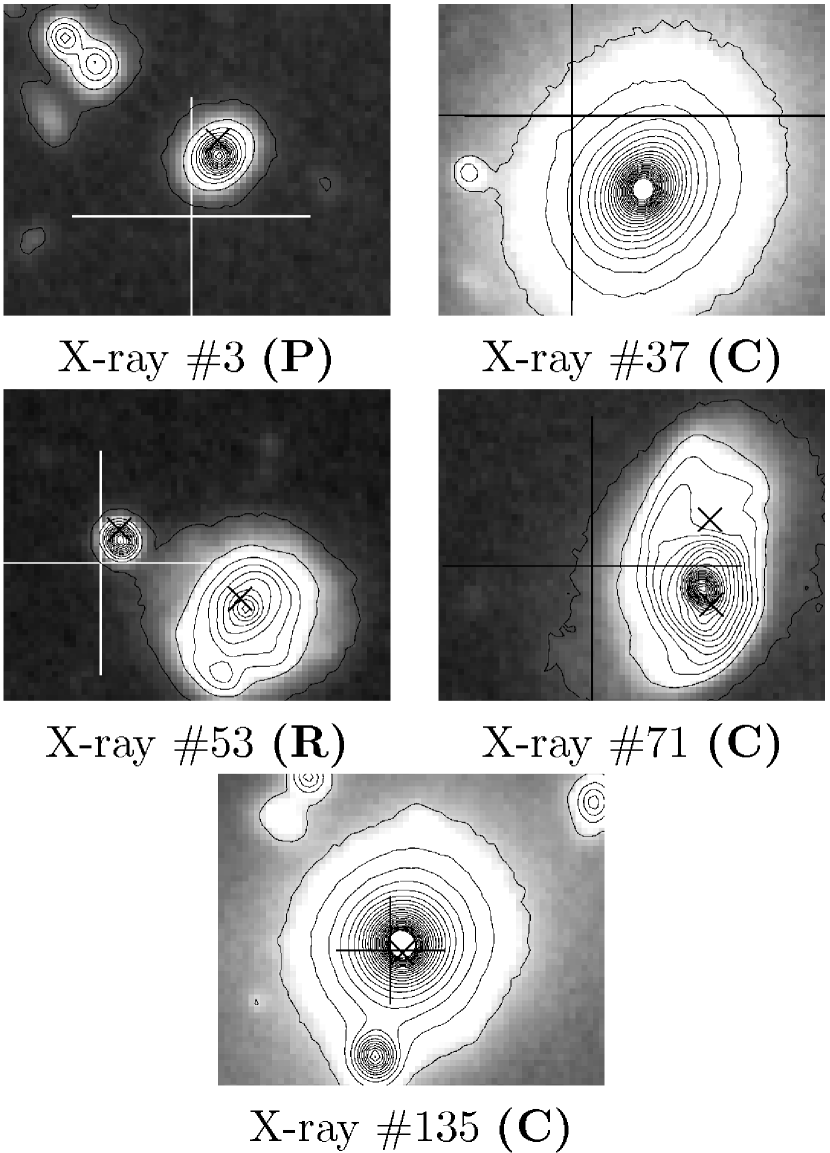
Figure 12: R-band images of candidate supercluster AGN which were not observed with 2dF. The scale and symbols are the same as in Figure 14. -
•
# 20 – supercluster AGN. The 2dF spectrum of the securely identified host galaxy shows weak emission lines. The X-ray emission could be caused by a galaxy with a SFR of and no AGN but this is inconsistent with the SFR implied by the [OII] line luminosity () and the nature of the galaxy in the 2dF spectrum. It is therefore concluded that this galaxy contains an AGN which is optically obscured. This conclusion is backed by the moderate X-ray luminosity and X-ray to optical flux ratio of 0.12.
-
•
# 24 – supercluster AGN. The host galaxy spectrum has an upper limit on the SFR from [OII] of which is 500 times less than that required to explain the X-ray emission. Again, this must be due to optically obscured AGN activity. The X-ray/Optical flux ratio also indicates an AGN.
-
•
# 34 – supercluster AGN. The high hardness ratio makes AGN activity very likely, and the host galaxy is in the supercluster. The [OII] line flux gives a star-formation rate which is at least 25 times too low to account for the X-ray emission.
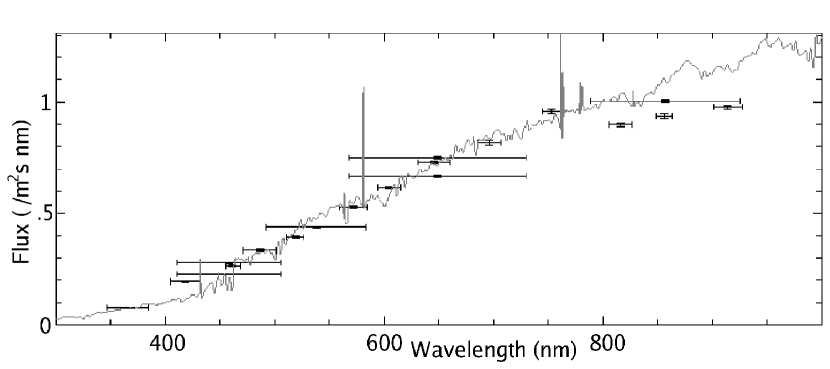
Figure 13: The COMBO-17 data and a z=0.16 galaxy template for optical object 12953, associated with X-ray source # 3. High levels of variability were observed in the and bands, which were re-observed over multiple runs, and which encompass the [OII] and [OIII] emission lines at this redshift, indicating that the galaxy contains significant AGN light and could be at . Above 800nm the data and template do not match well as the illustrated template is not dust reddened – a bluer galaxy template with dust reddening would fit far better. In addition the majority of galaxies with similar properties as object 12953 are confirmed supercluster members. It is possible, but by no means certain, that this is the correct redshift for this object. -
•
# 37 – supercluster AGN. Moderate X-ray luminosity and no detectable hard X-ray emission indicate a weak AGN or moderately powerful starburst. The optical counterpart is an elliptical supercluster galaxy but the probability of a match is only 0.8 as the error on the X-ray position is very large. This galaxy has a COMBO-17 ‘old red’ fit to the SED, is the brightest galaxy in the south-west group and falls on the main sequence of the colour magnitude diagram. Other sources with similar properties but with optical spectra ( in particular #79 and #24 ) are found to be optically-obscured AGN. The galaxy was detected in the NVSS (Condon et al. , 1998) so is a radio source. The match with the radio data secures the X-ray – optical association, and makes it very probable that this source is a supercluster AGN.
-
•
# 53 – rejected. A soft, moderate luminosity (erg s-1) X-ray source with two possible optical counterparts, only one of which is in the supercluster. The non-supercluster object is twice as likely to be the match by position and luminosity only, and is also an optical quasar. Taking into account the small number of bright quasars in this field, and the high probability of them having detectable X-ray emission, the quasar is highly unlikely to be a random association.
-
•
# 71 – supercluster AGN. This source is securely identified with a supercluster galaxy, without a 2dF spectrum. The high hardness ratio and X-ray luminsosity indicate AGN activity.
-
•
# 79 – supercluster AGN. The optical spectrum of the supercluster host is that of a red early-type galaxy, whose emission lines indicate at least 150 times too little star formation to account for the X-ray emission.
-
•
# 81 – supercluster AGN. The X-ray emission is clearly centred on a supercluster galaxy. The [OIII]/H ratio from the 2dF spectrum (taking an upper limit on the non detection of H) is 7.5, indicating that this source is likely to be an AGN. Despite being prominent, the [OII] line flux is still 12 times too low to account for the X-ray emission through star formation.
-
•
# 104 – supercluster AGN. This source is securely identified with a supercluster galaxy. A hardness ratio of 0.95 and of 0.22 make this an unambiguous AGN in the X-ray.
-
•
# 105 – supercluster AGN. This X-ray source is securely identified with a supercluster galaxy. The moderate X-ray luminosity could not be caused by star-formation, as the optical spectrum is a red galaxy with no detectable emission lines.
-
•
# 119 – rejected. The X-ray emission clearly emanates from a supercluster galaxy. A hard X-ray spectrum, moderate X-ray luminosity, but low appear to indicate an AGN or highly obscured star-burst. The optical spectrum is clearly a blue star-forming galaxy. However the observed [OII] flux is not quite enough to account for all of the X-ray emission through star-formation. To test whether this is due to a significant amount of dust extinction the H/H ratio was calculated, using the equivalent widths of the lines and the continuum flux density in the Å narrow-band filter to calculate the flux from H, and the mean flux densities in the Å and Å COMBO-17 bands to calculate the flux from H. The ratio is 1.35 times
lower than it should be, which can be accounted for by a E(B-V) dust extinction of 0.677 magnitudes. Accounting for this, the [OII] SFR is 43 M⊙/yr, which agrees (within errors) with the X-ray SFR of 30 M⊙/yr. The source is clearly a star-forming supercluster galaxy, so is rejected.
-
•
# 127 – rejected. A hardness ratio of 0.25 indicates a probable AGN. This source has two possible optical counterparts, with the non-supercluster object being both ten times closer to the X-ray position and a quasar. Accounting for the number of luminous QSOs in the sample (90 with ), compared to galaxies brighter than the possible supercluster host (285) the quasar is the most probable counterpart by far. However, the spectrum of the supercluster object has [OII] and [OIII] emission lines, so it is a possible source of X-rays from star-formation or an AGN. The X-ray source appears to be a blend of two sources with an elongation in the direction of the supercluster galaxy – if this is the case then the supercluster galaxy could contain a very faint AGN. However the most likely source of the X-rays remains the QSO, and this source is therefore rejected.
-
•
# 135 – supercluster AGN. The X-ray spectrum of this very luminous source is well fit by a power law, so must be an AGN. The initial COMBO-17 photometric redshift of the host galaxy was 0.33, but the colours and position (a large, moderately red galaxy near the centre of A901a) indicate supercluster membership. A visual fit to a red early-type galaxy template is excellent above 4000Å as shown in Figure 15. The discrepancy can be accounted for by the variability of the source (only this source and #3 are variable by ) and also by adding a UV excess caused by the emission from the AGN. A spectrum of the host galaxy was taken by Bauer et al. (2000), with the caveat that the spectrum was “poor quality”, and the redshift was given as 0.1585. The excellent optical match, spectroscopic redshift and position of the emission relative to A901a lead to the conclusion that this is a supercluster AGN. This source may be significantly contaminated by optical AGN light.
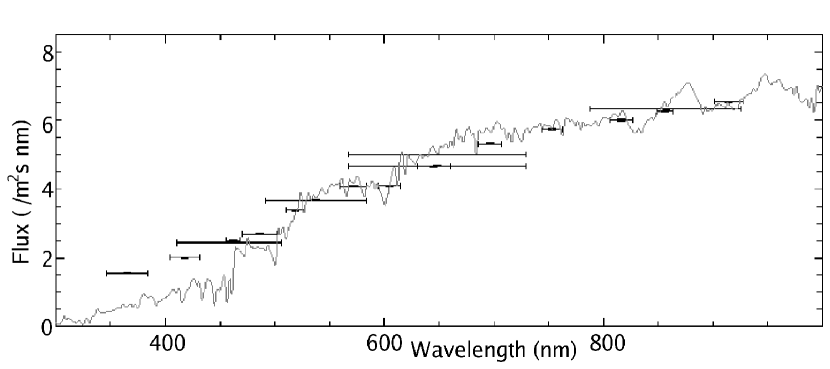
Figure 15: The COMBO-17 data and a z=0.16 template for optical object 41435, associated with X-ray source # 135. The template has been selected by eye as a best guess early-type template at this redshift. Adding excess UV light from an obscured AGN would give a good fit, indicating that this source is likely to be in the supercluster. The source is variable in the broad band at significance. -
•
# 139 – supercluster AGN. A high hardness ratio and X-ray luminosity, together with [OIII]5007/H make this a certain AGN, and it is securely associated with a supercluster galaxy.
![[Uncaptioned image]](/html/0707.1517/assets/x15.png)
| Table 2 | |||||||||||||
|---|---|---|---|---|---|---|---|---|---|---|---|---|---|
| ID(X) | RA(X)∗ | Dec(X)∗ | Error⋆ | Rate♯ | ID(Opt) | RA(Opt)∗ | Dec(Opt)∗ | Rel† | Prob‡ | F(Sp)♭ | P(Sp)$ | Notes | |
| 1 | 09:56:36.7 | -10:02:39.2 | 0.00185 | 0.80 | 28832 | 9:56:36.5 | -10:02:43.5 | 0.253 | 0.852 | 0.852 | 0.39 | 0.79 | |
| 2 | 09:56:35.9 | -09:53:29.2 | 0.00095 | 2.11 | 48944 | 9:56:35.7 | -09:53:28.7 | 0.769 | 0.850 | 0.522 | 0.23 | 0.65 | A |
| 2 | 48703 | 9:56:35.8 | -09:53:30.0 | 0.759 | 0.808 | 0.386 | 0.23 | 0.22 | A | ||||
| 3 | 09:56:35.8 | -10:10:12.8 | 0.00132 | 5.17 | 12953 | 9:56:35.7 | -10:10:10.6 | - | 0.940 | 0.842 | 5.16 | 0.92 | Z(a) |
| 4 | 09:56:31.2 | -09:53:28.9 | 0.00102 | 2.44 | 0.22 | 0.95 | |||||||
| 5 | 09:56:28.0 | -10:01:08.3 | 0.00155 | 0.75 | 32205 | 9:56:28.6 | -10:01:07.8 | x | 0.764 | 0.605 | Star | ||
| 5 | 32229 | 9:56:28.0 | -10:01:03.5 | 1.301 | 0.526 | 0.207 | QSO | ||||||
| 6 | 09:56:20.4 | -10:05:22.8 | 0.00113 | 1.21 | 23122 | 9:56:20.3 | -10:05:24.4 | 0.616 | 0.880 | 0.736 | |||
| 7 | 09:56:15.3 | -09:53:19.0 | 0.00135 | 0.58 | |||||||||
| 8 | 09:56:12.1 | -09:50:44.0 | 0.00112 | 5.06 | 54851 | 9:56:11.9 | -09:50:47.2 | 1.353 | 0.904 | 0.904 | 1.00 | 0.91 | QSO |
| 9 | 09:56:08.7 | -10:08:03.0 | 0.00093 | 0.82 | |||||||||
| 10 | 09:57:01.8 | -09:55:27.5 | 0.00241 | 0.85 | |||||||||
| 11 | 09:56:41.0 | -09:52:49.8 | 0.00123 | 0.77 | 51604 | 9:56:40.4 | -09:52:49.8 | 0.164 | 0.849 | 0.681 | 0.12 | 0.08 | B Spec |
| 11 | 50205 | 9:56:41.2 | -09:52:51.9 | 1.898 | 0.622 | 0.198 | 0.19 | 0.61 | B QSO | ||||
| 12 | 09:56:10.7 | -10:16:05.7 | 0.00129 | 1.04 | |||||||||
| 13 | 09:56:01.4 | -10:00:25.6 | 0.00070 | 1.90 | |||||||||
| 14 | 09:55:32.3 | -09:58:54.8 | 0.00164 | 0.56 | 39465 | 9:55:31.9 | -09:58:59.6 | x | 0.999 | 0.999 | Star | ||
| 15 | 09:55:31.6 | -10:06:11.4 | 0.00289 | 0.73 | |||||||||
| 16 | 09:55:28.2 | -09:58:59.6 | 0.00217 | 0.63 | 36617 | 9:55:28.1 | -09:59:15.5 | x | 0.815 | 0.563 | Star | ||
| 16 | 36776 | 9:55:27.7 | -09:58:58.7 | x | 0.625 | 0.212 | Star | ||||||
| 17 | 09:56:54.1 | -10:02:49.0 | 0.00085 | 2.85 | 28744 | 9:56:54.0 | -10:02:45.9 | 0.754 | 0.941 | 0.923 | 1.19 | 0.91 | |
| 18 | 09:56:47.3 | -10:13:29.3 | 0.00087 | 1.53 | 5514 | 9:56:47.1 | -10:13:30.1 | 1.201 | 0.972 | 0.972 | 1.23 | 0.93 | QSO |
| 19 | 09:56:20.0 | -10:01:17.0 | 0.00116 | 0.40 | |||||||||
| 20 | 09:56:17.7 | -10:01:49.3 | 0.00107 | 1.55 | 31178 | 9:56:17.6 | -10:01:49.4 | 0.171 | 0.982 | 0.982 | 1.93 | 0.90 | Spec |
| 21 | 09:56:10.3 | -09:58:59.4 | 0.00080 | 2.27 | 36827 | 9:56:10.2 | -09:58:59.2 | 1.886 | 0.953 | 0.906 | 0.54 | 0.90 | QSO |
| 22 | 09:55:57.6 | -10:01:27.5 | 0.00060 | 2.18 | 31519 | 9:55:57.5 | -10:01:28.3 | 2.413 | 0.992 | 0.987 | 1.18 | 0.93 | QSO |
| 23 | 09:55:52.6 | -09:59:51.1 | 0.00060 | 6.77 | 35608 | 9:55:52.5 | -09:59:51.3 | x | 0.998 | 0.998 | Star | ||
| 24 | 09:55:44.2 | -09:59:33.0 | 0.00100 | 1.88 | 36966 | 9:55:44.3 | -09:59:33.5 | 0.175 | 0.982 | 0.934 | Spec | ||
| 25 | 09:55:41.7 | -09:59:20.9 | 0.00127 | 0.77 | |||||||||
| 26 | 09:55:39.4 | -10:13:25.9 | 0.00168 | 1.18 | |||||||||
| 27 | 09:55:34.6 | -09:56:01.6 | 0.00094 | 4.24 | 43454 | 9:55:34.6 | -09:56:4.17 | 1.655 | 0.977 | 0.962 | 0.94 | 0.90 | QSO |
| 28 | 09:56:33.6 | -09:53:55.1 | 0.00134 | 1.29 | 47810 | 9:56:33.6 | -09:53:58.4 | 2.109 | 0.881 | 0.881 | 0.42 | 0.83 | QSO |
| 29 | 09:56:01.3 | -10:06:40.0 | 0.00138 | 0.57 | |||||||||
| 30 | 09:56:00.1 | -10:09:03.5 | 0.00121 | 0.57 | |||||||||
| 31 | 09:56:00.1 | -09:55:32.8 | 0.00142 | 0.73 | |||||||||
| 32 | 09:55:50.0 | -09:59:44.8 | 0.00110 | 1.85 | |||||||||
| 33 | 09:56:55.4 | -10:02:18.0 | 0.00142 | 0.69 | |||||||||
| 34 | 09:56:48.2 | -09:58:03.0 | 0.00156 | 0.85 | 39549 | 9:56:48.1 | -09:58:1.65 | 0.166 | 0.962 | 0.962 | Spec | ||
| 35 | 09:56:05.3 | -09:51:52.6 | 0.00154 | 1.01 | |||||||||
| 36 | 09:55:53.6 | -10:14:11.0 | 0.00296 | 0.84 | |||||||||
| 37 | 09:55:38.6 | -10:10:15.9 | 0.00416 | 0.99 | 14161 | 9:55:38.4 | -10:10:19.1 | 0.171 | 0.809 | 0.759 | |||
| 38 | 09:56:27.5 | -10:08:19.5 | 0.00767 | 0.60 | |||||||||
| 39 | 09:57:07.4 | -09:56:48.4 | 0.00060 | 1.77 | 42260 | 9:57:07.2 | -09:56:44.9 | x | 0.975 | 0.975 | Star | ||
| 40 | 09:57:03.6 | -09:55:04.7 | 0.00123 | 1.88 | |||||||||
| 41 | 09:57:00.7 | -09:58:29.6 | 0.00146 | 0.90 | |||||||||
| 42 | 09:57:00.6 | -09:54:24.1 | 0.00117 | 2.17 | |||||||||
| 43 | 09:56:58.4 | -10:10:29.8 | 0.00120 | 1.22 | 12232 | 9:56:58.4 | -10:10:28.1 | 3.448 | 0.924 | 0.924 | 0.46 | 0.91 | QSO |
| 44 | 09:56:56.3 | -09:54:19.8 | 0.00123 | 1.45 | |||||||||
| 45 | 09:56:55.6 | -09:55:07.5 | 0.00096 | 1.48 | |||||||||
| 46 | 09:56:49.5 | -10:07:24.5 | 0.00195 | 1.21 | |||||||||
| 47 | 09:56:47.4 | -10:02:34.7 | 0.00123 | 1.07 | |||||||||
| 48 | 09:56:43.8 | -09:55:40.0 | 0.00105 | 1.09 | 44635 | 9:56:43.9 | -09:55:39.9 | 0.083 | 0.984 | 0.597 | 20.80 | 0.26 | C |
| 48 | 45154 | 9:56:43.9 | -09:55:43.2 | 0.053 | 0.976 | 0.391 | 23.36 | 0.45 | C | ||||
| 49 | 09:56:42.4 | -10:13:11.6 | 0.00100 | 1.47 | 6258 | 9:56:42.3 | -10:13:11.2 | 0.337 | 0.951 | 0.913 | 0.85 | 0.91 | |
| 50 | 09:56:41.9 | -10:08:50.5 | 0.00108 | 0.90 | 15780 | 9:56:42.0 | -10:08:48.9 | 1.327 | 0.851 | 0.761 | 0.14 | 0.78 | QSO |
| 51 | 09:56:42.2 | -10:05:58.6 | 0.00138 | 0.56 | 21892 | 9:56:42.1 | -10:05:56.0 | 2.267 | 0.765 | 0.751 | 0.38 | 0.83 | |
| 52 | 09:56:40.8 | -09:59:16.4 | 0.00092 | 0.44 | 36062 | 9:56:40.9 | -09:59:16.0 | 0.728 | 0.762 | 0.541 | |||
| 52 | 36147 | 9:56:40.7 | -09:59:14.2 | x | 0.631 | 0.289 | |||||||
| 53 | 09:56:40.6 | -10:11:49.7 | 0.00124 | 1.54 | 9081 | 9:56:40.6 | -10:11:49.1 | 1.290 | 0.938 | 0.639 | 0.68 | 0.65 | QSO |
| 53 | 9524 | 9:56:40.2 | -10:11:52.0 | 0.176 | 0.883 | 0.318 | 0.57 | 0.23 | |||||
| 54 | 09:56:40.6 | -10:00:30.4 | 0.00089 | 0.75 | |||||||||
| 55 | 09:56:40.0 | -10:09:30.1 | 0.00100 | 1.45 | 14419 | 9:56:39.8 | -10:09:30.1 | 0.292 | 0.939 | 0.915 | |||
| 56 | 09:56:39.6 | -10:09:00.3 | 0.00126 | 0.72 | |||||||||
| 57 | 09:56:39.7 | -09:57:18.3 | 0.00086 | 1.12 | 46236 | 9:56:39.6 | -09:57:17.5 | x | 1.000 | 1.000 | 0.59 | 0.99 | |
| 58 | 09:56:37.3 | -10:03:16.2 | 0.00070 | 2.05 | 27507 | 9:56:37.3 | -10:03:17.1 | 1.458 | 0.981 | 0.973 | 0.48 | 0.91 | QSO |
| 59 | 09:56:37.0 | -09:52:37.2 | 0.00079 | 3.36 | 50887 | 9:56:37.0 | -09:52:37.6 | 0.376 | 0.975 | 0.937 | 0.55 | 0.91 | |
| 60 | 09:56:36.1 | -10:01:49.9 | 0.00074 | 1.31 | 30570 | 9:56:36.1 | -10:01:51.3 | 0.948 | 0.925 | 0.753 | 0.76 | 0.88 | |
| 61 | 09:56:35.6 | -10:00:04.3 | 0.00097 | 0.34 | 34255 | 9:56:35.9 | -10:00:05.9 | 1.667 | 0.763 | 0.386 | QSO | ||
| 61 | 34746 | 9:56:36.0 | -09:59:57.8 | x | 0.631 | 0.204 | 0.11 | 0.74 | Star | ||||
| 61 | 34238 | 9:56:35.3 | -10:00:09.0 | 0.426 | 0.631 | 0.204 | |||||||
| 62 | 09:56:35.3 | -10:04:55.2 | 0.00060 | 55.10 | 24409 | 9:56:35.3 | -10:04:54.6 | x | 0.993 | 0.993 | QSO | ||
| 63 | 09:56:34.5 | -09:59:30.1 | 0.00098 | 1.10 | 35643 | 9:56:34.5 | -09:59:30.1 | 0.965 | 0.952 | 0.952 | QSO | ||
| 64 | 09:56:30.6 | -10:00:16.4 | 0.00060 | 38.90 | 36653 | 9:56:30.6 | -10:00:15.5 | 0.000 | 1.000 | 1.000 | 0.66 | 1.00 | Star |
| 65 | 09:56:29.9 | -09:52:37.4 | 0.00167 | 0.31 | |||||||||
| 66 | 09:56:29.7 | -10:02:01.3 | 0.00067 | 1.87 | 637771 | 9:56:29.6 | -10:01:59.7 | x | 0.952 | 0.952 | 0.82 | 0.99 | |
| 67 | 09:56:29.1 | -10:10:05.2 | 0.00093 | 1.13 | |||||||||
| 68 | 09:56:29.1 | -09:51:33.0 | 0.00130 | 0.94 | |||||||||
| 69 | 09:56:26.7 | -10:05:10.0 | 0.00060 | 3.74 | 23665 | 9:56:26.8 | -10:05:09.5 | 0.601 | 0.990 | 0.497 | QSO | ||
| 69 | 09:56:26.7 | -10:05:10.0 | 0.00060 | 3.74 | 24046 | 9:56:27.1 | -10:05:10.2 | x | 0.990 | 0.497 | Star | ||
| 70 | 09:56:26.5 | -10:03:24.6 | 0.00119 | 0.69 | 27308 | 9:56:26.5 | -10:03:22.1 | 0.924 | 0.814 | 0.500 | |||
| 70 | 09:56:26.5 | -10:03:24.6 | 0.00119 | 0.69 | 27176 | 9:56:27.0 | -10:03:26.4 | 0.179 | 0.627 | 0.192 | |||
| 70 | 09:56:26.5 | -10:03:24.6 | 0.00119 | 0.69 | 27071 | 9:56:26.7 | -10:03:26.2 | 0.903 | 0.628 | 0.192 | |||
| 71 | 09:56:26.4 | -10:10:57.9 | 0.00166 | 0.68 | 11827 | 9:56:26.1 | -10:10:58.5 | 0.175 | 0.938 | 0.938 | 2.88 | 0.76 | D |
| 72 | 09:56:26.5 | -09:55:55.3 | 0.00110 | 1.34 | 46335 | 9:56:26.5 | -09:55:46.4 | x | 0.998 | 0.980 | Star | ||
| 73 | 09:56:22.6 | -09:56:00.6 | 0.00066 | 1.60 | 43383 | 9:56:22.5 | -09:56:00.0 | 1.253 | 0.814 | 0.814 | 0.11 | 0.72 | |
| 74 | 09:56:21.7 | -10:03:06.8 | 0.00065 | 0.96 | 27810 | 9:56:21.7 | -10:03:06.1 | 2.000 | 0.952 | 0.952 | 0.20 | 0.84 | QSO |
| 75 | 09:56:21.2 | -09:56:36.1 | 0.00093 | 1.14 | 42064 | 9:56:21.3 | -09:56:37.7 | 3.493 | 0.927 | 0.927 | 0.09 | 0.82 | QSO |
| 76 | 09:56:20.1 | -10:03:50.3 | 0.00061 | 1.84 | 26320 | 9:56:20.1 | -10:03:48.6 | 0.986 | 0.883 | 0.883 | 0.09 | 0.74 | |
| 77 | 09:56:20.0 | -10:00:48.5 | 0.00090 | 0.54 | 32961 | 9:56:19.9 | -10:00:46.4 | 0.908 | 0.760 | 0.652 | 0.22 | 0.81 | E |
| 78 | 09:56:19.7 | -10:03:27.1 | 0.00063 | 0.85 | 27050 | 9:56:19.8 | -10:03:27.1 | 0.974 | 0.814 | 0.814 | 0.09 | 0.66 | |
| 79 | 09:56:18.8 | -09:55:57.9 | 0.00139 | 1.06 | 44351 | 9:56:18.8 | -09:55:57.8 | 0.162 | 0.980 | 0.980 | Spec | ||
| 80 | 09:56:18.1 | -09:53:59.8 | 0.00078 | 16.40 | 47978 | 9:56:18.0 | -09:54:01.2 | 1.133 | 0.992 | 0.992 | 4.65 | 0.94 | QSO |
| 81 | 09:56:17.7 | -10:07:20.2 | 0.00126 | 0.42 | 19305 | 9:56:17.7 | -10:07:18.7 | 0.175 | 0.970 | 0.960 | 0.46 | 0.92 | Spec |
| 82 | 09:56:15.9 | -10:02:19.2 | 0.00060 | 0.21 | |||||||||
| 83 | 09:56:15.5 | -09:50:31.3 | 0.00150 | 0.66 | |||||||||
| 84 | 09:56:15.0 | -09:58:20.6 | 0.00060 | 4.38 | 38125 | 9:56:15.0 | -09:58:21.3 | 0.902 | 0.851 | 0.851 | 0.84 | 0.72 | |
| 85 | 09:56:13.1 | -09:59:03.8 | 0.00114 | 0.44 | 36939 | 9:56:13.1 | -09:59:04.9 | x | 0.987 | 0.987 | Star | ||
| 86 | 09:56:13.0 | -10:04:07.3 | 0.00060 | 2.00 | 25718 | 9:56:13.0 | -10:04:06.9 | 2.267 | 0.969 | 0.969 | 0.10 | 0.87 | QSO |
| 87 | 09:56:11.8 | -09:59:55.9 | 0.00100 | 0.65 | 0.12 | 0.92 | |||||||
| 88 | 09:56:10.6 | -09:49:12.0 | 0.00101 | 2.44 | 58384 | 9:56:10.5 | -09:49:13.2 | 1.899 | 0.951 | 0.835 | 1.31 | 0.92 | QSO |
| 89 | 09:56:10.0 | -10:07:11.3 | 0.00086 | 0.72 | 19716 | 9:56:10.1 | -10:07:10.8 | 0.260 | 0.975 | 0.975 | 0.25 | 0.90 | |
| 90 | 09:56:05.5 | -10:00:30.0 | 0.00068 | 1.11 | 33381 | 9:56:05.4 | -10:00:30.5 | 0.961 | 0.764 | 0.508 | 1.11 | 0.71 | F |
| 91 | 09:56:03.3 | -10:07:41.1 | 0.00087 | 2.25 | 18874 | 9:56:03.3 | -10:07:42.4 | 0.255 | 0.987 | 0.983 | 6.53 | 0.93 | |
| 92 | 09:56:00.9 | -09:56:18.7 | 0.00251 | 2.31 | |||||||||
| 93 | 09:55:58.2 | -10:07:27.4 | 0.00101 | 1.40 | 18722 | 9:55:58.3 | -10:07:27.3 | 1.304 | 0.939 | 0.882 | 0.67 | 0.80 | QSO |
| 94 | 09:55:57.9 | -10:06:52.7 | 0.00121 | 1.40 | 19933 | 9:55:57.9 | -10:06:54.1 | 0.838 | 0.950 | 0.863 | 0.46 | 0.91 | |
| 95 | 09:55:55.7 | -10:08:30.7 | 0.00115 | 0.65 | 16610 | 9:55:55.7 | -10:08:31.9 | 0.516 | 0.906 | 0.782 | 1.46 | 0.90 | |
| 96 | 09:55:54.6 | -10:06:46.5 | 0.00134 | 0.49 | |||||||||
| 97 | 09:55:53.7 | -10:08:47.9 | 0.00162 | 0.39 | |||||||||
| 98 | 09:55:52.9 | -10:05:43.7 | 0.00110 | 0.82 | 22404 | 9:55:52.9 | -10:05:43.9 | 0.445 | 0.938 | 0.938 | 0.43 | 0.91 | |
| 99 | 09:55:52.6 | -10:06:44.6 | 0.00121 | 0.43 | |||||||||
| 100 | 09:55:52.5 | -10:04:28.7 | 0.00074 | 1.88 | 24884 | 9:55:52.5 | -10:04:28.8 | 0.416 | 0.942 | 0.942 | 0.38 | 0.88 | |
| 101 | 09:55:51.2 | -10:03:56.7 | 0.00133 | 1.04 | |||||||||
| 102 | 09:55:50.5 | -09:52:06.2 | 0.00137 | 2.12 | 52252 | 9:55:50.4 | -09:52:07.3 | 0.240 | 0.923 | 0.693 | |||
| 102 | 53126 | 9:55:50.6 | -09:51:53.1 | x | 0.813 | 0.249 | Star | ||||||
| 103 | 09:55:43.9 | -09:57:05.3 | 0.00148 | 0.74 | 0.26 | 0.94 | |||||||
| 104 | 09:55:43.6 | -10:09:09.5 | 0.00113 | 2.03 | 15698 | 9:55:43.7 | -10:09:11.8 | 0.179 | 0.961 | 0.387 | 0.73 | 0.92 | G Spec |
| 105 | 09:55:43.6 | -10:08:28.1 | 0.00117 | 0.62 | 17675 | 9:55:43.4 | -10:08:26.5 | 0.170 | 0.970 | 0.844 | 0.30 | 0.81 | Spec |
| 106 | 09:55:38.1 | -10:08:25.3 | 0.00112 | 1.44 | 16625 | 9:55:38.2 | -10:08:24.6 | 0.562 | 0.812 | 0.812 | 0.15 | 0.79 | |
| 107 | 09:55:36.9 | -09:57:15.8 | 0.00114 | 2.17 | 40605 | 9:55:36.8 | -09:57:17.1 | 0.975 | 0.924 | 0.809 | 0.65 | 0.91 | QSO |
| 108 | 09:55:35.8 | -10:09:15.8 | 0.00075 | 2.56 | 14758 | 9:55:35.9 | -10:09:15.7 | 1.693 | 0.942 | 0.938 | 0.13 | 0.85 | QSO |
| 109 | 09:55:35.1 | -10:01:52.7 | 0.00102 | 0.59 | 30592 | 9:55:35.0 | -10:01:51.5 | 0.814 | 0.811 | 0.286 | 0.33 | 0.74 | H |
| 109 | 31111 | 9:55:34.7 | -10:01:52.7 | 0.249 | 0.882 | 0.493 | H | ||||||
| 110 | 09:55:32.3 | -10:01:44.9 | 0.00126 | 0.96 | 30855 | 9:55:32.6 | -10:01:49.0 | x | 0.961 | 0.845 | Star | ||
| 111 | 09:55:31.1 | -10:05:22.5 | 0.00163 | 0.60 | 28232 | 9:55:30.9 | -10:05:18.9 | x | 1.000 | 1.000 | 0.41 | 0.87 | |
| 112 | 09:55:28.5 | -10:05:30.8 | 0.00060 | 7.21 | 22807 | 9:55:28.6 | -10:05:32.2 | 0.257 | 0.981 | 0.981 | 0.91 | 0.92 | |
| 113 | 09:57:18.5 | -09:59:51.5 | 0.00109 | 0.98 | |||||||||
| 114 | 09:57:11.3 | -09:57:05.5 | 0.00140 | 1.17 | |||||||||
| 115 | 09:56:57.1 | -10:05:43.7 | 0.00198 | 0.44 | |||||||||
| 116 | 09:56:52.4 | -10:00:30.4 | 0.00124 | 1.11 | 35364 | 9:56:52.2 | -10:00:29.7 | 0.079 | 0.984 | 0.984 | 5.45 | 0.99 | D |
| 117 | 09:56:48.1 | -09:53:36.4 | 0.00139 | 0.76 | |||||||||
| 118 | 09:56:47.1 | -10:11:04.2 | 0.00110 | 1.02 | 10744 | 9:56:47.2 | -10:11:03.8 | 0.941 | low | low | 0.34 | 0.42 | I |
| 119 | 09:56:46.7 | -10:01:37.5 | 0.00156 | 0.58 | 31772 | 9:56:46.7 | -10:01:38.6 | 0.168 | 0.969 | 0.969 | 7.36 | 0.93 | Spec |
| 120 | 09:56:44.2 | -09:50:46.6 | 0.00253 | 0.99 | |||||||||
| 121 | 09:56:42.3 | -10:12:18.4 | 0.00211 | 0.59 | 8770 | 9:56:42.2 | -10:12:19.1 | 0.324 | 0.883 | 0.482 | |||
| 121 | 7961 | 9:56:42.6 | -10:12:22.6 | x | 0.852 | 0.369 | Star | ||||||
| 122 | 09:56:24.8 | -09:51:17.1 | 0.00157 | 0.62 | |||||||||
| 123 | 09:56:23.5 | -09:51:54.8 | 0.00117 | 0.71 | |||||||||
| 124 | 09:56:22.0 | -10:01:13.7 | 0.00109 | 0.33 | 31850 | 9:56:22.0 | -10:01:14.5 | 3.373 | 0.882 | 0.882 | 0.30 | 0.87 | QSO |
| 125 | 09:56:08.1 | -10:06:12.6 | 0.00129 | 0.30 | |||||||||
| 126 | 09:56:06.2 | -10:10:30.7 | 0.00170 | 0.30 | |||||||||
| 127 | 09:56:00.9 | -10:08:24.2 | 0.00131 | 0.33 | 16637 | 9:56:00.9 | -10:08:23.3 | 1.967 | 0.706 | 0.406 | 0.10 | 0.67 | QSO |
| 127 | 17155 | 9:56:1.51 | -10:08:19.1 | 0.173 | 0.631 | 0.289 | Spec | ||||||
| 128 | 09:55:58.8 | -10:05:57.3 | 0.00124 | 0.38 | |||||||||
| 129 | 09:55:42.8 | -10:04:37.7 | 0.00128 | 0.43 | |||||||||
| 130 | 09:55:39.1 | -09:54:33.8 | 0.00155 | 0.47 | 0.15 | 0.88 | |||||||
| 131 | 09:55:31.2 | -10:04:07.4 | 0.00137 | 0.78 | |||||||||
| 132 | 09:57:10.6 | -09:56:27.3 | 0.00118 | 0.66 | 42725 | 9:57:10.4 | -09:56:24.0 | x | 0.938 | 0.938 | 1.03 | 0.91 | QSO |
| 133 | 09:56:12.0 | -10:06:13.8 | 0.00138 | 0.27 | |||||||||
| 134 | 09:56:10.4 | -10:09:44.7 | 0.00214 | 0.33 | |||||||||
| 135 | 09:56:28.2 | -09:57:19.3 | 0.00060 | 277.00 | 41435 | 9:56:28.2 | -09:57:19.0 | - | 0.995 | 0.966 | 1.15 | 0.94 | Z(b) |
| 136 | 09:56:21.8 | -10:04:34.9 | 0.00064 | 2.53 | 24683 | 9:56:21.8 | -10:04:35.7 | 1.088 | 0.968 | 0.968 | QSO | ||
| 137 | 09:56:18.8 | -10:07:45.6 | 0.00101 | 1.95 | 18034 | 9:56:18.7 | -10:07:47.0 | 0.834 | 0.850 | 0.840 | 1.69 | 0.86 | |
| 138 | 09:56:21.8 | -10:06:48.2 | 0.00091 | 0.42 | 20029 | 9:56:21.8 | -10:06:47.4 | 0.719 | 0.880 | 0.880 | 0.15 | 0.82 | QSO |
| 139 | 09:56:50.2 | -10:11:51.8 | 0.00215 | 1.15 | 9020 | 9:56:50.0 | -10:11:55.8 | 0.171 | 0.851 | 0.851 | 3.58 | 0.92 | Spec |
| Notes: | |||||||||||||
| All co-ordinates are in J2000. | |||||||||||||
| Error on X-ray position in degrees, as described in Section 3.3. | |||||||||||||
| Counts per second in units of in the 0.5 - 7.5 keV band, given by the average of the wavdetect count rates from the three images. The count rates from the PN detector were scaled down by a factor of 3 (calculated from the brightest sources) to match those from the MOS detectors. | |||||||||||||
| Reliability; the probability that the X-ray – optical association is not random. | |||||||||||||
| Probability; the chance that this X-ray – optical association gives the true counterpart, given all possible associations and the chance of no counterpart existing. In the case of sources with more than one reliable match this is much lower than the individual reliabilities. | |||||||||||||
| 24m flux in mJy, from Spitzer data. | |||||||||||||
| Probability from 24m data, given by the combined probability of the X-ray - 24m match being unique, and the 24m – optical match. If no optical match is found then this is purely the X-ray – 24m probability. | |||||||||||||
| x – The source is too faint to have a reasonable COMBO redshift, or is a star. | |||||||||||||
| 1 – This source was found by eye and added to the COMBO catalogue, with a R-band magnitude of 23.7. | |||||||||||||
| A – The X-ray source matches well with one 24m source. Both the X-ray to optical and 24m to optical matches indicate that the first optical source is most likely to be the true counterpart. | |||||||||||||
| B – The 24m matches are low probability, but are included here as one of the possible counterparts is a supercluster galaxy. | |||||||||||||
| C –The two optical and two 24m detections are both components of a local merging system. | |||||||||||||
| D – The 24m catalogue includes multiple detections of the same object. The combined flux is given. | |||||||||||||
| E – The X-ray – optical match has low probability, but it becomes more likely once the 24m data is added. | |||||||||||||
| F – The 24m data reduces 2 optical possibilities to one. The 24m–X-ray match is excellent (0.99) but the match with the optical source is lower significance as the source is very faint. | |||||||||||||
| G – 24m data reduces two equally likely X-ray – optical matches to one secure match. The rejected match is a very bright star, which is actually away. | |||||||||||||
| H – The 24m source is well matched to the optical counterpart, and is likely to be the source of the X-rays. | |||||||||||||
| I – The X-ray – optical match gives a number of possible counterparts. All are rejected, as the 24m source is an excellent match with the X-ray (0.98) and is not associated with any of these sources. The most likely match is a very faint source, which is listed. | |||||||||||||
| QSO – The optical source is a QSO, and therefore has a higher likelihood of being the true counterpart than indicated by the probabilities. | |||||||||||||
| Star – The optical source is a star, and as stars are often bright (and rare, giving a high probability) but not often X-ray loud the source may be a chance association. | |||||||||||||
| Spec – This source has a 2dF spectrum | |||||||||||||
| Z – Dubious redshift, see Section 4.4; Z(a) – COMBO-17 redshift is 1.4 but it may be 0.16. Z(b) – COMBO-17 redshift is 0.33, but 0.16 is found spectroscopically. | |||||||||||||