Embedded Star Formation in the Eagle Nebula with Spitzer/GLIMPSE
Abstract
We present new Spitzer photometry of the Eagle Nebula (M16, containing the optical cluster NGC 6611) combined with near-infrared photometry from 2MASS. We use dust radiative transfer models, mid-infrared and near-infrared color-color analysis, and mid-infrared spectral indices to analyze point source spectral energy distributions, select candidate young stellar objects (YSOs), and constrain their mass and evolutionary state. Comparison of the different protostellar selection methods shows that mid-infrared methods are consistent, but as has been known for some time, near-infrared-only analysis misses some young objects. We reveal more than 400 protostellar candidates, including one massive young stellar object (YSO) that has not been previously highlighted. The YSO distribution supports a picture of distributed low-level star formation, with no strong evidence of triggered star formation in the “pillars”. We confirm the youth of NGC 6611 by a large fraction of infrared-excess sources, and reveal a younger cluster of YSOs in the nearby molecular cloud. Analysis of the YSO clustering properties shows a possible imprint of the molecular cloud’s Jeans length. Multiwavelength mid-IR imaging thus allows us to analyze the protostellar population, to measure the dust temperature and column density, and to relate these in a consistent picture of star formation in M16.
Subject headings:
infrared: stars – methods:data analysis – stars:formation1. Introduction
The fusion energy generated in stars dominates the evolution of galaxies, heating and processing their interstellar media. However, our understanding of how stars form is incomplete. Some fairly reliable empirical scaling laws exist, and a believable scenario exists for how an isolated low-mass star can form via disk accretion, but we lack a detailed understanding of how an entire molecular cloud turns into a cluster of stars. Most stars form in cluster environments, and stellar densities imply some interaction between YSOs during their formation. We must therefore analyze entire star forming regions, at long enough wavelengths to not be limited by extinction, and determine the physical properties of whole populations of young stellar objects (YSOs). Trends in evolutionary state, mass, and spatial distribution can help distinguish between star formation scenarios such as competitive accretion (e.g. Bonnell et al., 2004) and predestination (in which cores determine stellar masses, e.g. McKee & Tan, 2003).
One particularly vexing aspect of the complex and important topic of star formation is that of triggering. The formation of massive stars feeds energy back into the nearby interstellar medium, compressing, irradiating, and heating the natal molecular cloud. This feedback can have destructive or constructive effects, but it is not clear which dominates in a given cloud or overall in a galaxy. Although many examples exist of regions in our Galaxy and other galaxies with suggestive spatial distributions of young and somewhat younger stars, determining the relevant physical conditions and timescales to make a strong argument for triggering is more difficult. For some examples of these arguments, see the discussion of the Galactic region W3/4 by Oey et al. (2005), 30 Doradus by Walborn et al. (2002), various regions and theory by Deharveng et al. (2005), the particular case of cloud-crushing described by Lefloch et al. (1997), and further theoretical considerations in Elmegreen et al. (2002). This issue must be clarified by making detailed assessment of whether triggered star formation is happening in particular molecular clouds.
The Eagle Nebula (M16, containing the optical cluster NGC 6611) contains a well-studied region of possible triggered star formation, in the widely publicized “pillars of creation” or “elephant trunks” imaged with HST by Hester et al. (1996, hereafter H96). NGC 6611 is a young open cluster, likely still in its formation stages. Hillenbrand et al. (1993) and de Winter et al. (1997) found a spread in ages of the optically visible cluster members: The massive (MM☉) stellar population is 21 Myr old, with the most massive members apparently having begun to evolve off of the ZAMS, and evidence of at least one evolved (6 Myr old) 30M☉ star (Hillenbrand et al., 1993). There are also optically visible (no longer embedded) intermediate mass stars (3–8M☉) that are still evolving onto the ZAMS. The famous pillars are dense knots of molecular gas (Pound, 1998) and dust which shield the region behind them from the destructive radiation of the O stars in the central cluster. H96 identified “Evaporating Gaseous Globules” (EGGs) in and around the pillars, and a central question has been whether the EGGs are being compressed and forming stars fast enough before they are photo-destroyed. Detailed near-infrared (NIR) searches find that about 15% of the EGGs have evidence of YSOs (McCaughrean & Andersen, 2002; Thompson et al., 2002; Sugitani et al., 2002). Millimeter continuum and molecular lines (Andersen et al., 2004; White et al., 1999; Pound, 1998) reveal only one or two possibly younger objects in the pillars and at their base.
Mid IR imaging offers new insight into this region in at least two major ways. First, not all objects with protostellar dust show near-infrared (JHK) excess (e.g. only half of YSOs with 10m excess in Taurus-Auriga have NIR excess; Kenyon & Hartmann, 1995), and modeling protostellar spectral energy distributions (SEDs) is much more reliable with longer wavelength data (e.g. Whitney et al., 2004b; Allen et al., 2004). Second, the unprecedented mapping speed of Spitzer allows imaging of a much larger area than the previous NICMOS (Thompson et al., 2002) and ground-based (Sugitani et al., 2002; McCaughrean & Andersen, 2002) studies centered on the pillars, permitting an investigation of the protostellar population in the entire region. This comprehensive assessment reveals star formation throughout the region, with the least evolved objects most highly clustered together. We also use mid-IR data to map the dust temperature and average extinction; the YSOs are preferentially located in regions of elevated dust temperature, and aside from NGC6611 which has cleared its natal molecular material, also preferentially located in regions of high extinction.
In section 2 we describe the observations and compare several methods of selecting candidate YSOs. We will use the term YSO for any evolutionary state – heavily embedded, envelope dominated, disk dominated, or remnant disk (commonly called Class 0,I,II, and III for solar-mass objects). Sections 3 and 4 respectively describe the nature of the population and of individual YSOs in the region. The conclusions are summarized in §5.
2. Observations and Analysis
M16 was observed as part of the Galactic Legacy Infrared Mid-Plane Survey Extraordinaire (GLIMPSE), a Spitzer Legacy program (Benjamin et al., 2003). The region was imaged with IRAC (Fazio et al., 2004) at 3.6, 4.5, 5.8 and 8.0m with two 1.2s exposures at each location. The point source sensitivities are approximately 0.5, 0.5, 1.0, and 4.0 mJy in the four filters, somewhat brighter in regions of intense diffuse emission. Sources were extracted from the images using the GLIMPSE pipeline, built around a modified version of the PSF-fitting program DAOPHOT (Stetson, 1987, Babler et al in preparation). Source detection and extraction is done in an iterative fashion. Initial sources were detected at a 3-sigma level above the local background. These sources were subtracted from the image and then a second round of detection was run at a 5-sigma level to reveal sources that may have been missed in the wings of the PSF of bright sources. After the second round of sources were extracted a third iteration of photometry was done to improve the fluxes. In regions of complex diffuse background, the source extractor can sometimes over-estimate or under-estimate the point source flux (due to the difficulty of determining the local background). To remedy this situation, aperture photometry was done at the positions of extracted sources on the residual images (the source subtracted images) to check for excessive over- or under-subtraction of the source. If the initial extraction was indeed over- or-under subtracted, then the aperture photometry was used to adjust the initial extraction value. The pipeline has been rigorously tested against other extraction software and using a network of calibrator stars with flux densities predicted by spectral type and multiwavelength photometry (M. Cohen, private communication). Our simulations indicate that the flux densities of truly pointlike sources are in general accurate to 10% even in regions of high diffuse background. Zero point flux densities (Vega magnitude system) used in the GLIMPSE v1.0 processing and this work are 280.9,179.7,115.0, and 64.13Jy for the IRAC bands, and we used a zero point magnitude of 7.16Jy for our MIPS 24m photometry (The IRAC calibration of Reach et al., 2005, is slightly different, and users of version 2 or higher GLIMPSE products should refer to the accompanying documentation). Sources detected at several wavelengths are cross-correlated (bandmerged) using the SSC banderger software, which is based on the 2MASS bandmerger. Potential matches are considered within 4”, and in confused regions, the association between all bands which minimizes the positional chi-squared is chosen.
For this study, some of the sources of particular interest (e.g. in the tips of the pillars) were re-photometered by hand for this study, using irregular apertures and careful sky selection in regions of irregular diffuse emission. The results of the manual photometry were for the most part consistent with the pipeline extractions, but in a few cases of slightly extended sources, the manual fluxes were substituted. It should be noted that photometry is extremely difficult in very crowded regions with structured diffuse emission such as M16, and although the GLIMPSE pipeline performs as well or better than any other extractor we know of for IRAC data, one still needs to be very careful about cross-correlating sources between filters and resolving close pairs of sources at one wavelength but not another. As we discuss below, examination of each source’s spectral energy distribution, and comparing it to model SEDs, is actually a very good way to weed out bad matches and questionably photometry. Sources were bandmerged with the 2MASS all-sky catalog (Skrutskie et al., 2006) using the GLIMPSE pipeline.
The GLIMPSE pipeline extracted over 42000 sources in the region (within 0.45 degree of =17.0, =0.8, near NGC 6611), and we wish to classify all of them in a consistent manner, as potential YSOs, or reddened main sequence or post-main-sequence stars. We considered and compared four methods: 1) NIR-excess sources in a JHK color-color plot 2) sources with a 2–24m spectral index greater than -2.0 3) sources in the IRAC color ranges of Allen et al. (2004) 4) sources better fit by a protostellar than stellar model SED.
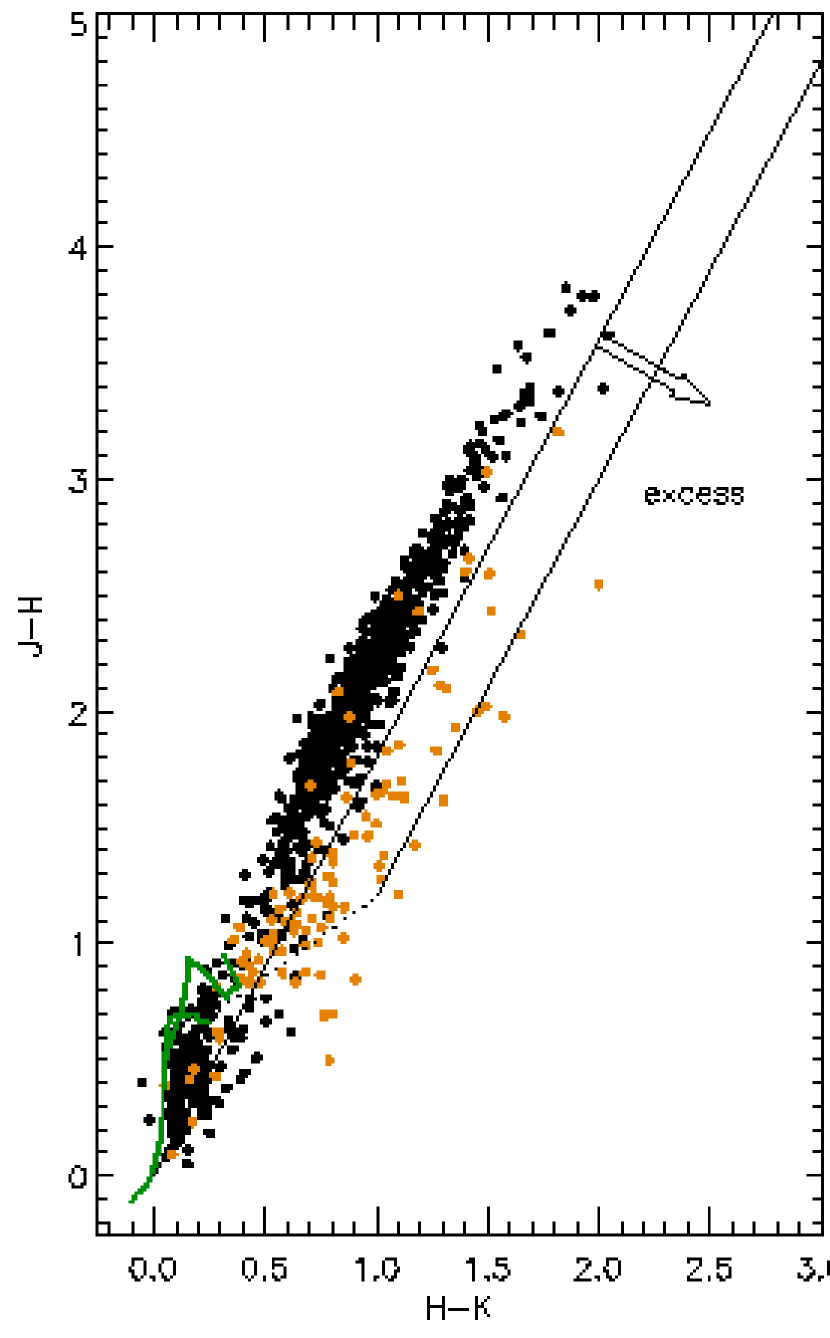
Figure 1 shows a NIR color-color diagram dissected into three regions in the usual manner. The two dividing lines are parallel to the reddening vector. We use E(J-H)/E(H-K)=1.75, as in Indebetouw et al. (2005) and Rieke & Lebofsky (1985), although a range between 1.6 and 2.0 has been observed in different molecular clouds and the diffuse ISM (Cardelli et al., 1989; Fitzpatrick, 1999). The line originating at (0,0) separates reddened main-sequence and giant stars from T-Tauri candidates. The other line separates T-Tauri candidates from less evolved YSO candidates (a dotted line marks the classical T-Tauri locus, or experimentally determined color locus of unredenned T-Tauri stars – disk-dominated YSOs are expected to lie near this line or along a redenning vector originating on the line Kenyon & Hartmann, 1995; Meyer et al., 1997). We define the “NIR excess” as the distance down and to the right of the first line (reddened MS and giant stars have excess 0, YSO candidates have excess 0.3):
| excess | (1) | ||||
| (2) |
Most other classification schemes for young stellar objects use mid-infrared colors, or the mid-infrared spectral index. Classically, the 2-24m spectral index (power-law exponent fitting F) has been used to classify YSOs, and to define the “Class I-II-III” system (Lada, 1987). In the Spitzer era, many star formation regions have been mapped with arcsecond spatial resolution using the 3.6–8.0m IRAC camera (Fazio et al., 2004), so it is useful to consider methods of selecting YSOs based in IRAC photometry alone. However, Whitney et al. (2003a,b,2004b) showed that the narrower wavelength range (3.6–8.0m v. 2–24m ) is more susceptible to 2-D effects (inclination), and stellar temperature. The 8.0m band is also affected by the broad 10m silicate feature that could be either in emission or absorption. More recently, we have computed a large grid of YSO models and found that while the 3.6–8.0m spectral index does correlate roughly with evolutionary state (measured by circumstellar dust mass and accretion rate), there is significant spread (Robitaille et al., 2006, Figure 11).
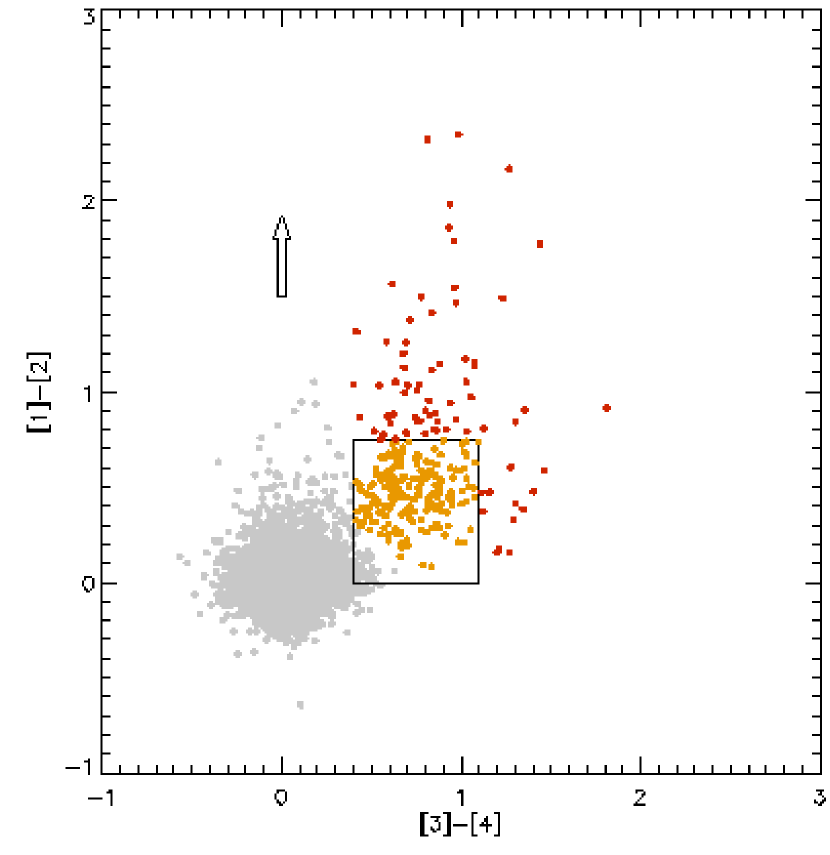
Classification based on IRAC colors uses more information about the SED than a simple spectral index over the same wavelength range, and may be more robust. Figure 2 shows the regions defined by Allen et al. (2004, hereafter A04) (see also Megeath et al., 2004) in IRAC color space. Based on the solar-mass protostellar models of Calvet et al. (1994), those authors suggest that the sources in the central box are likely to be Class II YSOs, and redder sources Class I or younger. Our models do not show as neat a separation in color-color space as A04 due to the larger range of parameter space explored in our grid (Robitaille et al., 2006). The deeply embedded sources show color variations due to inclination effects from scattering in the bipolar cavities, and sources of all evolutionary stages show color variations due to inner hole size and stellar temperature (Whitney et al., 2004b). In Figure 2, we compare A04 IRAC color-selected protostellar candidates with the spectral index and the NIR excess (for sources with J,H, and Ks detections). The IRAC-color classification is very consistent with having large 2-24m spectral index, and somewhat consistent with having a NIR excess, although the latter is not expected for all young sources.
In this study we use a different type of classification of YSO candidates – model SED fitting (Robitaille et al., 2007). This is accomplished using a program that fits all available fluxes to a large grid of model SEDs (Robitaille et al., 2007, here we use fluxes between 1.25 and 24m, but any between the UV and millimeter are usable). Our model grid consists of 2106 spectral energy distributions emitted by 2105 young stellar objects (YSOs; 10 inclination angles each). The model grid is designed to span both theoretically and observationally reasonable ranges of mass, temperature, evolutionary state, disk mass, disk accretion rate, envelope mass, and envelope accretion rate. The colors of the model grid also span the full range of observed colors of stellar and young stellar objects. In addition to the 200000 YSO models, our grid also includes 7853 stellar model atmospheres (Brott & Hauschildt, 2005) and 75 AGB star templates derived from ISO spectroscopy and spanning the range of evolutionary state and mass loss rate. The fitter returns a best-fit for each source as well as the distribution of templates and models that fit with smaller than a user-selected value of . We first select all sources that can be fit well ( per datapoint, or ) by an extinguished stellar atmosphere, and consider these consistent with stars. Of the remaining sources, if one can be fit with by any YSO models, then we consider it a candidate YSO. If it cannot be fit well by either YSO or stellar atmosphere, then it is likely poor photometry or bandmerging. This was confirmed by manual examination of the SEDs, and the process is robust to changes of the threshold goodness-of-fit between 2.04.0 (the number of sources in each category only changes by a few percent). For this analysis we consider YSO models with distances between 1.5 and 2.5 kpc – as discussed in Robitaille et al. (2007), if the distance to the sources can be constrained, the models can be better constrained by the data.
Analyzing as much of the SED as possible has several advantages. In crowded regions with bright complex diffuse emission such as M16, examination of the SED provides an extra check to remove bad data points. For example, we found several sources that were resolved from a close companion at H band and by IRAC, but not in the 2MASS Ks data, resulting in anomalously high Ks fluxes (which would be interpreted as a NIR excess). SED analysis is robust to instrumental artifacts and bad data in a single filter - color-color analysis requires good photometry in four filters (the four IRAC filters for example), whereas we can admit measurements with larger uncertainties in some filters, but are protected against introducing many false YSOs because if the resulting SED is inconsistent with any stellar or protostellar model, it can be eliminated from the analysis.
Perhaps most interesting is the ability to understand the constraints afforded by the data in as objective a way as possible. If the photometry of a given source is consistent with a wide range of circumstellar dust models, but inconsistent with any stellar atmospheres, the source can still be classified as a probable pre-main-sequence object, but at the same time it is known that the data do not allow the evolutionary state (disk-only or accreting envelope) to be determined. This is philosophically similar to choosing all sources with spectral index greater than some threshold, or all sources with some threshold infrared excess. In this manner, we use the model fitter to determine upper limits to the evolutionary state of sources in M16: Namely, if a source is not fit by any stellar atmosphere with 2.5, but is fit at least that well by some YSO models, the source is considered a YSO candidate. If the source is fit by models with accreting envelopes, but cannot be well-fit by any disk-only model (no accreting envelope), then we consider the source a candidate to be quite young (perhaps Class I for a solar-mass object). Finally, if the source can be fit by models with circumstellar disks more massive than 10M⋆ (where M⋆ is the central source mass in the model), but is not fit by any models with less massive disks, then we consider the source to be a candidate accretion disk source (similar to Class II for a solar-mass object).
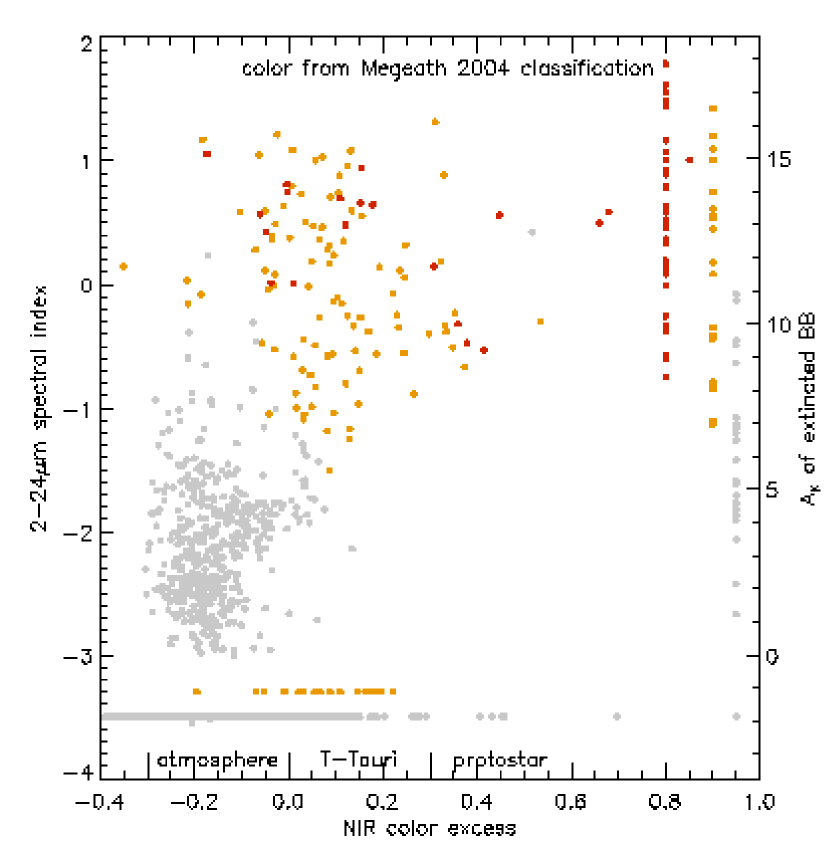
Figure 3 compares the classification suggested by our model fitter with the NIR excess (for sources which JHK detection allows calculation) and MIR spectral index. Red points have a high probability of being relatively unevolved with massive envelopes, orange points likely have still-accreting circumstellar disks, and green points are YSO candidates for which the existing data cannot place strong constraints on the circumstellar dust distribution. We see that YSO candidates generally fall in the regions defined by A04. The constraints suggested by the model fitter are less well-defined than the box drawn by A04, as expected given a range of inclination, stellar masses, and inner disk holes. One should also remember that the colors plotted are upper limits to the evolutionary state, and the source may have more massive envelopes or disks, but the existing data do not allow that to be unambiguously determined. Foreground extinction also moves sources vertically in this color space (e.g. Indebetouw et al., 2005), which explains some orange points lying above the box. Some of the orange points to the right of the box (large [5.8]-[8.0], moderate [3.6]-[4.5]) have inner holes in their dust envelopes. In the case of sources for which the data can constrain the circumstellar dust distribution, there is a correlation between less evolved objects (red points) and higher MIR spectral indices.
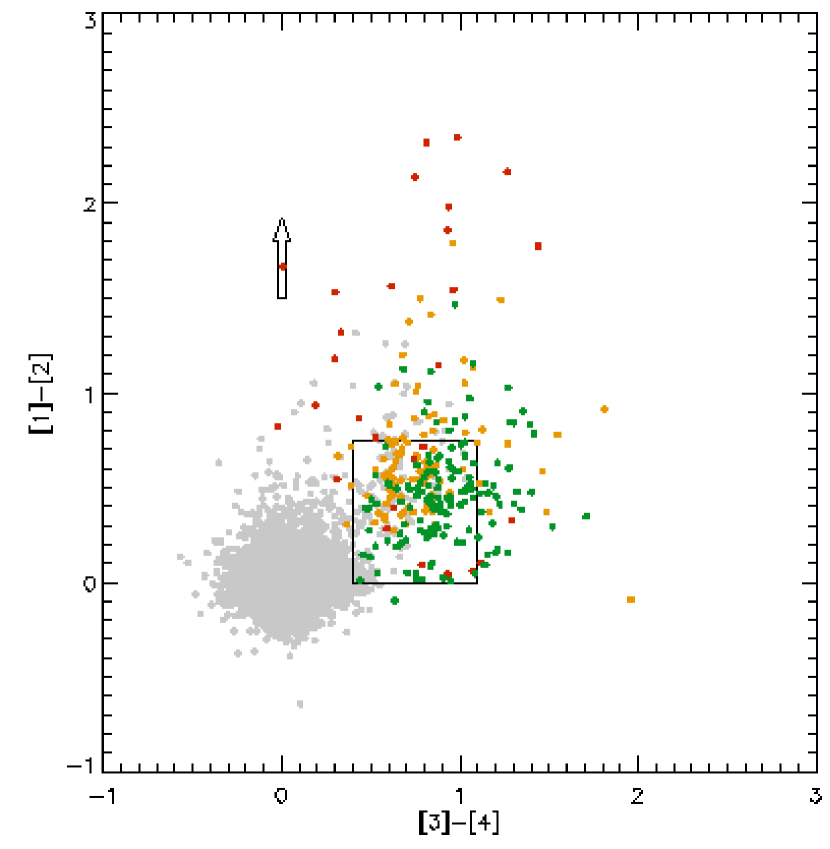
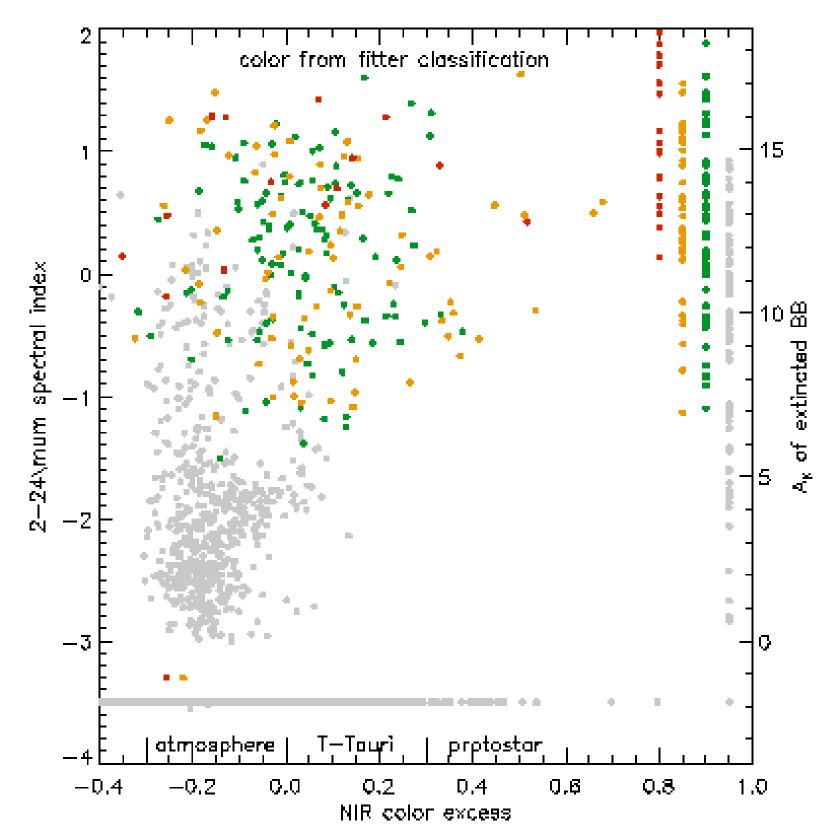
Several characteristics of the fitter classification compared to a classification based only on IRAC color are particularly important. Comparing the second panels of Figures 2 and 3, we see that the multi-band fitter finds many more young sources that did not have JHK detections (the dots on the right-hand side of Figure 3). Our fitter can characterize a source with measured fluxes in as few as four bands between J and [24], whereas a NIR excess characterization clearly requires JHK detections and an IRAC-color characterization requires detections in all four IRAC bands. The latter can be difficult in regions of high diffuse emission, like a star formation region. (A similar effect to fitting an SED to all bands can probably be achieved by classifying sources in multiple color-color planes; Megeath et al. 2005, Allen et al. 2005). Careful examination of the entire SED allows the removal of confused sources or those with poor photometry, which is less obvious in a color-color (NIR or IRAC) plot. Finally, comparison of the SED with as many different YSO models as possible provides a relatively unbiased way to assess the degree to which the data can constrain the modeled nature of the source, beyond assigning a most likely model based on colors.
3. The distribution of YSOs in the Eagle Nebula
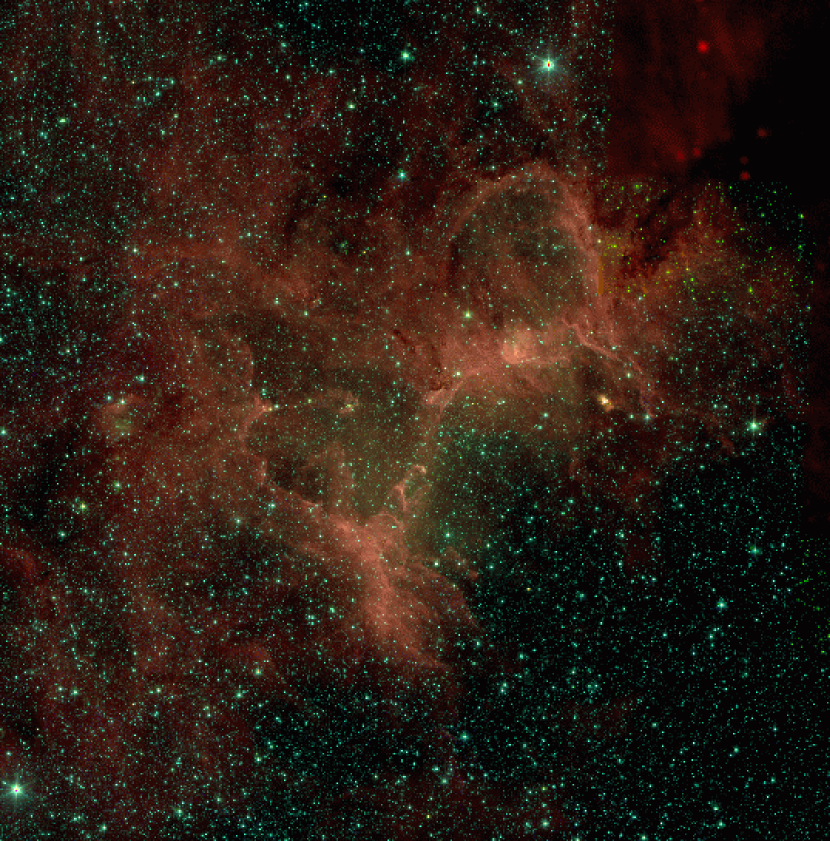
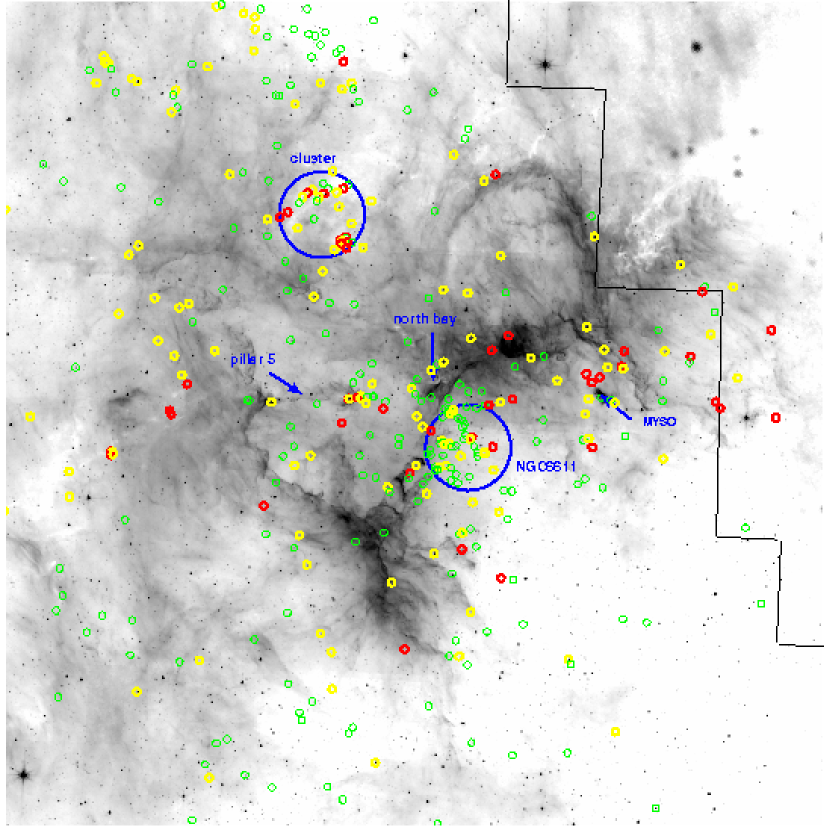
Figure 4 shows the Eagle Nebula in the [3.6], [4.5], and [8.0] bands. The optical open cluster is the concentration of blue stars to the NW of the HST pillars (marked in Fig 5). Protostellar candidates selected using our fitter are shown on a [8.0] image in Figure 5. Many of the protostellar candidates are located in the NGC 6611 cluster, which is known to be very young. In fact, nearly all of the sources in the NGC 6611 region are classified as YSO candidates: 46 of the 47 sources with high signal-to-noise detections in at least 4 bands between 1 and 10m and located in a 4′ diameter region around NGC 6611 were classified as YSO candidates. This is consistent with a very high L-band (3.5m) excess fraction (855%) determined by Oliveira et al. (2005) and the large number of emission-line stars seen by de Winter et al. (1997), implying that circumstellar disks are fairly robust, even in a cluster environment.
Our analysis reveals a new cluster to the NE (at 18h19m10s, -13d36m, approximately 7′ in diameter). Located in a dark region indicative of a dense cloud, the new cluster is likely younger than NGC 6611 – as seen in Figure 5, most of the new cluster’s sources can be constrained to have accreting disks (yellow) or envelopes (red), compared to NGC 6611 which has many sources consistent with remnant disks (green). There is also a concentration at the head of a large pillar at 18h19m05s -13d45m20s (“Pillar 5”; we analyze this region in more detail below, §4.3). Finally, there is a low density of scattered protostellar candidates across the region shown. This apparent interspersed ongoing star formation (also noted in the giant HII region RCW49 by Whitney et al. (2004a) and in Orion by Megeath et al. (2005)) could possibly be a superposition of background objects, but at least some of them are likely YSOs, indicating widespread low-level activity throughout the cloud.
3.1. Spatial Relationship of YSOs to the Molecular Cloud
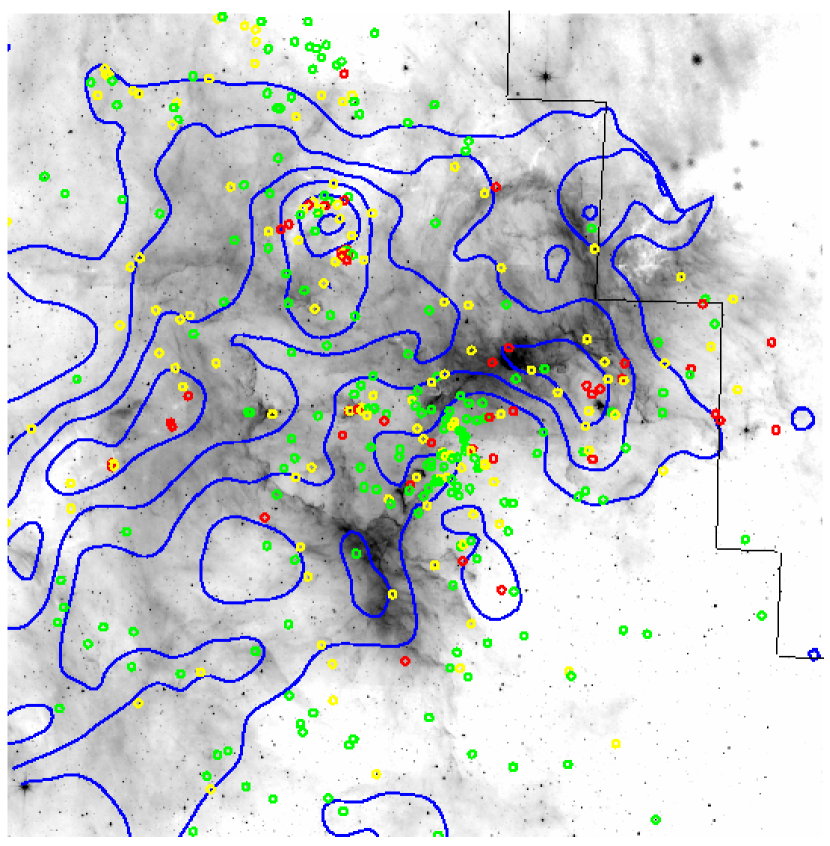
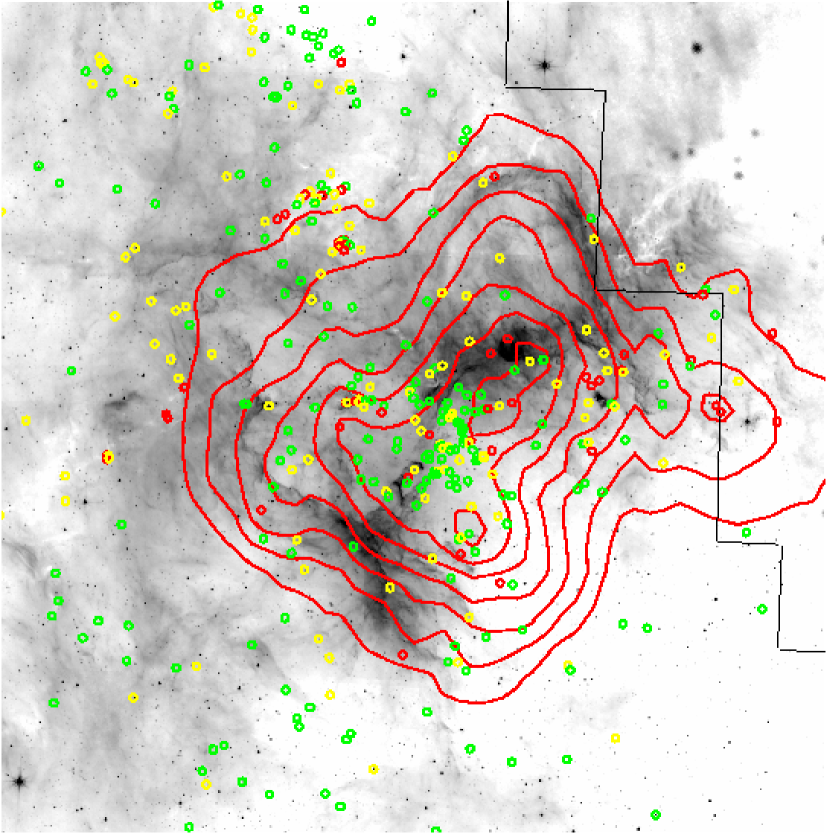
A byproduct of our fitting program is the best-fit extinction to each source, including the large number of extinguished main-sequence and giant stars along the line-of-sight. These values can be binned to produce a map of the average extinction, which is shown as contours in Figure 6. We expect that the molecular cloud associated with star formation in M16 dominates the extinction measured with this procedure, and indeed the features match other indicators of dense material. NGC 6611 is located in a low-extinction region, likely evacuated by the cluster itself. High-extinction regions correspond reasonably well with the boundaries of the bubble delineated by PAH emission in the the IRAC bands and scattered light in the NIR. There is a concentration of dense gas to the NE of NGC 6611, and more star formation on the other (north) side of the cloud, in regions of somewhat lower extinction. We compared the spatial distributions of YSOs as a function of evolutionary state and mass, and found no obvious variations with either parameter other than the likely younger NE cluster. Since our maximum extinction through the cloud is A20, which is 1 magnitude of extinction at IRAC wavelengths (Indebetouw et al., 2005), we can still detect YSOs down to masses of about 0.5M☉, and we do not expect to be missing any significant star formation in the region.
The combination of mid-IR imaging at different wavelengths allows one to directly compare the protostellar population to the properties of the molecular cloud in which they are forming. First, we use IRAS 60m and 100m images to determine the temperature of the dust:
where is the emissivity index,
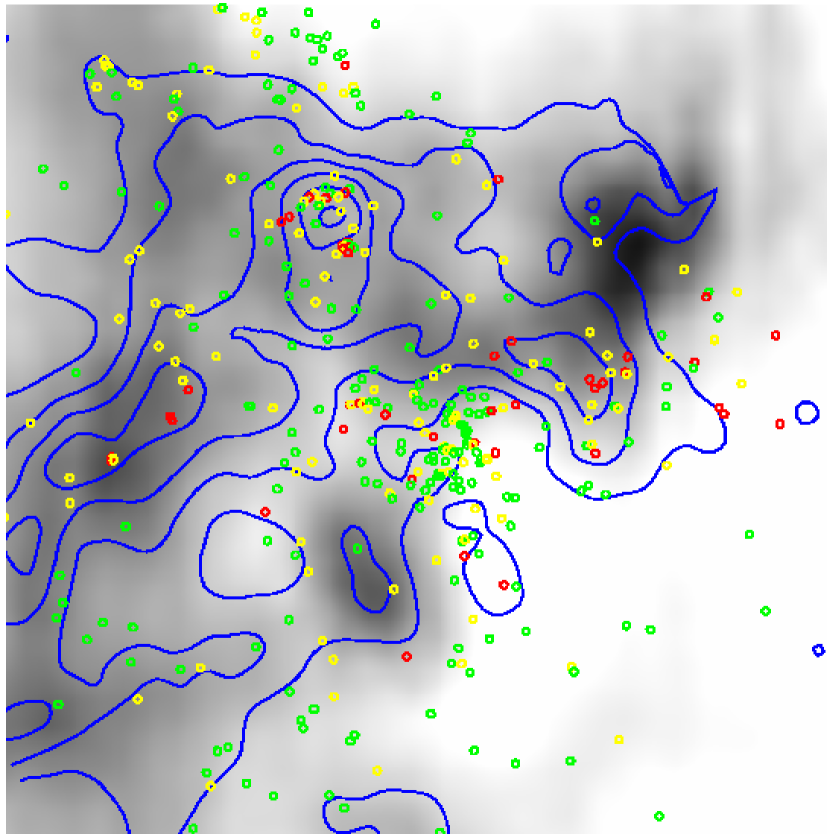
(see e.g. Li & Chen, 1996; Schnee et al., 2005). Figure 7 shows contours of the dust temperature relative to the locations of YSOs and PAH emission. Clearly, the warmest dust is heated by NGC 6611, as one would expect. It is also evident by the NE and SW extensions of the contour shapes centered on the “pillars of creation” that the cavity presumably blown by that young open cluster is warmer than the surrounding denser molecular cloud. There is also some evidence of heating to the west of NGC 6611, perhaps by embedded sources like the massive YSO that we find there (§4.5).
The optical depth of a molecular cloud can also be calculated from the dust emission, and this compares well with our map calculated using embedded stars. Given a temperature, the optical depth of the emitting dust is simply , where is the Plank function. We use the 100m image to calculate , but the results using the 60m are very similar. We used 2 for these calculations; choosing 1 increases the temperatures by 15% and decreases the optical depths by a factor of 2, but does not affect the relative optical depths, which features we are most interested in examining here. Figure 8 compares the optical depth calculated by the fitter using point sources photometered by GLIMPSE to the optical depth calculated from cool dust emission - most features agree well, including the cavity and dense ridge. The new NE cluster region shows high extinction in the point sources, but low optical depth in the dust.
3.2. Clustering
Stars are generally thought to form in cluster environments, so greater clustering in a population should be a sign of youth. The clustering properties of young stellar objects should also reflect any preferred spatial scales associated with the formation mechanism, if those exist. In Figure 9 we show the two-point correlation function of our YSO candidates in the M16 region. We count the number of pairs of YSOs as a function of angular separation , binned logarithmically – i.e. is the number of pairs with separation between and . This distribution is compared to the distribution of separations of a random field of stars with the same average stellar density ; the correlation function is . The maximum value of the correlation function is comparable to peak values of 0.5, 1.5, 6, and 15 in subclusters in the Rosette Molecular Cloud (Li & Smith, 2005), reflecting the strong degree of clustering. The correlation function is only roughly consistent with a power-law (Fig 9, second panel), which would mean there is no preferred spatial scale for star formation in the region. The slope of the correlation function in logarithmic space (-0.8) is also comparable to other clusters (Li & Smith, 2005; Scalo & Chappell, 1999), also indicating fairly strong hierarchical clustering. Typical optical depths in region are AV=15–20, corresponding to N(H2)41020 in the molecular material. The cloud appears filamentary, with thickness about 4pc, so if the depth along the line of sight is similar, the average volume density in the cloud is n()150cm-3, with a thermal Jean’s length of 2pc (R4.8pc(T3/n)0.5 if T is expressed in K and n in cm-3). At a distance of 2kpc, this corresponds to a size scale of 10-1.3; there may be some signature of a turnover in the correlation function at about 10-1.4 degrees, but the result is not definitive. There are also structures in the region of about that size (for example the bubble around NGC 6611, and star-forming pillar 5, (§11) and the correlation function could be reflecting those structures.


The distribution of nearest neighbor distances of young stellar objects can potentially reflect a fragmentation scale. We show that distribution in Figure 10, compared to a random distribution. The YSOs show an excess at separations 10″, or 0.1pc at a distance of 2kpc. This is consistent with the fragmentation scale in the hot dense gas such as in the heads of the pillars and molecular cores near HH216, which are warm and dense (T40K, n105cm-3, Pound, 1998; Andersen et al., 2004, yielding R0.1pc). The signature of the parent molecular cloud’s Jeans length has been seen in the separation of YSOs before, notably by Teixeira et al. (2006) in NGC2264. The YSOs with nearest neighbor distances in the range 10-2.7 to 10-2.2 degrees are located in the densest filamentary parts of the molecular cloud to the north (seen as dark lanes in the 8m image), associated with the HST pillars and pillar 5, and also in NGC6611. This association with dense molecular material suggests that the separation and Jeans length may not merely be a coincidence. It is less clear why many stars in NGC6611 have that nearest neighbor separation - perhaps conditions in the cloud at the time of formation of NGC6611 were similar.
4. Specific Objects and Regions
4.1. The HST “Pillars of Creation”
Using ISOCAM, Pilbratt et al. (1998) stated that the lack of mid-infrared emission along the length of the pillars indicated that there was not enough dense star-forming material present to form new stars. The resolution and sensitivity of the ISOCAM images was not sufficient to rule out very embedded or low-mass stars (the sensitivity limit of 20mJy at 6.7m in bright regions corresponds to a 4M☉ YSO, AV=30, 10age106yr). The higher resolution and sensitivity of the IRAC images allows us to confirm Pilbratt’s statement with much more stringent upper limits - we detect no new mid-infrared point sources down to a limit of 1mJy in the [3.6] band, and 5mJy in the [8.0] band (limited by the strong diffuse background emission), corresponding to 0.4M☉.
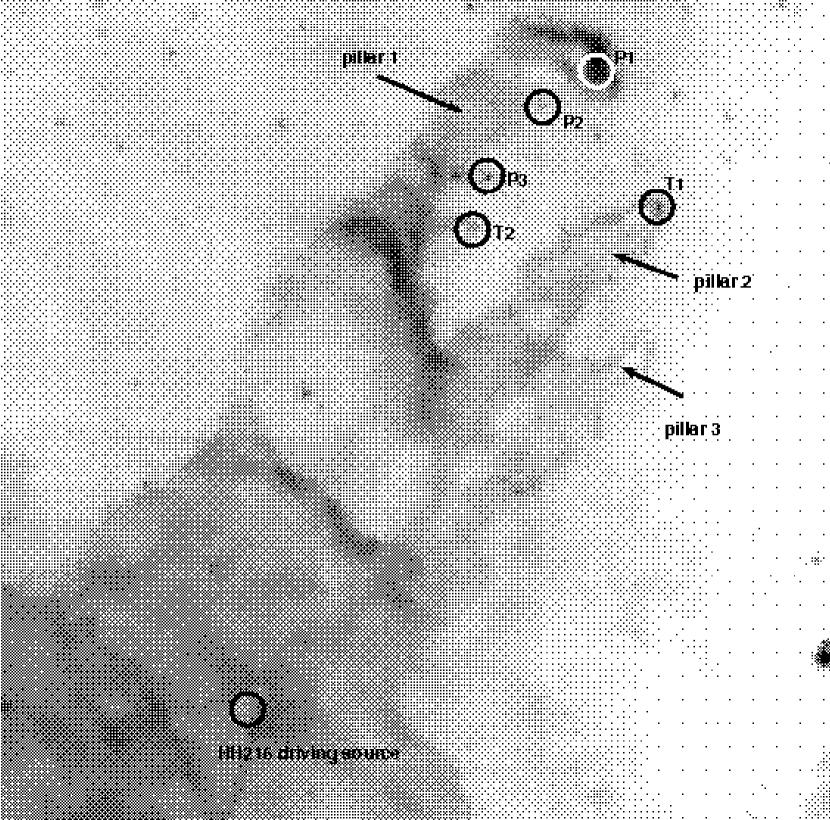
There are a handful of YSOs in the pillars, already identified in the NIR (e.g. Sugitani et al., 2002; Andersen et al., 2004; Thompson et al., 2002). Figure 11 shows the locations and names of notable objects. Our new mid-IR flux densities for many of these allows a more precise determination of their likely physical parameters than was possible from NIR data alone. We use the grid of YSO models described in §2, and demonstrate how to make a careful assessment of all the models that are consistent with the data. Particularly important are any age constraints that could strengthen or weaken arguments that the YSOs in the trunks are triggered by the action of NGC 6611. The evaporation timescale for the trunks is 2107yr, but internal velocity gradients suggest that they will disperse or be torn apart in only 105yr (Pound, 1998). The trunks appear to be in rough pressure equilibrium with the surrounding H II region (P/k8107cm-3K, Pound, 1998), so there is no well-defined “crushing” timescale.
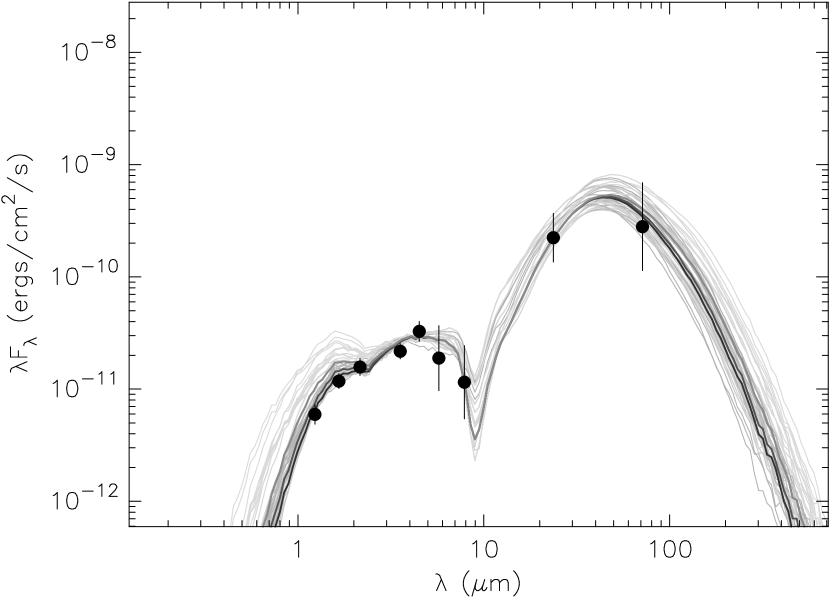
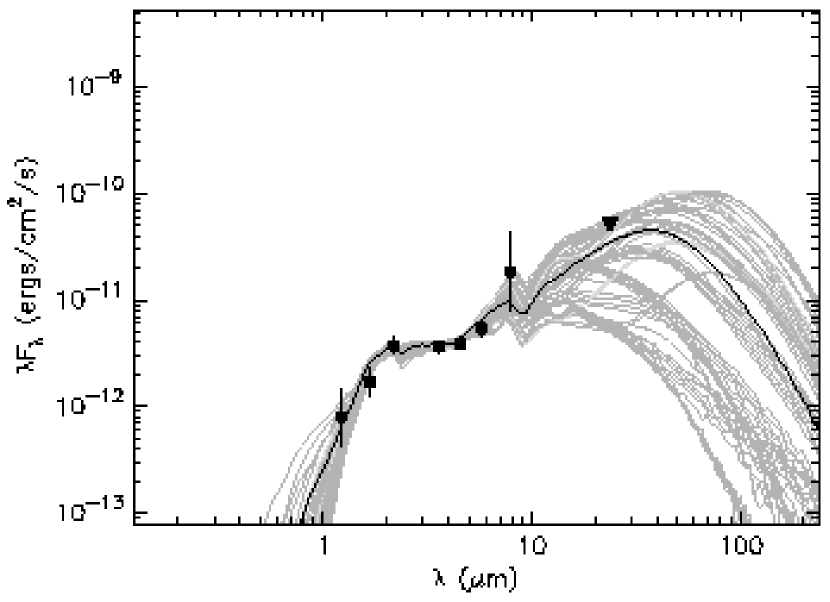
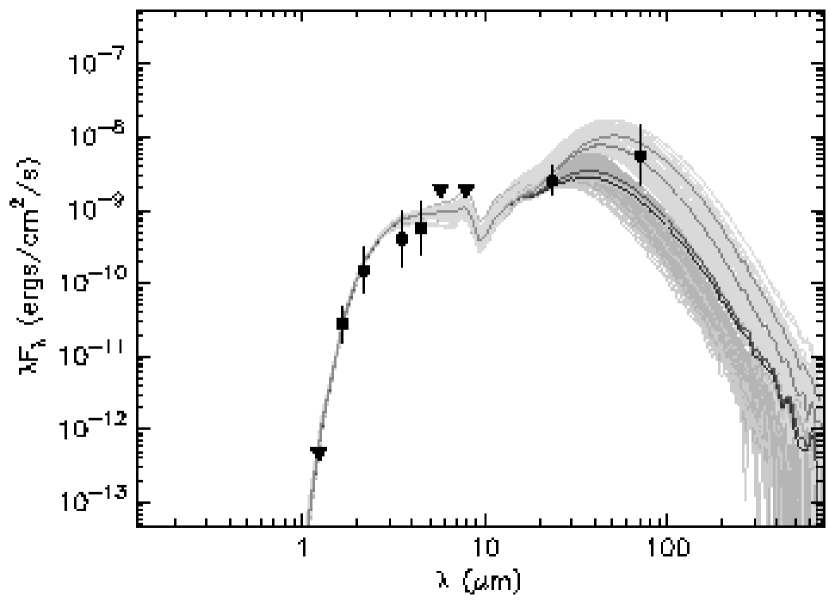
The most prominent young objects in the pillar region are P1 and T1 at the tips of the first and second most northern pillars ( and ), respectively. At our modest 1.5″ spatial resolution, the P1 source is the same as that identified in the NIR by Sugitani et al. (2002), and as M16ES-1 by Thompson et al. (2002). Fukuda, Hanawa, & Sugitani (2002) detect 2.7mm sources further behind P1 in the pillar and suggest that these are distinct YSOs, but our data does not support that suggestion. Figure 12 shows the MIR SED and protostellar models consistent with the data. The 2–24m spectral index of the source is =10.2, Class I in the usual nomenclature (Lada, 1987, Class I: 03, Class II: -20, Class III: -3-2). Source P1’s bolometric luminosity (estimated by ) is 4410L☉ (observed quantities are tabulated in Table 1). Using the pre-main-sequence evolutionary tracks of Siess et al. (2000), this is consistent with a 2.5–4M☉ 3105 old YSO (the tracks are quite close together so a small uncertainty in age or luminosity leads to a large uncertainty in mass). The YSO model fitter produces similar results, as tabulated in Table 2. Models with masses between 1.6 and 6.4M☉ fit the data with 3.7, and the best-fitting model has a mass of 4.5M☉(for this analysis we consider all models which fit to 3.7 because that represents a probability of 1/1000, and we wish to be conservative in our constraints on physical parameters). Those models fit with a foreground (line-of-sight) extinction A4. They have envelope accretion rates Ṁ between 110-5 and 710-4M☉/yr, also consistent with a Class I source. Thompson et al. (2002) derive a stellar luminosity of 200L☉, and comment that the lack of Pa emission suggests a group of several lower-mass objects. Our fitted mass is that of a very late B star, and low ionizing flux. McCaughrean & Andersen (2002) find a somewhat higher mass (10M☉, a B1 star). Those authors also derive an extinction of =27, if all the J and H band light is photospheric. The extinction from our model fit of 4 listed in the Table is only the foreground extinction to the YSO; the total extinction including foreground and circumstellar dust is 40

Another red source, which we and Sugitani et al. (2002) call P2, is located (at least in projection) below the tip of Pillar 1 with respect to NGC 6611, and noted to have high extinction by McCaughrean & Andersen (2002), who call it E23 in correspondence with the H96 EGG of that designation. This source has a spectral index of 0.30.2 and a bolometric luminosity of 5.32.8L☉ - the inability to determine a reliable 24m flux makes it more difficult to constrain this object’s luminosity and evolutionary state. Using the PMS tracks as for P1 and assuming an age of a few 105 years suggests that this source is about 1M☉. Using only a 24m upper limit does not allow the model fitter to constrain the parameters very well either, with accretion rates between zero and 10-3 and masses between a few tenths and a few solar masses fitting the data with . The mid-infrared excess and positive spectral index suggest that accretion is still continuing in this object (and no model without any accretion disk is consistent with the data).

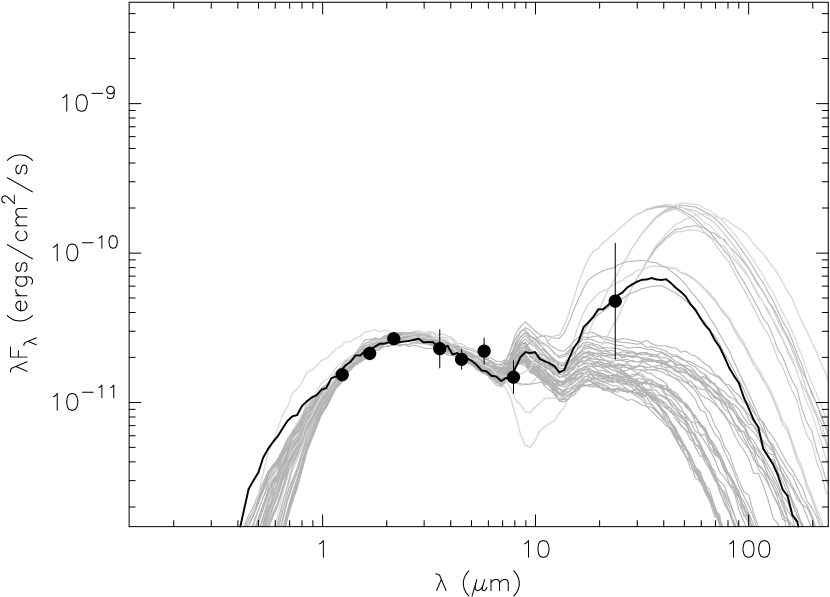
The source at the tip of the central pillar (T1) was classified as a somewhat older source, a candidate T-Tauri star, based on NIR excess (Sugitani et al., 2002). We find a spectral index of -0.30.1 and luminosity of 228L☉. This lower spectral index falls in the Class II (T-Tauri) range, and a several 106 year old object of this luminosity falls in the 2–3M☉ mass range of the Siess et al. (2000) PMS tracks. The models consistent with the data have similar masses (2.4–5.3M☉), and relatively low accretion rates (many disk-only models, without an accreting envelope, fit the data well as seen in Figure 14). Thompson et al. (2002) derive a rather lower luminosity but had to extrapolate from low-resolution MIR data. McCaughrean & Andersen (2002) determine a comparable mass to ours, 2–5M☉. They determine an extinction “down to the photosphere” of =15; we determine a foreground extinction of 5, and the models that fit with have a range of circumstellar extinction from 1 to 20. As seen in Figure 14, the SED would be better defined, and the circumstellar dust distribution better constrained, with optical measurements or a more precise 24m flux density (which would require higher spatial resolution to better separate the source from nearby diffuse emission from the pillars). If indeed this object is fairly evolved (several million years old), then it seems unlikely that it was triggered by the actions of NGC 6611, unless there really are 6Myr evolved stars in that open cluster that were able to make their effects felt very early. It is also possible that the photoablating effects of NGC 6611 have caused premature dispersal of the larger envelope around this source.

The northernmost pillar (; Fig 11) is actually two head-tail structures, or two molecular clouds (Pound, 1998). YSOs found half-way down the pillar obey the same paradigm of “sources forming at the tips of pillars” as the sources at the three tips. After YSO1(P1) and YSO2(T1), two of the objects with highest estimated mass and extinction in the pillars are located in this region: H96 EGGs E31 and E42 (McCaughrean & Andersen, 2002). We will refer to these as P3 and T2, respectively, following Sugitani et al. (2002). P3 (E31) is one of the brightest objects in the pillars by 8m, much brighter than its optically-bright neighbor to the SW. It has a very positive spectral index 2.20.2 and luminosity of 155L☉, which corresponds to about a 1.5M☉ 2105 year old PMS star. Like P1, only models with relatively massive, accreting envelopes fit this source well; it must also be quite young. In both sources, we see that when an object is modeled as having a massive envelope, it is more difficult to constrain the mass of the accretion disk inside that envelope from infrared data alone.
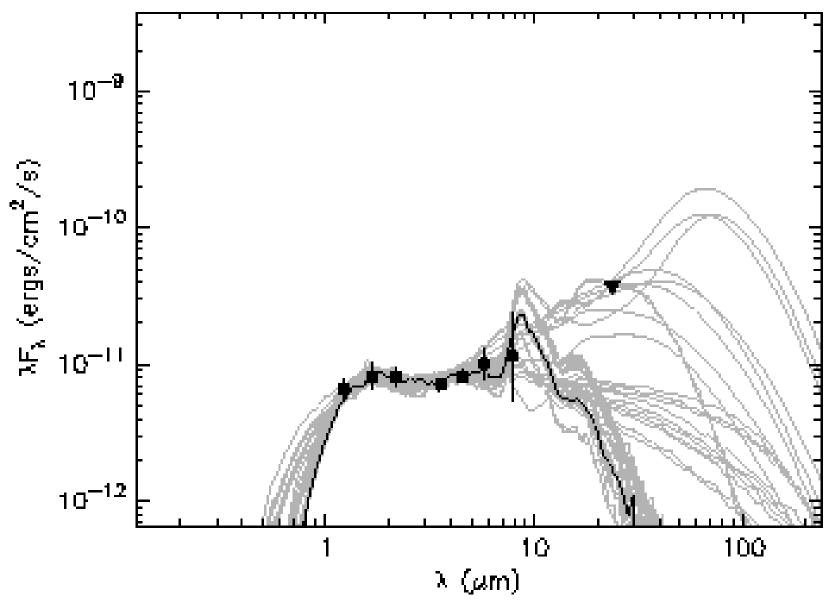
Source T2 is similar in nature to T1: its spectral index 0.20.2 is consistent with zero, and the majority of well-fitting models have low accretion rate (see Fig 16). Its fairly low luminosity 61.5L☉ corresponds to 1.5M☉ at 106 years, and although the best-fitting models have somewhat higher masses, the lack of optical and 24m fluxes make it difficult to constrain the parameters of this source beyond stating that the probability of a very massive envelope is low. Again, if this object is truly so evolved, then the case for triggering by 1-2Myr old stars in NGC 6611 is weakened.


Two stars are located in the concave tip of , either slightly more evolved objects, or a chance line-of-sight alignment (H96, Thompson et al., 2002). We find that these objects are best-fit with extinguished main-sequence stars, not YSOs, supporting the theory that they are not very young objects. Other previously noted objects in the region, such as sources “I” (to the north of Pillar 1) and “367B” of Pilbratt et al. (1998) (to the east of P3) are also best fit by extinguished photospheres, and we do not consider these strong candidates for young stellar objects.
4.2. HH216
HH216 is an optically visible Herbig-Haro object located just south of the base of the three HST pillars (see Fig 11). Andersen et al. (2004) propose that the driving source of HH216 is one of two very red sources located in a structure to the south of the HST pillars, which they call pillar #4. The two sources are irregularly shaped in those author’s NIR data, and are clearly detected in the IRAC data, although unresolved with our poorer resolution. In fact, the confused diffuse emission in the region makes it difficult to extract a reliable flux at [8.0], leaving the SEDs less constrained than some of the other objects which we have discussed. The shape of the SED suggests quite high extinction (AV of several tens), and the spectral indices of 1.60.6 and 1.10.5 for the northern and southern source respectively suggest youth and/or very high extinction. There is not clearly any associated 24m emission, ruling out extremely high luminosities. The Spitzer data are in all consistent with the solar-mass Class I sources that most commonly drive HH jets. Our data do not suggest one or the other as the more likely source for HH216. The source apparently located more in the tip of the pillar, at least in projection, which we call HH-N, has maser emission detected by Healy, Hester, & Claussen (2004), a possible indicator of greater activity.
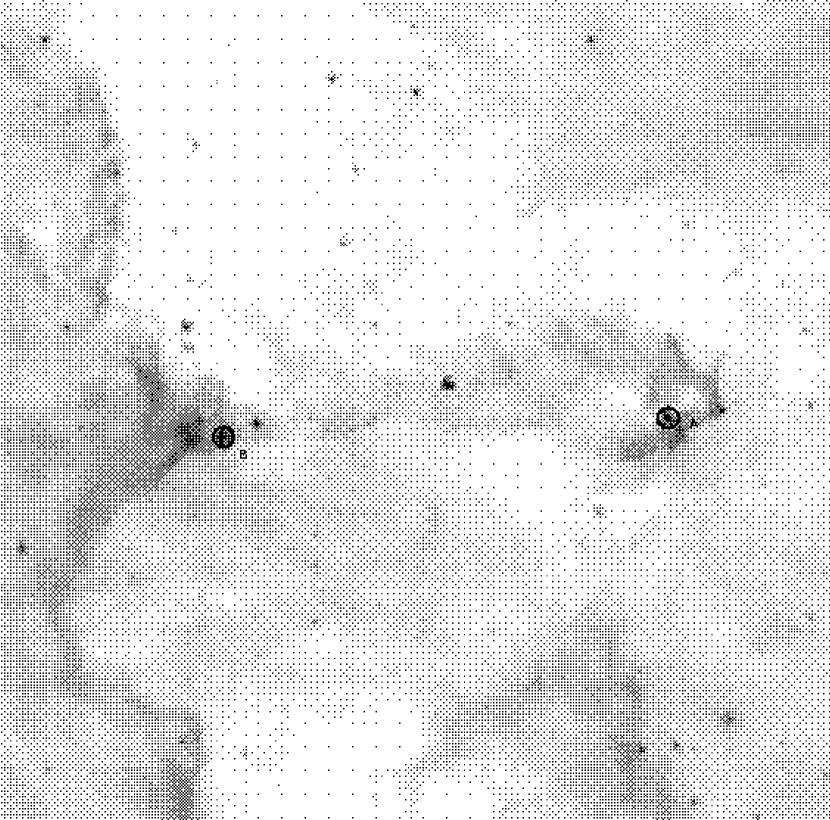
4.3. Pillar 5
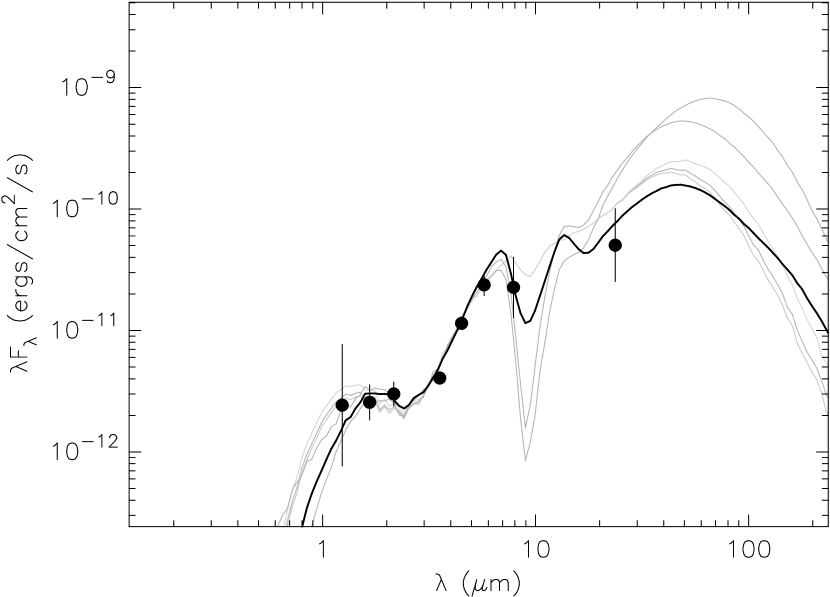
There are several YSO candidates in a prominent pillar to the east of the HST pillars, near 18h19m07s -13h45m24s. This pillar was called pillar #5 by Healy, Hester, & Claussen (2004), who discovered water maser emission in several spots. Figure 17 shows the IRAC image of pillar 5. The masers are coincident with a bright red MIR source; in fact the source is marginally resolved in our images, with two components corresponding to two of the three different clusters of maser sources. We call this source “A”, and its SED is shown in Figure 18. This source’s high spectral index 2.00.1, high luminosity 250100M☉, and the fact that it is a bright 24m source all make it a good candidate for a young intermediate mass YSO. At an age of 1–2105yr, that luminosity corresponds to 6M☉. Well-fitting models have relatively high foreground extinctions A7 and quite massive envelopes of a few 10-5M☉. The other sources in the tips of the “fingers” of this pillar are also classified as YSO candidates, mostly with modest accretion rates. Another quite luminous young object is located near the base of the pillar, and is detected easily at 24m and even at 70m . Source “B” has a high spectral index 1.70.1 and luminosity 20050L☉.

4.4. North Bay
Another region highlighted by Healy, Hester, & Claussen (2004) for the presence of water maser emission is to the north of the HST pillars, around 18h18m46s -13d44m30s. There is a bright submm source here, a faint green MIR source at the peak of the 850m emission (not quite coincident with a water maser), and another offset MIR source which is exactly coincident with another water maser. The former, faint green source is only detected at [3.6] and [4.5]. The latter, on the ridge, is detected only longward of [3.6], and is only well-resolved from the diffuse emission at [4.5]. With so few extractable fluxes, it is difficult to say anything about the nature of these sources, except for their [3.6] and [4.5] flux densities: The faint green source has flux densities of 10.5mJy and 103mJy, and the brighter source on the ridge 135mJy and 203mJy in those two bands.
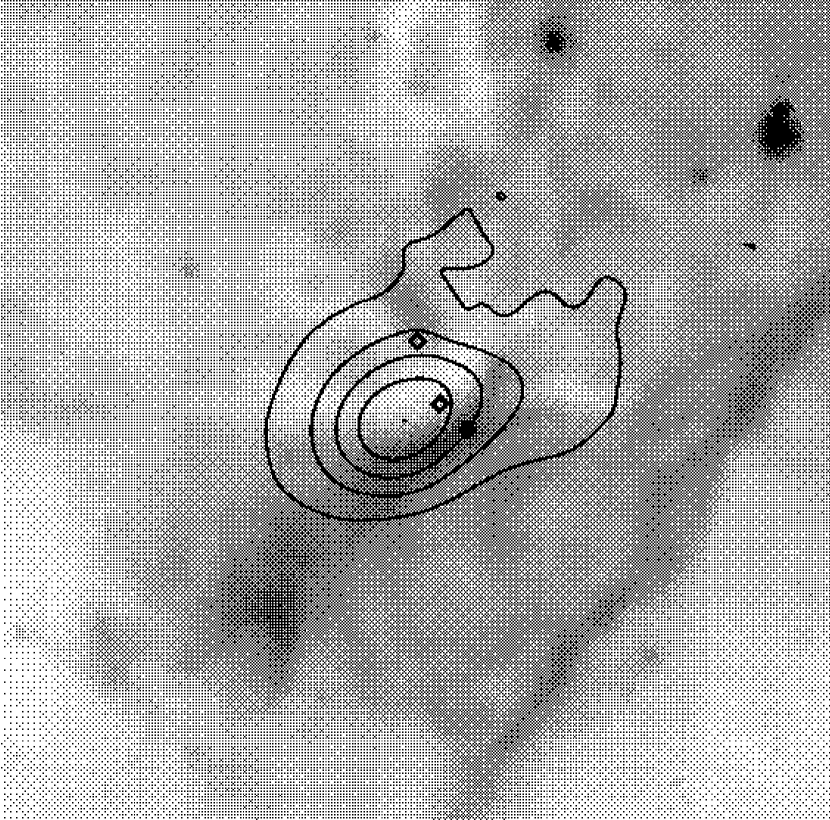
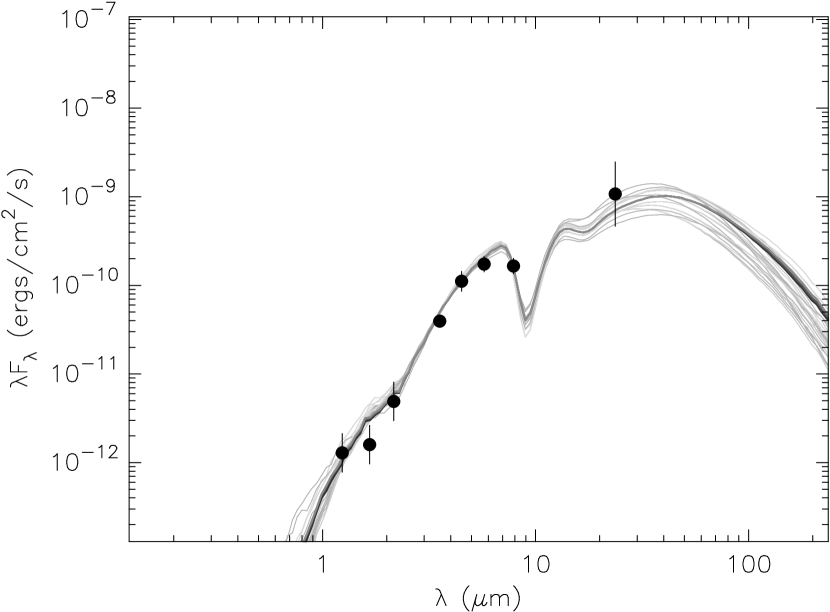
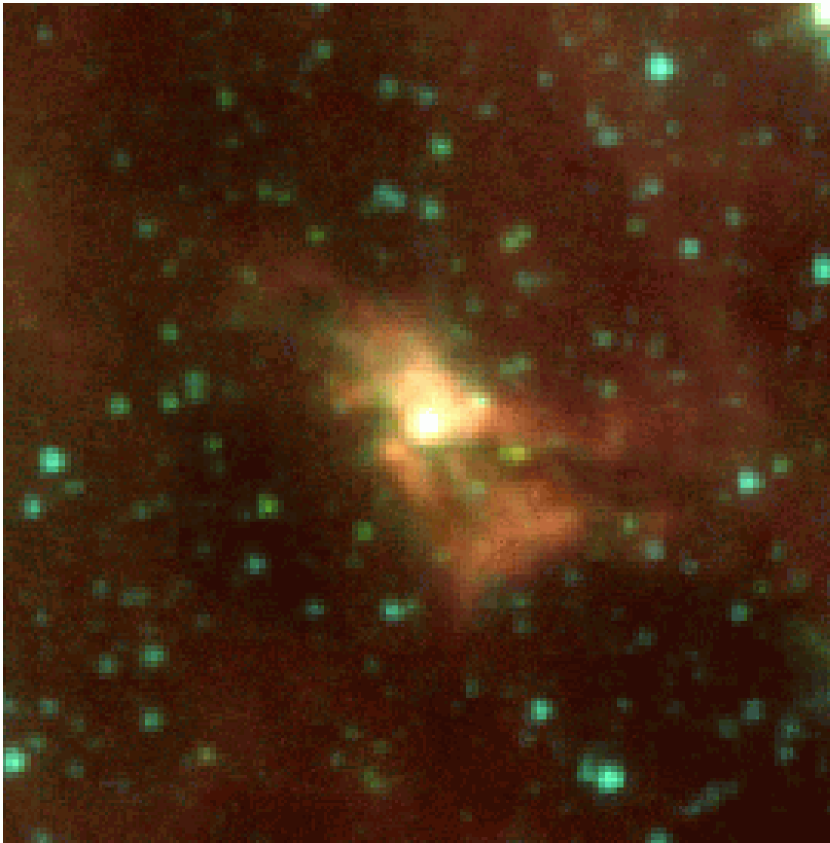
4.5. a new Massive Young Stellar Object
The most luminous YSO which we identify in the region is labeled “MYSO” in Tables 1 and 2, and shown in Figure 20. This YSO is an IRAS source, 18152-1346, and it also appears to have associated water maser emission (Braz & Epchtein, 1983), another sign of massive star formation. The shorter wavelengths (2MASS, IRAC [3.6], [4.5]) show a bright central point source surrounded by either a small cluster, not resolved into individual stars, or extended diffuse emission as might arise in an outflow. The IRAC colors do not show a particular excess at [4.5], as sometimes occurs in sources believed to have outflows (and emission in that band from CO and H2 lines). Precise photometry of this source is made difficult by the extended nature at short wavelengths, and that it is saturated at [8.0] and [24], and marginally saturated at [5.8]. We used a combination of PSF wing fitting, aperture photometry, and comparison with the MSX [8] and [21] fluxes to derive the source’s SED shown in Figure 21. The source’s spectral index 10.3 and luminosity 1000300L☉ suggest that it is young, and may have a mass (from PMS tracks) of about 8M☉. Examination and fitting of the SED shows likely PAH emission from the source, increasing the fluxes at [5.8] and [8.0]. PAH emission is expected from the surface of the accretion disk, or interior of an outflow cavity in a flattened envelope, for such more massive sources with stronger radiation fields. We modeled the source with the measured fluxes in those bands, and also treating them as upper limits (since our model grid does not include PAH emission), and this difference did not greatly change the results. The source is not detected at J, so it must still be very embedded in its molecular cloud – indeed, the best-fitting models have A30. Those models also have quite massive disks and envelopes, with accretion rates of a few times 10-5M☉/yr. However, considering that this is an intermediate to massive star, that accretion rate does not necessarily imply extreme youth. Clearly, followup with spectroscopy and higher resolution photometry at longer wavelengths would be interesting to clarify the nature of this source, which may be responsible for some of the extra heating in that part of the molecular cloud seen in Figure 7.

5. Conclusions
We analyze Spitzer IRAC/GLIMPSE images of the M16 region. The diffuse emission in the long-wavelength IRAC bands (most likely PAH emission) traces the bubble blown by the young open cluster NGC 6611, and highlights the famous HST star-forming pillars. We use a large grid of model spectral energy distributions of young stellar objects to classify all the point sources in the area (0.45∘ of =17.0, =0.8), and select candidate YSOs. The source classification determined using our model grid is comparable to classification based on IRAC colors (e.g Allen et al., 2004; Megeath et al., 2004). Simultaneous use of all photometric information between 1 and 25m provides additional insight into physical parameters like envelope accretion rate and disk mass, and how tightly the data can constrain the circumstellar dust distribution. We particularly highlight sources that can only be fit well by models with massive envelopes, and are thus likely very young. The evolutionary classification possible using MIR data is not always the same as results based on NIR color excess alone.
The distribution of young objects in the region is consistent with a picture of moderate distributed star formation, but no particularly vigorous activity triggered by the optical cluster NGC 6611. We confirm the youthful nature of that cluster, previously quantified as a large fraction of L-band (3.5m) excess sources (85% Oliveira et al., 2005), and a large number of emission-line stars (52, de Winter et al., 1997). Nearly all (95%) of the sources in the NGC 6611 cluster that are detected in at least 4 of the 7 bands (J,H,K,[3.6],[4.5],[5.8],[8.0]) are YSO candidates. We identify a second cluster of YSOs to the northwest, apparently in a concentration of dense gas, and a cluster of YSOs at the tip of pillar 5 to the east. Examination of the two-point correlation function reveals that the YSO candidates are highly clustered. The nearest neighbor distribution suggests a characteristic size scale 0.1pc, which corresponds to the Jeans mass in the clumps at the heads of the pillars. Mid-IR imaging allows us to relate the YSO population to the physical conditions in their natal cloud and to paint a consistent picture of the star formation in M16. A newly discovered intermediate to massive YSO may be responsible for additional heating of the molecular cloud west of NGC 6611.
Finally, we present a detailed examination of selected sources (for example in the HST pillars). Analysis of the 2–24m spectral index, bolometric luminosity, and all of the well-fitting model SEDs allows us to constrain the evolutionary states, stellar and disk masses, and accretion rates, in some cases much more tightly than was possible from NIR data alone. Several sources in the trunks are very young/unevolved and it is possible that these sources were triggered by the compressive action of NGC 6611. The small ages of those sources could even be consistent with the very short destruction timescale for the trunks by velocity gradients (105yr Pound, 1998). On the other hand, some of the other sources in the trunks do not have massive envelopes; these may be more evolved, consistent with Class II or T-Tauri sources, or perhaps photoablation from NGC 6611 has accelerated the dispersal of their envelopes (both are located at pillar tips). If these sources are more than a few 106yr old, it is difficult to understand how they could have been formed by triggering action of 1-2Myr old stars in NGC 6611. We also do not see any particular pattern in evolutionary state, with younger sources farther from NGC6611, as might occur in a situation dominated by triggering (although we note that a pattern might be hidden by the 3D structure of the pillars region as revealed by Pound, 1998). We favor the interpretation that YSOs formed spontaneously in dense parts of the cloud, and then these densest cores have persisted because they are more robust to photo-destruction than surrounding material; YSOs are found in exposed pillars, but were not necessarily formed as a result of that exposure.
6. Acknowledgements
This project makes use of Spitzer’s GLIMPSE and MIPSGAL survey data. Support for the work was provided by NASA through Spitzer Legacy Science Program contracts 1224988 (BAW) and 1224653 (EC, BB, MM, CW, RI) and the Spitzer Fellowship Program (RI). BAE also acknowledges NASA’s Astrophysics Theory Program (NNG05GH35G). This publication makes use of data products from the Two Micron All Sky Survey, which is a joint project of the University of Massachusetts and the Infrared Processing and Analysis Center/California Institute of Technology, funded by the National Aeronautics and Space Administration and the National Science Foundation This research has made use of NASA’s Astrophysics Data System Bibliographic Services.
References
- Allen et al. (2004) Allen, L. E., et al. 2004, ApJS, 154, 363 (A04)
- Allen et al. (2005) Allen, L. E., Hora, J. L., Megeath, S. T., Deutsch, L. K., Fazio, G. G., Chavarria, L., & dell, R. W. 2005, IAU Symposium, 227, 352
- Andersen et al. (2004) Andersen, M., Knude, J., Reipurth, B., Castets, A., Nyman, L. Å., McCaughrean, M. J., & Heathcote, S. 2004, A&A, 414, 969
- Benjamin et al. (2003) Benjamin, R. A., et al. 2003, PASP, 115, 953
- Bonatto et al. (2006) Bonatto, C., Santos, J.F.C. Jr., & Bica, E. 2006 in preparation (astroph/0509805).
- Bonnell et al. (2004) Bonnell, I. A., Vine, S. G., & Bate, M. R. 2004, MNRAS, 349, 735
- Braz & Epchtein (1983) Braz, M. A., & Epchtein, N. 1983, A&AS, 54, 167
- Brott & Hauschildt (2005) Brott, I., & Hauschildt, P. H. 2005, ESA SP-576: The Three-Dimensional Universe with Gaia, 565
- Calvet et al. (1994) Calvet, N., Hartmann, L., Kenyon, S. J., & Whitney, B. A. 1994, ApJ, 434, 330
- Cardelli et al. (1989) Cardelli, J. A., Clayton, G. C., & Mathis, J. S. 1989, ApJ, 345, 245
- Deharveng et al. (2005) Deharveng, L., Zavagno, A., & Caplan, J. 2005, A&A, 433, 565
- Elmegreen et al. (2002) Elmegreen, B. G., Palouš, J., & Ehlerová, S. 2002, MNRAS, 334, 693
- Fazio et al. (2004) Fazio, G. G., et al. 2004, ApJS, 154, 10
- Fitzpatrick (1999) Fitzpatrick, E. L. 1999, PASP, 111, 63
- Healy, Hester, & Claussen (2004) Healy, K. R., Hester, J. J., & Claussen, M. J. 2004, ApJ, 610, 835
- Herbig & Dahm (2001) Herbig, G. H. & Dahm, S. E. 2001, PASP, 113, 195
- Hester et al. (1996) Hester, J. J., et al. 1996, AJ, 111, 2349
- Hillenbrand et al. (1993) Hillenbrand, L. A., Massey, P., Strom, S. E., & Merrill, K. M. 1993, AJ, 106, 1906
- Indebetouw et al. (2005) Indebetouw, R., et al. 2005, ApJ, 619, 931
- Lada (1987) Lada, C. J. 1987, in Star Forming Regions, edited by M. Peimbert & J. Jugaka, Kluwer, Dordrecht, 1
- Lefloch et al. (1997) Lefloch, B., Lazareff, B., & Castets, A. 1997, A&A, 324, 249
- Maercker et al. (2006) Maercker, M., Burton, M. G., & Wright, C. M. 2006, A&A, 450, 253
- McCaughrean & Andersen (2002) McCaughrean, M. J. & Andersen, M. 2002, A&A, 389, 513
- Meade et al. (2005) Meade, M., Whitney, B.A., et al. 2005, GLIMPSE Data Products Document, http://www.astro.wisc.edu/glimpse/glimpsedata.html.
- Meyer et al. (1997) Meyer, M. R., Calvet, N., & Hillenbrand, L. A. 1997, AJ, 114, 288
- Fukuda, Hanawa, & Sugitani (2002) Fukuda, N., Hanawa, T., & Sugitani, K. 2002, ApJ, 568, L127
- Kenyon & Hartmann (1995) Kenyon, S. J., & Hartmann, L. 1995, ApJS, 101, 117
- Kroupa (2001) Kroupa, P. 2001, MNRAS, 322, 231
- Li & Chen (1996) Li, J.-Z., & Chen, P.-S. 1996, Chinese Astronomy and Astrophysics, 20, 445
- Li & Smith (2005) Li, J. Z., & Smith, M. D. 2005, AJ, 130, 2757
- McGroarty & Ray (2004) McGroarty, F., & Ray, T. P. 2004, A&A, 420, 975
- McKee & Tan (2003) McKee, C. F., & Tan, J. C. 2003, ApJ, 585, 850
- Megeath et al. (2004) Megeath, S. T., et al. 2004, ApJS, 154, 367
- Megeath et al. (2005) Megeath, S. T., et al. 2005, IAU Symposium, 227, 383
- Oey et al. (2005) Oey, M. S., Watson, A. M., Kern, K., & Walth, G. L. 2005, AJ, 129, 393
- Ogura, Sugitani, & Pickles (2002) Ogura, K., Sugitani, K., & Pickles, A. 2002, AJ, 123, 2597
- Oliveira et al. (2005) Oliveira, J. M., Jeffries, R. D., van Loon, J. T., Littlefair, S. P., & Naylor, T. 2005, MNRAS, 358, L21
- Pilbratt et al. (1998) Pilbratt, G. L., Altieri, B., Blommaert, J. A. D. L., Fridlund, C. V. M., Tauber, J. A., & Kessler, M. F. 1998, A&A, 333, L9
- Pound (1998) Pound, M. W. 1998, ApJ, 493, L113
- Reach et al. (2005) Reach, W. T., et al. 2005, PASP, 117, 978
- Rieke & Lebofsky (1985) Rieke, G. H., & Lebofsky, M. J. 1985, ApJ, 288, 618
- Robitaille et al. (2006) Robitaille, T. P., Whitney, B. A., Indebetouw, R., Wood, K., & Denzmore, P. 2006, ApJS, 167, 256
- Robitaille et al. (2007) Robitaille, T. P., Whitney, B. A., Indebetouw, R., & Wood, K. 2007, ApJS, 169, 328
- Scalo & Chappell (1999) Scalo, J., & Chappell, D. 1999, ApJ, 510, 258
- Schnee et al. (2005) Schnee, S. L., Ridge, N. A., Goodman, A. A., & Li, J. G. 2005, ApJ, 634, 442
- Siess et al. (2000) Siess, L., Dufour, E., & Forestini, M. 2000, A&A, 358, 593
- Skrutskie et al. (2006) Skrutskie, M. F., et al. 2006, AJ, 131, 1163
- Stetson (1987) Stetson, P. B. 1987, PASP, 99, 191
- Strom et al. (1989) Strom, K. M., Strom, S. E., Edwards, S., Cabrit, S., & Skrutskie, M. F. 1989, AJ, 97, 1451
- Sugitani et al. (2002) Sugitani, K., et al. 2002, ApJ, 565, L25
- Thompson et al. (2002) Thompson, R. I., Smith, B. A., & Hester, J. J. 2002, ApJ, 570, 749
- Teixeira et al. (2006) Teixeira, P. S., et al. 2006, ApJ, 636, L45
- Urquhart et al. (2003) Urquhart, J. S., White, G. J., Pilbratt, G. L., & Fridlund, C. V. M. 2003, A&A, 409, 193
- Walborn et al. (2002) Walborn, N. R., Maíz-Apellániz, J., & Barbá, R. H. 2002, AJ, 124, 1601
- White et al. (1999) White, G. J., et al. 1999, A&A, 342, 233
- Whitney et al. (2003a) Whitney, B. A., Wood, K., Bjorkman, J. E., & Wolff, M. J. 2003a, ApJ, 591, 1049
- Whitney et al. (2003b) Whitney, B. A., Wood, K., Bjorkman, J. E., & Cohen, M. 2003b, ApJ, 598, 1079
- Whitney et al. (2004a) Whitney, B. A., et al. 2004a, ApJS, 154, 315
- Whitney et al. (2004b) Whitney, B. A., Indebetouw, R., Bjorkman, J. E., & Wood, K. 2004b, ApJ, 617, 1177
- de Winter et al. (1997) de Winter, D., Koulis, C., The, P. S., van den Ancker, M. E., Perez, M. R., & Bibo, E. A. 1997, A&AS, 121, 223
| name | R.A. | Dec. | J | H | Ks | [3.6] | [4.5] | [5.8] | [8.0] | [24] | spectral index | log(L⋆) |
|---|---|---|---|---|---|---|---|---|---|---|---|---|
| (J2000) | (J2000) | [mJy] | [mJy] | [mJy] | [mJy] | [mJy] | [mJy] | [mJy] | [mJy] | 2–24m | log(L☉) | |
| P1 | 18h16m00.1s | -13d50m11s | 2.50.5 | 6.61.0 | 12.2.0 | 26.4.0 | 50.10. | 45.30. | 40.30. | 20001000 | 1.00.2 | 4416 |
| P2 | 18h18m51.5s | -13d49m13s | 0.40.25 | 1.00.3 | 2.70.5 | 4.30.5 | 5.90.5 | 10.62.0 | 7060 | 420aa3 upper limit | 0.30.2 | 5.3bbWithout a measured flux density at 24m, is certainly lower than the true bolometric luminosity. Since we do not include flux densities longward of MIPS-24m, all of the luminosities in this table may be low - this is reflected in the luminosities and masses of well-fitting models being somewhat (10-100%) higher. |
| T1 | 18h15m58.5s | -13d51m06s | 6.40.7 | 121.2 | 192.0 | 288.3 | 294.4 | 438.6 | 4010 | 560400 | -0.30.1 | 228 |
| P3 | 18h18m52.3s | -13d49m38s | 1.00.7 | 1.50.5 | 2.20.5 | 4.80.5 | 172.0 | 465.0 | 7040 | 400200 | 2.30.2 | 155 |
| T2 | 18h18m53.2s | -13d49m57s | 2.80.5 | 4.61.0 | 5.91.0 | 8.60.9 | 121.2 | 205.0 | 4030 | 300aa3 upper limit | 0.20.2 | 6.01.5 |
| HH-N | 18h18m58.9s | -13d52m48s | 0.10.09 | 0.30.2 | 1.00.5 | 3.00.5 | 6.31.0 | 6.04.0 | 41aa3 upper limit | 310aa3 upper limit | 1.60.6 | 1.4bbWithout a measured flux density at 24m, is certainly lower than the true bolometric luminosity. Since we do not include flux densities longward of MIPS-24m, all of the luminosities in this table may be low - this is reflected in the luminosities and masses of well-fitting models being somewhat (10-100%) higher. |
| HH-S | 18h18m59.4s | -13d52m57s | 0.050.04 | 0.20.1 | 1.30.5 | 1.70.5 | 5.76.0 | 6.02.0 | 4030 | 270aa3 upper limit | 1.10.5 | 3.0bbWithout a measured flux density at 24m, is certainly lower than the true bolometric luminosity. Since we do not include flux densities longward of MIPS-24m, all of the luminosities in this table may be low - this is reflected in the luminosities and masses of well-fitting models being somewhat (10-100%) higher. |
| P5 A | 18h19m07.2s | -13h45m24s | 0.60.3 | 1.00.5 | 4.02.0 | 474.7 | 17044 | 34060 | 44080 | 1200010000 | 2.00.1 | 250100 |
| P5 B | 18h19m25.33s | -13d45s35.5s | 0.50.3 | 3.00.4 | 242.4 | 20021 | 320150 | 900170 | 1000800 | 27001000 | 1.70.1 | 20050 |
| MYSO | 18h18m08.6s | -13d45m06s | 0.2 | 1810 | 140100 | 7000500 | 1200800 | 37001500 | 50003000 | 2200010000 | 1.00.3 | 1000300 |
| name | AV | M⋆ [M☉] | log(Ṁ [M☉/yr]) | log(Mdisk [M☉]) | |||||||||
|---|---|---|---|---|---|---|---|---|---|---|---|---|---|
| min | aveaaFor each parameter, the minimum and maximum value for any model which fits the data better than (probability of 0.001) is given, along with the average weighted by the probability exp(/2). | max | estimatebbMass estimated from an age consistent with the 2–24m spectral index, and the measured bolometric luminosity, using PMS tracks from Siess et al. (2000). This method is not expected to be more accurate than a factor of 50% in mass. | min | ave | max | min | ave | max | min | ave | max | |
| P1 | 2.0cc Line-of-sight extinction was restricted to be greater than =2, since Hillenbrand et al. (1993) determined that the extinction to NGC6611 is =3.1, and that cluster is in one of the less embedded parts of M16. | 4.4 | 7.0 | 3 | 2.9 | 4.6 | 6.5 | -4.8 | -4.5 | -4.2 | -3.1 | -1.7 | -0.5 |
| P2 | 2.0 | 14 | 19 | 1 | 0.4 | 1.5 | 3.7 | –ddSome disk-only models, with no accreting envelope, fit the data. | -5.2 | -3.5 | -4.0 | -2.5 | -1.3 |
| T1 | 2.0 | 5.0 | 5.7 | 2.5 | 2.6 | 3.2 | 5.3 | – | -6.1 | -4.8 | -3.6 | -2.3 | -0.8 |
| P3 | 2.0 | 5.9 | 9.1 | 1.5 | 0.9 | 1.8 | 5.7 | -5.3 | -4.3 | -3.2 | -4.0 | -2.9 | -1.2 |
| T2 | 2.0 | 8.4 | 11 | 1.5 | 0.2 | 3.2 | 5.5 | – | -6.3 | -3.7 | -7.4 | -5.4 | -1.2 |
| P5A | 2.3 | 6.8 | 8.8 | 6 | 0.5 | 3.1 | 6.5 | -4.9 | -4.5 | -4.3 | -2.6 | -1.6 | -0.7 |
| MYSO | 27 | 31 | 33 | 8 | 7.7 | 8.8 | 9.8 | – | -6.2 | -3.8 | -3.6 | -1.6 | -0.2 |