Inverse-Compton Emission from the Lobes of 3C353
Abstract
Analysis of the radio synchrotron and X-ray inverse-Compton emission from radio-loud active galaxies allows us to determine their particle acceleration processes and electron energy spectra. Previous studies have provided new constraints on the total energy budget and particle content of powerful radio galaxies and quasars; however, in most cases the sources are too faint in the X-ray to obtain spatial information. We present archival and new multi-frequency radio observations from the VLA and GMRT, and XMM-Newton observations of the bright FRII radio galaxy 3C353 which lies on the edge of the X-ray-luminous cluster Zw 1718.1-0108. The X-ray observations detect both the inverse-Compton emission from the radio galaxy lobes and thermal emission from the hot phase of the intracluster medium. We discuss the properties of the particle energy spectrum as a function of position in the lobe, as well as the properties of the merging cluster.
University of Hertfordshire, Science and Technology Research Institute, Hatfield, Herts AL10 9AB, UK
1. Introduction
By studying radio galaxies in the radio and X-ray, we can determine the densities of the electrons emitting via synchrotron radiation in the radio and inverse-Compton in the X-ray. The radio emission alone cannot separate the effects of electron density and magnetic field strength; however using X-ray data, the electron energy density at low energies can be measured directly. The first detections of radio lobes in the X-ray were identified as inverse-Compton scattering of the CMB (e.g. Feigelson et al. 1995; Hardcastle et al. 2002) or of nuclear photons (e.g. Brunetti et al. 1997). More recent studies of the integrated X-ray properties of radio lobes have now been carried out for large samples (Croston et al. 2005; Kataoka & Stawarz 2005), showing that the CMB is the dominant photon population in most cases and providing measurements of the total energy in radio source and hence the work done on the environment. Inverse-Compton emission can now be used to investigate the spatial distribution of electrons and magnetic field in FRII radio galaxies (e.g. Hardcastle & Croston 2005). Here we use spatially resolved X-ray emission to carry out such a study of 3C353.
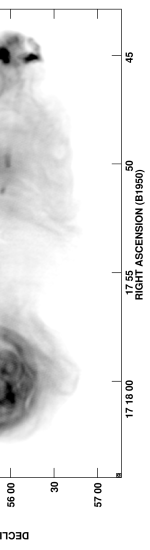
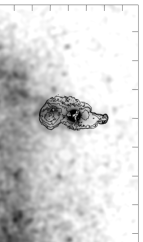
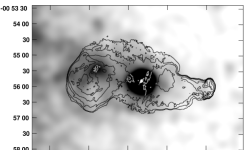
3C353 is an FRII, radio-loud active galaxy associated with the cluster Zw 1718.1-0108 at redshift . The radio source resides in a giant elliptical galaxy on the edge of the cluster. The cluster is bright in the X-ray with a luminous point source coinciding with the radio galaxy’s core (Iwasawa et al. 2000). As one of the brightest object in the low-frequency sky, 3C353 is an ideal target for an inverse-Compton study. We observed it at 330 MHz with the VLA and at 614 MHz at the GMRT in addition to using VLA archival data at 1.4 GHz, 5 GHz and 8.4 GHz, all of which were calibrated using standard methods. Figure 1 shows an example of the image quality achieved in the radio. We also observed 3C353 in the X-ray with XMM-Newton (49408 s livetime for MOS 1 and MOS 2 and 31704 s for pn), so the broad-spectrum electron energy distribution is well sampled. We also resolve the X-ray thermal emission from the cluster, shown in Figure 2, which fills the field of view of XMM-Newton. Our radio data extends to lower frequencies than have been studied previously in the published literature (Swain, Bridle & Baum 1998) whilst our X-ray data has greatly improved sensitivity and resolution compared to the ASCA data of Iwasawa et al. (2000).
2. Origin of the X-ray Emission
By considering the X-ray emission from regions encompassing the east and west lobes but excluding the hotspots and the core, we extracted spectra from the X-ray data set which we fitted with both thermal emission models and power-laws. The power-law model gave better fits than the thermal model, with for 44 d.o.f for the east lobe and for 27 d.o.f for the west lobe. The photon indices were and respectively, consistent with an inverse-Compton model. We therefore conclude that the X-ray emission from the lobes is non-thermal in origin.
Using the multi-frequency radio data, we modelled the synchrotron emission and predicted the form of the inverse-Compton emission at equipartition. The broad-band spectrum for the east lobe is shown in Figure 3. The equipartition inverse-Compton X-ray flux prediction for both lobes is less than the observed X-ray flux by a factor of 2. This corresponds to a variation in the magnetic field strength, . This difference lies within the range of this factor determined by Croston et al. (2005) using a sample of 33 FRII galaxies and quasars and indicates that the lobes of 3C353 are electron dominated. This factor would be reduced if the lobes were not in the plane of the sky.
3. Lobe Properties as a Function of Position
Constructing a spectral index map between the 1.4 GHz and 330 MHz images revealed a variation of across the east lobe. Within the radio luminous region of the east lobe, excluding the hotspots, the spectral index is roughly constant, , despite the filamentary structure seen in Figure 1. We note that the radio lobes do not appear to be entirely separate, and thus consider the region in between the radio luminous lobes, north and south of the core to be an inter-lobe region, which cannot be unambiguously associated with either lobe. This inter-lobe region has a relatively steep radio spectrum whereas the region around the east hotspot exhibits a flatter spectrum.
We also observe a variation in the X-ray/radio ratio, with the steep spectrum lobe region having a ratio four times that of the flat spectrum region near the hotspot. If the magnetic field strength and the number densities of both the inverse-Compton and synchrotron emitting electrons were constant across the lobe, the X-ray/radio ratio would be constant. As this is not what we observe, one or both of these quantities must depend on position in the lobe. We therefore examined the effect of varying either the magnetic field strength or the number densities as a function of position.

3.1. Electron Spectrum Variation
If we consider the magnetic field to be constant at the observed value (see Section 2) and apply an inverse-Compton model to the lobes, we find that the emission at 330 MHz traces electrons with whilst the inverse-Compton emission traces electrons at . As the critical frequency for synchrotron emission goes as , we find that a variation in the X-ray/radio ratio of a factor of 4 would require a variation in the synchrotron spectral index between 10 MHz and 330 MHz of as opposed to the observed at higher frequencies of . Even if the equipartition magnetic field strength is assumed so that the 330 MHz emission traces electrons of , the observed spectral index variation requires a factor variation in the X-ray/radio ratio which is much lower than observed. We cannot therefore explain the observed variations with varying electron densities alone.
3.2. Magnetic Field Variation
If we assume constant electron densities for both the synchrotron and inverse-Compton emission electrons and also assume that the magnetic field strength does not vary along the line of sight, we find that the observed variation in the X-ray/radio ratio then requires a variation in the magnetic field of at most a factor 2.5.
For a given electron population, the critical frequency goes as , so that the spectral indices observed at low frequencies, between 1.4 GHz and 330 MHz, for regions of high X-ray/radio ratio correspond to the spectral indices between 3.5 GHz and 825 MHz for low X-ray/radio ratio regions. We consider the spectral indices between 5 GHz and 1.4 GHz to limit the spectral indices of the low X-ray/radio ratio regions and find that they exceed the upper limit predicted by the observed X-ray/radio ratio.
We thus cannot rule out the possibilty that a varying magnetic field alone could be responsible for the observed variations in the X-ray/radio ratio and the spectral indices; however, we conclude that a varying electron spectrum cannot account for these differences without the addition of a magnetic field variation. Similar conclusions were reached by Hardcastle & Croston (2005) in a study of Pictor A. Analysis of the detailed radio spectral properties will help us to see whether a model in which the electron spectrum is constant throughout the lobes is viable.
4. Characterisation of the Cluster
Figure 2 also shows the thermal emission from the cluster. Thermal fitting to the X-ray data sets for the north and south subcluster regions have revealed a difference in mean temperature, with the northern subcluster having keV and the southern keV. There appears to be no noticable increase in temperature at the boundary, suggesting that the north and south subclusters are not interacting violently.
Iwasawa et al. (2000) included optical observations of the cluster region centred on 3C353, taken using the University of Hawaii 2.2m telescope, in their analysis of Zw 1718.10108. They identified three additional large galaxies, none of which resides in the centre of the northern sub-cluster. Deeper optical observations would help to establish whether there are any galaxies associated with the northern X-ray subcluster.
Further analysis of the cluster X-ray emission and lobe-cluster interaction is ongoing. We will use surface brightness profiles to measure the densities of the clusters which, when combined with the temperature profiles, will allow us to determine the physical conditions in the cluster and the dynamics of the lobe-cluster interaction (Goodger et al., in prep.).
Acknowledgments.
JLG thanks the STFC for a research studentship. MJH acknowledges generous financial support from the Royal Society.
References
- Brunetti et al. (1997) Brunetti, G., Setti, G. & Comastri, A., 1997, A&A 325, 898
- Croston et al. (2005) Croston, J.H., Hardcastle, M.J., Harris, D.E., Belsole, E., Birkinshaw, M. & Worrall, D.M., 2005, ApJ 626, 733
- Feigelson et al. (1995) Feigelson, E.D., Laurent-Muehleisen, S.A., Kollgaard, R.I. & Fomalont, E.B., 1995, ApJ 449, 149
- Hardcastle et al. (2002) Hardcastle, M.J., Birkinshaw, M., Cameron, R.A., Harris, D.E., Looney, L.W. & Worrall, D.M., 2002, ApJ 581, 948
- Hardcastle & Croston (2005) Hardcastle, M.J. & Croston, J.H., 2005, MNRAS 363, 649
- Iwasawa et al. (2000) Iwasawa, K., Ettori, S., Fabian, A.C., Edge, A.C. & Ebeling, H., 2000, MNRAS 313, 515
- Kataoka & Stawarz (2005) Kataoka, J. & Stawarz, L., 2005, ApJ 622, 797
- Swain et al. (1998) Swain, M.R., Bridle, A.H. and Baum, S.A., 1993, ApJ 507, L29