A comprehensive set of simulations studying the influence of gas expulsion on star cluster evolution
Abstract
We have carried out a large set of -body simulations studying the effect of residual-gas expulsion on the survival rate and final properties of star clusters. We have varied the star formation efficiency, gas expulsion timescale and strength of the external tidal field, obtaining a three-dimensional grid of models which can be used to predict the evolution of individual star clusters or whole star cluster systems by interpolating between our runs. The complete data of these simulations is made available on the Internet.
Our simulations show that cluster sizes, bound mass fraction and velocity profile are strongly influenced by the details of the gas expulsion. Although star clusters can survive star formation efficiencies as low as 10% if the tidal field is weak and the gas is removed only slowly, our simulations indicate that most star clusters are destroyed or suffer dramatic loss of stars during the gas removal phase. Surviving clusters have typically expanded by a factor 3 or 4 due to gas removal, implying that star clusters formed more concentrated than as we see them today. Maximum expansion factors seen in our runs are around 10. If gas is removed on timescales smaller than the initial crossing time, star clusters acquire strongly radially anisotropic velocity dispersions outside their half-mass radii. Observed velocity profiles of star clusters can therefore be used as a constraint on the physics of cluster formation.
keywords:
stellar dynamics, methods: N-body simulations, galaxies: star clusters, star formation, open clusters and associations1 Introduction
It is well known that most, if not all, stars form in star clusters. Star clusters can therefore be viewed as the fundamental building blocks of galaxies since the galactic disc velocity distribution (Kroupa, 2002, 2005), the galactic stellar mass function (Weidner & Kroupa, 2005) and the galactic-field binary-star population (Kroupa, 1995) are all established by them.
Star clusters form as so called embedded clusters within the dense cores of giant molecular clouds. The star formation efficiency (SFE), i.e. the fraction of gas that is converted into stars, can be defined as follows:
| (1) |
where is the total mass of stars formed in the embedded cluster and the mass of the gas not converted into stars. Inside molecular cloud cores, the star formation efficiency is usually smaller than % (Lada, 1999; Lada & Lada, 2003). Over the whole molecular cloud, the star formation efficiency is even lower and only of the order of a few percent (Clark & Bonnell, 2004). Since the time-scale for the formation of a star cluster is yrs, far larger than the typical crossing time-scale of a star cluster, star clusters are most likely in virial equilibrium before the gas is lost, and the velocity of the stars reflects the overall gravitational potential (Kroupa, 2005). Together with the low SFEs, this implies that once the primordial gas is expelled by UV radiation and massive stellar winds from OB stars or supernova explosions, star clusters will become super-virial and their further dynamical evolution will be strongly affected by the gas loss.
The impact of gas expulsion and the subsequent response of the star cluster has been the subject of a large number of theoretical investigations (Tutukov, 1978; Hills, 1980; Lada, Margulis & Dearborn, 1984; Goodwin, 1997a, b; Kroupa, Petr & McCaughrean, 1999; Adams, 2000; Kroupa, Aarseth & Hurley, 2001; Geyer & Burkert, 2001; Boily & Kroupa, 2003a, b; Fellhauer & Kroupa, 2005; Bastian & Goodwin, 2006). Using the virial theorem, Hills (1980) argued that if the gas is lost instantaneously and the SFE is below 50%, the entire cluster should be disrupted. Later analytic and -body modeling (Lada, Margulis & Dearborn, 1984; Geyer & Burkert, 2001; Boily & Kroupa, 2003a, b) have mainly confirmed Hills ideas but also shown that the actual limit for bound star cluster formation in case of instantaneous gas-loss is somewhat lower. Lada, Margulis & Dearborn (1984) obtained a bound star cluster with a SFE as low as %, and the simulations of Geyer & Burkert (2001) indicate that the critical SFE is below %. Using more realistic assumptions, Kroupa, Aarseth & Hurley (2001) computed the evolution of Orion-Nebula-like clusters showing that they disperse leaving young Pleiades pre-cursors embedded in expanding OB associations.
In the early phases of the evolution, before the first supernova explosions go off, gas is lost from star clusters mainly through radiation pressure and stellar winds from bright OB stars. Both radiation pressure and stellar winds need some time to expel the gas from a star cluster. A single 10 M⊙ (85 M⊙) star for example ejects an energy of () erg/s into the interstellar medium in the form of radiation and mechanical energy (Kroupa, 2005). This is enough to unbind gas from a , pc cluster within yrs, comparable to the crossing time of such a cluster.
If the gas is not lost instantaneously but adiabatically, i.e. over a timescale much longer than the cluster’s crossing time, the cluster stars can adjust to the change in potential and the critical SFE needed for star cluster survival can be significantly lower. Lada, Margulis & Dearborn (1984) obtained bound clusters with SFEs as low as 20% if the gas expulsion timescale was equal to several initial crossing times. They also found that between 10% to 80% of the initial stars were lost from such systems, especially stars from the outer cluster parts where the initial velocities are more likely to exceed the escape velocities of the cluster once the gas is expelled. Similarly, Goodwin (1997a) found that star clusters in tidal fields can form bound systems with SFEs as low as 20% which will survive for a Hubble time if the initial concentration of the cluster is high enough. Star clusters might also survive low SFEs if they form through merging of individual star clusters in star cluster complexes and the gas is lost in different clusters at different times (Fellhauer & Kroupa, 2005). Finally, Adams (2000) studied cluster response to gas blow out assuming that the SFE varies with radius, finding core survival for high central values of the SFE.
While many aspects of the residual gas expulsion have already been studied in the literature, nobody has so far tried to perform a systematic study of the survival limit and the final parameters of star clusters evolving under residual gas expulsion. In addition, with the exception of Goodwin (1997a) and Kroupa, Aarseth & Hurley (2001), the influence of the external tidal field has so far been largely neglected.
In the present paper, we have performed a large parameter study of residual gas expulsion from star clusters, varying the star formation efficiency, the ratio of the gas expulsion time scale to the crossing time of the star cluster and the ratio of the half-mass radius to the tidal radius of the star cluster. Our grid of models will be useful in later studies of individual star clusters and also whole star cluster systems since the evolution of the clusters can be determined by interpolation between our grid points, without the need for further simulations. This makes it possible to determine the effect of gas expulsion on whole cluster systems where the large number of clusters prevents simulations for all individual clusters.
Our simulations rely on a number of simplifying assumptions, like e.g. that all stars in a cluster form at the same time, that the SFE is constant with radius, or that the overall gas density is spherical. However, relaxing most of these assumptions should make relatively little change to our results. For example, whether stars in a cluster form at the same time or not has no influence on the dynamical reaction of the cluster to gas expulsion since this reaction depends only on the fraction of gas thrown out. What happens to the gas which remains, whether it has been turned into stars 10 Myrs before gas expulsion, or 1 Myr before, or at the time the other gas leaves is not relevant. Similarly, gas might leave a cluster in certain parts, where e.g. the overall density is lower, earlier than in other parts, leading to a non-spherical distribution of the gas. However the dynamical influence of the gas is not through its density distribution but through the potential this density gives rise to and a potential field is always much smoother than the underlying density. Hence, the assumption that the external gas distribution is spherical should also have only a small influence on our results.
2 The models
In our runs, we assumed that the SFE does not depend on the position inside the cluster, so gas and stars followed the same density distribution initially, which was given by a Plummer model. The gas was not simulated directly, instead its influence on the stars was modeled as a modification to the equation of motion of stars. Modeling the gas as an additive potential has been shown by Geyer & Burkert (2001) to be a good approximation of the essential physics driving early cluster evolution. We used the collisional -body code NBODY4 (Aarseth, 1999) to perform the simulations. Since NBODY4 uses a Hermite scheme to integrate the motion of stars, the correction terms due to the external gas on the acceleration and its first derivative have to be evaluated at each step. For a Plummer model, the necessary correction terms can be derived analytically and are given by:
| (2) | |||||
where is the position vector of a star relative to the cluster centre, the gravitational constant, , is the total mass in gas left at time and is the scale length of the Plummer model. Gas expulsion was assumed to start at a certain time , which was set equal to one -body time unit (Heggie & Mathieu, 1986), equivalent to of a crossing time at the clusters virial (= gravitational) radius (Binney & Tremaine, 1987). This small offset was introduced in order to test for each cluster if our set-up program created clusters that start in an equilibrium state when the external gas is present. After the delay time , the gas density was decreased exponentially on a characteristic time , so the total gas left at later times is given by (Kroupa, Aarseth & Hurley, 2001):
| (3) |
will henceforth be called the gas expulsion timescale. The influence of the external tidal field was modeled in the so-called ’Near Field Approximation’, which assumes that the size of the star cluster is much smaller than its distance from the galactic centre. For clusters moving in a circular orbit through a spherical galactic potential, the equation of motion of stars in a reference frame rotating with the star cluster can be expressed as (Aarseth, 1985):
| (4) |
Here the first term on the right hand side is the gravitational acceleration due to the star cluster (both stars and gas), the second term is the Coriolis acceleration and the third term is a combination of centrifugal and tidal forces and it was assumed that the cluster moves in the x-y plane. The angular velocity is given by:
| (5) |
For real star clusters, six parameters will determine their fate under the influence of gas expulsion: the total initial cluster mass , the half-mass radius, , and galactocentric distance, , of the cluster, the total mass, , of the parent galaxy inside the cluster position, and the star formation efficiency, , and gas expulsion timescale, . The number of parameters can however be reduced efficiently: The timescale of gas expulsion for example enters not through its absolute value, but only through its ratio with the initial crossing time of the star cluster. At the virial radius, , the initial crossing time is given by (Hut & Heggie, 2003):
| (6) |
If gas expulsion happens slowly, stars can adjust to the change in potential and clusters expand adiabatically. In the other extreme, gas is lost instantaneously and clusters are strongly effected by gas expulsion. Similarly, and determine together with the cluster mass the tidal radius of the star cluster:
| (7) |
Dynamically important is not the absolute value of , but only the ratio of : If this ratio is low, clusters are nearly isolated and can expand freely, while if the ratio is high, they are strongly tidally limited and easily destroyed.
Hence, within the framework of our model, the fate of a star cluster can be deduced by specifying only three parameters: The star formation efficiency , the ratio of the gas expulsion time scale to the crossing time of the star cluster, and the strength of the external tidal field, quantified by the ratio of the half-mass radius to the tidal radius.
This reduction in the number of parameters
makes it feasible to run a grid
of models covering the complete parameter space. To this end, we have performed a set of -body
simulations, varying
the initial star formation efficiency, the ratio of half-mass radius to the tidal radius ,
and the ratio of the gas expulsion time scale to the crossing time of the cluster .
The following values were chosen as grid-points:
:
5%, 10%, 15%, 20%, 25%, 33%, 40%, 50%, 75%
:
0.01, 0.033, 0.06, 0.1, 0.15, 0.2
:
0.0, 0.05, 0.10, 0.33, 1.00, 3.0, 10.0
The chosen range of parameter values essentially covers the relevant part of parameter space since star formation efficiencies of less than 10% lead to cluster destruction while efficiencies higher than 75% have not been seen in nature and lead to nearly complete cluster survival. Also, clusters with are nearly isolated and we do not expect that results will change much when choosing even smaller ratios, while clusters with are strongly limited by the tidal field and nearly all of them are destroyed. Similarly, our values of cover the interesting range for open/globular clusters.
All runs were performed with the collisional -body code NBODY4 (Aarseth, 1999) on the GRAPE6 computers (Makino et al., 2003) of our group at Bonn University. All simulated clusters contained 20.000 equal-mass stars initially, distributed according to a Plummer sphere. The simulations were run for 1000 initial -body times (equivalent to about 300 initial crossing times). We found that this was sufficient since the gas is lost on a much shorter timescale and all clusters have settled into an equilibrium state by this time. Also, running for longer times would have meant that relaxation effects could have become important since the relaxation time of the stellar component is about 250 initial crossing times. Our models can be viewed as a first step towards realistic models since two-body relaxation is not important in our runs and stellar evolution is neglected completely. In realistic star clusters, both effects would become important in the later stages of cluster evolution.
| SFE | SFE | SFE | |||||||||||||||
|---|---|---|---|---|---|---|---|---|---|---|---|---|---|---|---|---|---|
| 0.10 | 0.010 | 10.00 | 0.65 | 9.79 | 0.184 | 0.40 | 0.033 | 0.05 | 0.24 | 3.61 | 0.193 | 0.50 | 0.150 | 0.33 | 0.33 | 1.22 | -0.106 |
| 0.10 | 0.033 | 10.00 | 0.35 | 8.17 | -0.143 | 0.40 | 0.033 | 0.10 | 0.28 | 3.46 | 0.214 | 0.50 | 0.150 | 1.00 | 0.55 | 1.37 | -0.138 |
| 0.15 | 0.010 | 3.00 | 0.49 | 8.26 | 0.305 | 0.40 | 0.033 | 0.33 | 0.50 | 2.83 | 0.207 | 0.50 | 0.150 | 3.00 | 0.60 | 1.41 | -0.117 |
| 0.15 | 0.010 | 10.00 | 0.87 | 6.38 | 0.053 | 0.40 | 0.033 | 1.00 | 0.79 | 2.30 | 0.078 | 0.50 | 0.150 | 10.00 | 0.61 | 1.44 | -0.115 |
| 0.15 | 0.033 | 3.00 | 0.27 | 6.07 | -0.124 | 0.40 | 0.033 | 3.00 | 0.93 | 2.39 | 0.004 | 0.50 | 0.200 | 1.00 | 0.24 | 1.05 | -0.152 |
| 0.15 | 0.033 | 10.00 | 0.77 | 5.93 | -0.046 | 0.40 | 0.033 | 10.00 | 0.97 | 2.45 | 0.027 | 0.50 | 0.200 | 3.00 | 0.24 | 1.07 | -0.100 |
| 0.15 | 0.060 | 10.00 | 0.50 | 5.09 | -0.150 | 0.40 | 0.060 | 0.00 | 0.11 | 2.34 | -0.135 | 0.50 | 0.200 | 10.00 | 0.28 | 1.08 | -0.171 |
| 0.20 | 0.010 | 1.00 | 0.22 | 8.91 | 0.418 | 0.40 | 0.060 | 0.05 | 0.16 | 2.30 | -0.095 | 0.75 | 0.010 | 0.00 | 0.99 | 1.42 | 0.092 |
| 0.20 | 0.010 | 3.00 | 0.75 | 5.01 | 0.180 | 0.40 | 0.060 | 0.10 | 0.16 | 2.35 | -0.064 | 0.75 | 0.010 | 0.05 | 0.99 | 1.40 | 0.070 |
| 0.20 | 0.010 | 10.00 | 0.94 | 4.73 | 0.040 | 0.40 | 0.060 | 0.33 | 0.36 | 2.31 | 0.042 | 0.75 | 0.010 | 0.10 | 0.99 | 1.40 | 0.075 |
| 0.20 | 0.033 | 3.00 | 0.66 | 4.50 | 0.053 | 0.40 | 0.060 | 1.00 | 0.72 | 2.15 | 0.030 | 0.75 | 0.010 | 0.33 | 0.99 | 1.37 | 0.048 |
| 0.20 | 0.033 | 10.00 | 0.89 | 4.57 | 0.008 | 0.40 | 0.060 | 3.00 | 0.89 | 2.23 | -0.003 | 0.75 | 0.010 | 1.00 | 0.99 | 1.34 | 0.036 |
| 0.20 | 0.060 | 3.00 | 0.48 | 3.81 | -0.114 | 0.40 | 0.060 | 10.00 | 0.93 | 2.35 | -0.017 | 0.75 | 0.010 | 3.00 | 1.00 | 1.34 | 0.034 |
| 0.20 | 0.060 | 10.00 | 0.75 | 4.16 | -0.088 | 0.40 | 0.100 | 0.33 | 0.24 | 1.76 | -0.148 | 0.75 | 0.010 | 10.00 | 1.00 | 1.33 | 0.050 |
| 0.25 | 0.010 | 1.00 | 0.52 | 5.11 | 0.331 | 0.40 | 0.100 | 1.00 | 0.60 | 1.85 | -0.078 | 0.75 | 0.033 | 0.00 | 0.97 | 1.42 | 0.076 |
| 0.25 | 0.010 | 3.00 | 0.85 | 3.80 | 0.086 | 0.40 | 0.100 | 3.00 | 0.75 | 2.05 | -0.065 | 0.75 | 0.033 | 0.05 | 0.97 | 1.40 | 0.074 |
| 0.25 | 0.010 | 10.00 | 0.96 | 3.81 | 0.002 | 0.40 | 0.100 | 10.00 | 0.76 | 2.08 | -0.071 | 0.75 | 0.033 | 0.10 | 0.97 | 1.40 | 0.067 |
| 0.25 | 0.033 | 1.00 | 0.40 | 4.10 | 0.145 | 0.40 | 0.150 | 1.00 | 0.35 | 1.54 | -0.153 | 0.75 | 0.033 | 0.33 | 0.98 | 1.38 | 0.065 |
| 0.25 | 0.033 | 3.00 | 0.80 | 3.55 | 0.023 | 0.40 | 0.150 | 3.00 | 0.42 | 1.63 | -0.164 | 0.75 | 0.033 | 1.00 | 0.99 | 1.31 | 0.041 |
| 0.25 | 0.033 | 10.00 | 0.94 | 3.70 | -0.004 | 0.40 | 0.150 | 10.00 | 0.45 | 1.70 | -0.157 | 0.75 | 0.033 | 3.00 | 0.99 | 1.34 | 0.044 |
| 0.25 | 0.060 | 1.00 | 0.25 | 3.14 | -0.116 | 0.50 | 0.010 | 0.00 | 0.72 | 2.95 | 0.269 | 0.75 | 0.033 | 10.00 | 0.99 | 1.31 | 0.040 |
| 0.25 | 0.060 | 3.00 | 0.68 | 3.25 | -0.060 | 0.50 | 0.010 | 0.05 | 0.71 | 3.01 | 0.279 | 0.75 | 0.060 | 0.00 | 0.94 | 1.33 | 0.070 |
| 0.25 | 0.060 | 10.00 | 0.83 | 3.43 | -0.050 | 0.50 | 0.010 | 0.10 | 0.73 | 2.86 | 0.264 | 0.75 | 0.060 | 0.05 | 0.94 | 1.32 | 0.058 |
| 0.25 | 0.100 | 3.00 | 0.41 | 2.78 | -0.123 | 0.50 | 0.010 | 0.33 | 0.82 | 2.36 | 0.199 | 0.75 | 0.060 | 0.10 | 0.94 | 1.34 | 0.070 |
| 0.25 | 0.100 | 10.00 | 0.47 | 2.89 | -0.156 | 0.50 | 0.010 | 1.00 | 0.93 | 1.98 | 0.073 | 0.75 | 0.060 | 0.33 | 0.95 | 1.33 | 0.061 |
| 0.33 | 0.010 | 0.00 | 0.01 | 6.91 | 0.254 | 0.50 | 0.010 | 3.00 | 0.98 | 1.95 | 0.041 | 0.75 | 0.060 | 1.00 | 0.96 | 1.30 | 0.035 |
| 0.33 | 0.010 | 0.05 | 0.01 | 7.53 | -0.417 | 0.50 | 0.010 | 10.00 | 0.99 | 1.96 | 0.009 | 0.75 | 0.060 | 3.00 | 0.97 | 1.28 | 0.027 |
| 0.33 | 0.010 | 0.10 | 0.04 | 8.66 | 0.374 | 0.50 | 0.033 | 0.00 | 0.64 | 2.64 | 0.221 | 0.75 | 0.060 | 10.00 | 0.97 | 1.28 | 0.013 |
| 0.33 | 0.010 | 0.33 | 0.35 | 5.00 | 0.393 | 0.50 | 0.033 | 0.05 | 0.65 | 2.59 | 0.228 | 0.75 | 0.100 | 0.00 | 0.86 | 1.23 | 0.011 |
| 0.33 | 0.010 | 1.00 | 0.74 | 3.00 | 0.165 | 0.50 | 0.033 | 0.10 | 0.67 | 2.41 | 0.207 | 0.75 | 0.100 | 0.05 | 0.86 | 1.20 | 0.017 |
| 0.33 | 0.010 | 3.00 | 0.92 | 2.84 | 0.028 | 0.50 | 0.033 | 0.33 | 0.77 | 2.16 | 0.152 | 0.75 | 0.100 | 0.10 | 0.82 | 1.26 | 0.037 |
| 0.33 | 0.010 | 10.00 | 0.98 | 2.97 | -0.002 | 0.50 | 0.033 | 1.00 | 0.90 | 1.87 | 0.049 | 0.75 | 0.100 | 0.33 | 0.87 | 1.20 | 0.019 |
| 0.33 | 0.033 | 0.33 | 0.25 | 3.54 | 0.166 | 0.50 | 0.033 | 3.00 | 0.96 | 1.91 | 0.022 | 0.75 | 0.100 | 1.00 | 0.89 | 1.20 | -0.023 |
| 0.33 | 0.033 | 1.00 | 0.68 | 2.79 | 0.122 | 0.50 | 0.033 | 10.00 | 0.98 | 1.94 | 0.013 | 0.75 | 0.100 | 3.00 | 0.91 | 1.18 | -0.015 |
| 0.33 | 0.033 | 3.00 | 0.89 | 2.76 | 0.028 | 0.50 | 0.060 | 0.00 | 0.52 | 2.13 | 0.103 | 0.75 | 0.100 | 10.00 | 0.91 | 1.22 | -0.011 |
| 0.33 | 0.033 | 10.00 | 0.96 | 2.92 | -0.003 | 0.50 | 0.060 | 0.05 | 0.55 | 2.07 | 0.093 | 0.75 | 0.150 | 0.00 | 0.70 | 1.05 | -0.057 |
| 0.33 | 0.060 | 0.33 | 0.15 | 2.48 | -0.064 | 0.50 | 0.060 | 0.10 | 0.55 | 2.11 | 0.107 | 0.75 | 0.150 | 0.05 | 0.69 | 1.06 | -0.054 |
| 0.33 | 0.060 | 1.00 | 0.59 | 2.50 | 0.022 | 0.50 | 0.060 | 0.33 | 0.67 | 1.98 | 0.087 | 0.75 | 0.150 | 0.10 | 0.71 | 1.02 | -0.038 |
| 0.33 | 0.060 | 3.00 | 0.84 | 2.61 | -0.031 | 0.50 | 0.060 | 1.00 | 0.84 | 1.79 | 0.018 | 0.75 | 0.150 | 0.33 | 0.73 | 1.05 | -0.040 |
| 0.33 | 0.060 | 10.00 | 0.90 | 2.77 | -0.021 | 0.50 | 0.060 | 3.00 | 0.93 | 1.84 | 0.014 | 0.75 | 0.150 | 1.00 | 0.77 | 1.05 | -0.036 |
| 0.33 | 0.100 | 1.00 | 0.44 | 2.13 | -0.149 | 0.50 | 0.060 | 10.00 | 0.95 | 1.88 | -0.003 | 0.75 | 0.150 | 3.00 | 0.78 | 1.06 | -0.060 |
| 0.33 | 0.100 | 3.00 | 0.67 | 2.33 | -0.097 | 0.50 | 0.100 | 0.00 | 0.35 | 1.57 | -0.081 | 0.75 | 0.150 | 10.00 | 0.78 | 1.05 | -0.044 |
| 0.33 | 0.100 | 10.00 | 0.68 | 2.39 | -0.093 | 0.50 | 0.100 | 0.05 | 0.35 | 1.59 | -0.072 | 0.75 | 0.200 | 0.00 | 0.50 | 0.84 | -0.115 |
| 0.40 | 0.010 | 0.00 | 0.34 | 4.84 | 0.392 | 0.50 | 0.100 | 0.10 | 0.39 | 1.61 | -0.057 | 0.75 | 0.200 | 0.05 | 0.52 | 0.83 | -0.104 |
| 0.40 | 0.010 | 0.05 | 0.35 | 5.22 | 0.423 | 0.50 | 0.100 | 0.33 | 0.52 | 1.56 | -0.038 | 0.75 | 0.200 | 0.10 | 0.50 | 0.85 | -0.110 |
| 0.40 | 0.010 | 0.10 | 0.37 | 4.77 | 0.393 | 0.50 | 0.100 | 1.00 | 0.73 | 1.58 | -0.042 | 0.75 | 0.200 | 0.33 | 0.54 | 0.86 | -0.109 |
| 0.40 | 0.010 | 0.33 | 0.59 | 3.41 | 0.302 | 0.50 | 0.100 | 3.00 | 0.83 | 1.71 | -0.036 | 0.75 | 0.200 | 1.00 | 0.57 | 0.88 | -0.082 |
| 0.40 | 0.010 | 1.00 | 0.84 | 2.47 | 0.106 | 0.50 | 0.100 | 10.00 | 0.84 | 1.69 | -0.056 | 0.75 | 0.200 | 3.00 | 0.59 | 0.90 | -0.083 |
| 0.40 | 0.010 | 3.00 | 0.95 | 2.41 | 0.031 | 0.50 | 0.150 | 0.00 | 0.13 | 1.11 | -0.128 | 0.75 | 0.200 | 10.00 | 0.59 | 0.89 | -0.096 |
| 0.40 | 0.010 | 10.00 | 0.99 | 2.47 | 0.014 | 0.50 | 0.150 | 0.05 | 0.14 | 1.14 | -0.165 | ||||||
| 0.40 | 0.033 | 0.00 | 0.25 | 3.46 | 0.220 | 0.50 | 0.150 | 0.10 | 0.14 | 1.13 | -0.179 |
Table 1 gives an overview of the simulations performed. The first three columns give the star formation efficiency , the ratio of , and the value of . The next columns give the fraction of bound mass remaining at the end of the runs , the final half-mass radius in terms of the initial one and the global anisotropy parameter , which is defined by the following formula:
| (8) |
Here the sums run over all stars bound to the star cluster at the end of the runs and and are the tangential and radial velocity component of each star. The anisotropies were calculated after the stellar velocities were transformed back into a non-rotating coordinate system. For isotropic velocity dispersions, , while radial (tangential) anisotropic velocity dispersions correspond to positive (negative) values of . A complete list of results, including the time evolution of different parameters and data for runs which do not lead to cluster survival can be found under the following internet address: http://www.astro.uni-bonn.de/webaiub/german/downloads.php/ .
3 Results
3.1 Final cluster properties in dependence of initial parameters
Figs. 1 and 2 depict results for the bound mass fraction at the end of the simulations as a function of star formation efficiency, strength of the external tidal field and gas expulsion timescale. The different panels in Fig. 1 depict four cases for each of which the ratio of gas expulsion timescale to the crossing time of the clusters was held constant. In case of instantaneous gas-loss (upper left panel), models with star formation efficiencies of 40% or larger result in surviving clusters. In case of a very weak external tidal field (), even the model with a SFE of 33% produces a bound cluster containing 0.9% of the initial stars, which agrees will with estimates from the literature (Lada, Margulis & Dearborn, 1984).

Prolonging the timescale on which the gas is removed also increases the mass fraction of bound stars in the clusters. If the tidal field is weak, star clusters can survive star formation efficiencies below 20% if the gas is removed slowly (see Table 1 and uppermost curves in the lower right panel). Kroupa, Aarseth & Hurley (2001) performed fully realistic -body calculations which included a tidal field realistic for the solar neighbourhood and gas expulsion on a thermal time scale. For their model B, which had and and a SFE of 33%, they found a bound mass fraction of 25% after gas expulsion, which agrees very well with the results of our runs. For slow gas removal, nearly 100% of stars remain bound if the star formation efficiency is larger than 30%.
Our simulations also show that the limit for survival depends on the strength of the external tidal field: The higher the ratio of , the higher is the star formation efficiency needed to produce a surviving cluster. As long as the strength of the external tidal field is smaller than , it has only a moderate influence on cluster dissolution. However, cluster survivability is drastically reduced if the strength of the external tidal field is changed from to . In the case of , SFEs of less than 50% do not lead to the formation a bound star cluster since expanding clusters get easily disrupted due to the strong external tidal field; in this case a small initial mass loss leads to an expansion which triggers catastrophic mass-loss across the tidal boundary. Star clusters must therefore form concentrated in order to survive gas expulsion. This is possible if they form for example as either high concentration () King models or underfilling their tidal radius.

Similar results can also be found in Fig. 2, which depicts the bound mass fraction as a function of the gas expulsion timescale. For gas expulsion timescales up to and including , our results are nearly independent of the actual value of , showing that as long as the gas is removed with , the results do not depend on the details of the gas removal. Similarly, differences between the and the case are also relatively small, at least for high SFEs.
For a typical star formation efficiency of 25%, the gas expulsion timescale has to be larger than in order to produce a bound star cluster. In our runs, star formation efficiencies of 5% did not lead to the formation of bound star clusters, which justifies that we did not perform any runs with lower SFE.
Figs. 3 compares our results for the bound mass fraction as a function of the star formation efficiency with published results from the literature. Shown are cases when the gas is removed instantaneously (right group of points) and cases of slow gas removal. It can be seen that for instantaneous gas removal there is very good agreement between the results of this paper and published results. SFEs of 33% already lead to a final bound cluster, although only a very small mass fraction remains bound in this case. For a SFE of 50%, about 70% of the total cluster mass remains bound. In case of near adiabatic gas removal, we find that the critical SFE needed to produce a bound cluster is between 5% to 10%. This is about 5% smaller than what Geyer & Burkert (2001) found for their model N2 with . Performing additional -body runs shows that the difference becomes significantly smaller if we let the gas fraction decrease linearly with time, as was done by Geyer & Burkert (2001). The remaining difference is probably due to the different density profiles. Geyer & Burkert (2001) used King and models in their runs, which are significantly less concentrated than the Plummer models we use.
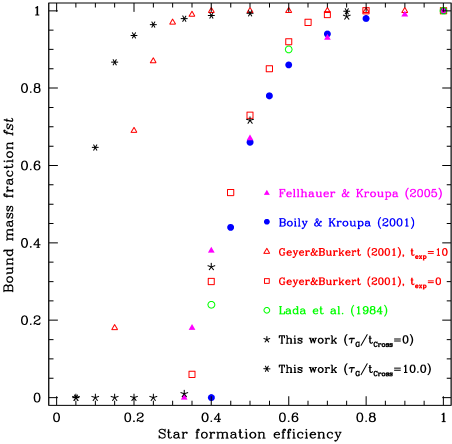
Fig. 4 depicts the ratio of the final half-mass radius compared to the initial one as a function of the star formation efficiency. In contrast to the previous two figures, only models leading to bound clusters are plotted, which explains why the curves don’t extend to low star formation efficiencies.

Due to the lowering of the cluster potential when the gas is removed, all star clusters expand and the final half-mass radii are mostly larger than the initial ones. This is despite the fact that the tidal field removes weakly bound stars from the clusters. If gas is removed adiabatically, the total energy is conserved and the ratio of final to initial half-mass radius must obey the following relation (Hills, 1980):
| (9) |
The dashed line in the lower right panel shows the expected expansion due to eq. 9. It indeed gives a good fit to our results for nearly isolated clusters in which the gas is removed slowly.
Clusters in strong tidal fields () show only very small expansion as a result of the gas removal. For typical values of the star formation efficiency (25%), expansion factors are around 3 or 4 in most cases. Hence, typical half-mass radii of embedded star clusters should be smaller by this factor than the corresponding ones of open or globular clusters. Observational data indeed suggests expansion, although the expansion factors may be even larger than found here (Kroupa, 2005). The reason could be that shortly after gas expulsion, unbound stars are still sufficiently close to the cluster to be counted as members, making the clusters appear larger. In addition, young cluster systems contain a mix of bound clusters and more extended clusters which are dissolving but are still sufficiently compact to appear as star clusters. Both effects might increase the observed average cluster radius for systems which are a few 10s of Myr old (see discussion of Fig. 6 and Bastian & Goodwin (2006)).
Fig. 4 also shows that in each model family, the expansion is strongest for clusters which have the smallest star formation efficiency that still produces a bound star cluster. This is to be expected since low star formation efficiency means a stronger decrease of the overall cluster potential and as long as the tidal field is weak, a cluster can expand since stars in the halo are not removed. For specific parameter combinations, the final half-mass radius can be a factor 10 higher than the initial one. It can also be seen from Fig. 4 that quick mass-loss generally leads to stronger expansion than adiabatic mass-loss.
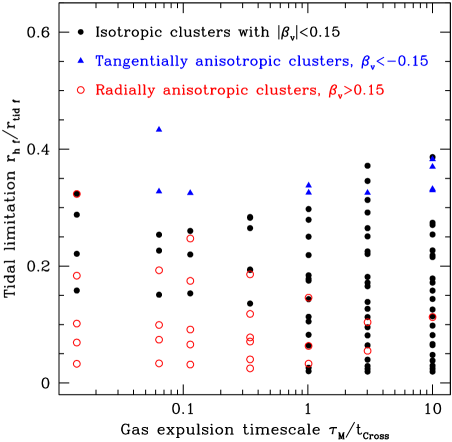
Fig. 5 finally shows the global anisotropies of the clusters by the time the simulations were stopped. Only clusters with are shown since models with higher SFEs are hardly affected by gas expulsion. The anisotropies were calculated using eq. 8 and summing over all stars which were still bound to the clusters at the end of the simulations. Clusters in which the gas is removed quickly generally acquire radially anisotropic velocity distributions. This is due to the fact that such clusters are super-virial after gas removal. As a result, the stars expand more or less radially outwards and the cluster halos become populated by stars on radial orbits. A close inspection of these clusters shows that the innermost parts normally stay isotropic. Adiabatic gas-loss on the other hand leads to more or less isotropic velocity dispersions (filled circles in Fig. 5), at least if the clusters start with an isotropic velocity dispersion as is the case in our runs. If clusters are immersed in strong tidal fields (upper points in Fig. 5), the global velocity profile becomes tangentially anisotropic since the Coriolis force due to the tidal field forces the expanding cluster stars onto more tangential orbits. The clusters also acquire significant rotation in their outer parts in this case as a result of the non-radial acceleration of the stars due to the Coriolis force, and possibly also angular momentum dependent escape of stars.
The features just described might be detectable in star clusters which are dynamically young, i.e. for which the ratio of their relaxation time to their age is large . A number of globular clusters in the Milky Way, like for example Cen, have relaxation times of the order of a Hubble time or only slightly smaller. For a subset of them, the tidal radius is also significantly larger than the cluster’s half-mass radius, meaning that tidal effects are likely not important for these clusters. Observation of the velocity dispersion profile would allow to constrain the timescale over which the gas was expelled in these clusters.
3.2 Evolution of individual clusters and observational consequences of gas expulsion
Fig. 6 depicts the evolution of Lagrangian radii of all stars including unbound ones with time for two typical star clusters from our runs. As a result of rapid gas expulsion, both star clusters expand strongly in the beginning, pushing a large fraction of their stars over the tidal radius. For the cluster in the left panel, a small fraction of stars falls back after about 10 to 20 initial crossing times and forms a bound cluster. In this cluster, the Lagrangian radii become essentially constant with time after about 50 initial crossing times, justifying our maximum simulation time of 350 initial crossing times. Compared to the initial cluster, the half-mass radius of the final cluster has increased by a factor 2.8 and only 32% of the stars of the initial cluster are still bound to the final cluster.

The cluster in the right panel has the same star formation efficiency and ratio as the cluster in the left panel, but loses the gas on a slightly faster timescale ( compared to ). This small difference is enough to completely unbind this cluster. The dissolution happens within the first 50 initial crossing times. Nevertheless, the appearance of both clusters up to this point is very similar in terms of the structural parameters seen by an observer. This is depicted in more detail in Fig. 7 which shows the evolution of the core radius (taken to be the 5% projected Lagrangian radius) and the projected half-mass radius of the two clusters of Fig. 6. Here again all stars including unbound ones were used to calculate the radii. It can be seen that the half-mass radii evolve in a very similar way initially, since even after 20 initial crossing times the half-mass radius of the dissolving cluster is only 40% larger than that of the surviving cluster. The difference in the core radii is larger, but is still within a factor of 4 after 20 initial crossing times. Since for typical cluster parameters, one crossing time is of the order of a few 0.1 Myrs, it will be difficult to discriminate bound from unbound clusters in young star cluster systems. Note also that the expansion factor of the projected radii is about 10 in both cases, being consistent with empirical data (Kroupa, 2005).

Fig. 8 depicts the total mass that an observer would derive based on the velocity dispersion, compared to the total mass remaining bound to the cluster. Virial masses were calculated for all stars projected inside the tidal radius of the cluster and for all stars projected inside the half-mass radius. The virial ratio is 3 initially since the cluster formed with a SFE of 33%. As the gas is removed, many stars are pushed over the tidal radius and the bound mass drops. This explains the sharp rise in the ratio of virial mass to the total bound mass during the first 10 crossing times. The virial ratio drops later as the unbound stars leave the vicinity of the cluster. The initial increase is weaker if only stars inside the half-mass radius are used to determine the virial mass due to the higher central density of the cluster and the smaller relative contribution of escaping stars. Nevertheless, even inside the half-mass radius, it takes about 30 initial crossing times until the virial mass estimate is a reliable estimate of the true cluster mass. This overestimate of a cluster’s mass due to the early violent relaxation associated with gas expulsion has recently also been pointed out by Bastian & Goodwin (2006).

Fig. 9 finally shows the anisotropy profile of the star cluster with =0.33, and . The anisotropy was calculated according to eq. 8. Our initial clusters are isotropic throughout. Due to the gas removal and the resulting escape of stars, the velocity dispersion becomes strongly radially anisotropic in the outer parts. After 10 initial crossing times, the anisotropy reaches nearly close to the tidal radius due to escaping stars. After the unbound stars have left the cluster, the radial anisotropy decreases and for the cluster shown the final profile is isotropic again in the center and close to the tidal radius, and mildly radial anisotropic at intermediate radii.

4 Conclusions
We have performed a large grid of simulations studying the impact of initial gas expulsion on the survival rate and final properties of star clusters, varying the star formation efficiency, ratio of gas expulsion timescale to the crossing time of the cluster and the strength of the external tidal field.
Our simulations show that both the star formation efficiency and the speed with which the gas is removed have a strong influence on the evolution of star clusters. In the case of instantaneous gas removal, clusters have to form with SFEs in order to survive gas expulsion. This limit is significantly lowered for gas removal on longer timescales and clusters with SFEs as low as 10% can survive gas expulsion in the adiabatic limit if the external tidal field is weak. External tidal fields have a significant influence on the cluster evolution only if the ratio of is larger than about 0.05. Below this value, star clusters behave nearly as if they are isolated.
All star clusters expand due to gas expulsion. For star formation efficiencies around 25%, star clusters expand by a factor of 3 or 4, nearly independent of the speed with which the gas is removed. Open or globular clusters must therefore have formed more compact and with higher central densities than with what we see them today. Star clusters that just managed to hold together should have expanded strongest and in rare cases expansion factors of 10 or more are possible.
The velocity dispersion profiles of surviving clusters are tangentially anisotropic in their outer parts if the clusters are strongly effected by the external tidal field. For nearly isolated clusters, the velocity profile is radially anisotropic if the gas was removed on a timescale smaller than the crossing time of the cluster, while slow gas expulsion leads to mainly isotropic velocity dispersions. In the central parts of star clusters, the velocity profile preserves its initial shape. This offers a chance to test how star formation and gas expulsion is happening in nature by studying the velocity profiles of sufficiently isolated and dynamically young () star clusters.
The simulations reported here should be useful for a number of follow-up projects. First, they allow us to study the impact of gas expulsion on the evolution of the mass function and other properties of whole globular cluster systems in galaxies: Starting with a range of cluster parameters and SFEs, the mass fraction remaining bound to each individual cluster can be calculated by interpolating between the runs in our grid. Repeating the process for all clusters will then give the impact of gas expulsion on the whole star cluster system and as a function of the age of the system. Our runs also allow to test to which degree mass determinations of young star clusters through measurements of the radial velocity dispersion are affected by the initial gas expulsion (Bastian & Goodwin, 2006). Finally, observations of individual star clusters can be directly compared with our simulations to infer their starting conditions. We plan to carry out such projects in the near future.
Acknowledgements
We are grateful to Genevieve Parmentier and Ian Bonnell for useful discussions. This work was supported by the DFG Priority Program 1177 ’Witnesses of Cosmic History: Formation and evolution of black holes, galaxies and their environment’.
References
- Aarseth (1985) Aarseth, S. J., 1985, in Multiple Time Scales, Brackbill J. U., Cohen B. I., eds., Academic Press, New York, p. 377
- Aarseth (1999) Aarseth, S. J., 1999, PASP, 111, 1333
- Adams (2000) Adams, F., 2000, ApJ, 542, 964
- Bastian & Goodwin (2006) Bastian, N., Goodwin, S. P., 2006, MNRAS, 369, 9
- Binney & Tremaine (1987) Binney, J., Tremaine, S., 1987, Galactic Dynamics, Princeton Univ. Press, Princeton
- Boily & Kroupa (2003a) Boily, C. M., Kroupa, P., 2003a, MNRAS, 338, 665
- Boily & Kroupa (2003b) Boily, C. M., Kroupa, P., 2003b, MNRAS, 338, 673
- Churchwell (1997) Churchwell, E., 1997, ApJ, 479, 59
- Clark & Bonnell (2004) Clark, P. C., Bonnell, I. A., 2004, MNRAS, 347, L36
- Fellhauer & Kroupa (2005) Fellhauer, M., Kroupa, P., 2005, ApJ, 630, 879
- Geyer & Burkert (2001) Geyer, M. P., Burkert, A., 2001, MNRAS, 323, 988
- Goodwin (1997a) Goodwin, S. P., 1997a, MNRAS, 284, 785
- Goodwin (1997b) Goodwin, S. P., 1997b, MNRAS, 286, 669
- Heggie & Mathieu (1986) Heggie, D. C., Mathieu, R. D., 1986, in LNP Vol. 267: The Use of Supercomputers in Stellar Dynamics, eds. P. Hut and S. McMillan, p. 233
- Hills (1980) Hills, J. G., 1980, ApJ, 235, 986
- Hut & Heggie (2003) Hut, P., Heggie, D., 2003, The gravitational million-body problem, Cambridge University Press, p. 7
- Kroupa (1995) Kroupa, P., 1995, MNRAS, 277, 1491
- Kroupa (2002) Kroupa, P., 2002, MNRAS, 330, 707
- Kroupa (2005) Kroupa, P., 2005, The Fundamental Building Blocks of Galaxies, in Proceedings of the Gaia Symposium ”The Three-Dimensional Universe with Gaia”, Turon, C., O’Flaherty, K.S., Perryman, M.A.C., eds., p. 629, astro-ph/0412069
- Kroupa, Aarseth & Hurley (2001) Kroupa, P., Aarseth, S., Hurley, J., 2001, MNRAS, 321, 707
- Kroupa, Petr & McCaughrean (1999) Kroupa, P., Petr, M. G., McCaughrean, M. J., 1999, New Astronomy, 4, 495
- Lada (1999) Lada, E. A., 1999, The Role of Embedded Clusters in Star Formation, in NATO ASIC Proc. 540: The Origin of Stars and Planetary Systems, Lada, C.J. & Kylafis, N.D. eds., p. 441
- Lada, Margulis & Dearborn (1984) Lada, C. J., Margulis, M., Dearborn, D., 1984, ApJ, 285, 141
- Lada & Lada (2003) Lada, C. J., Lada, E. A., 2003, ARA&A, 41, 57
- Makino et al. (2003) Makino, J., Fukushige, T., Koga, M., & Namura, K., 2003, PASJ, 55, 1163
- Palla et al. (2005) Palla, F., Randich, S., Flaccomio, E., Pallavicini, R., 2005, ApJ, 626, 49
- Tutukov (1978) Tutukov, A. V., 1978, ApJ, 70, 57
- Weidner & Kroupa (2005) Weidner, C., Kroupa, P., 2005, ApJ, 625, 754
- Whitmore et al. (1999) Whitmore, B. C., et al., 1999, AJ, 118, 1551