Dielectric relaxation and polar phonon softening in relaxor ferroelectric PbMg1/3Ta2/3O3
Abstract
Relaxor ferroelectric PbMg1/3Ta2/3O3 ceramics and thin films were investigated by means of broad-band dielectric, time-domain terahertz (THz) and Fourier-transform infrared (IR) spectroscopy in the frequency range 100 Hz - 90 THz at temperatures 100 - 490 K, the THz and IR spectra were studied from 20 to 900 K. Diffused and strongly temperature dependent peak in the complex permittivity is caused by a dielectric relaxation due to the dynamics of polar clusters. The relaxation appears below Burns temperature in the THz range, slows down on cooling through the microwave and MHz range and anomalously broadens. The shortest and longest relaxation times of the distribution of relaxation times follow Arrhenius and Vogel-Fulcher law, respectively. The degree of B-site order has only a small influence on the parameters of the dielectric relaxation and almost no influence on the phonon parameters. Below T180 K the distribution of relaxation frequencies becomes broader than our experimental spectral range and frequency independent dielectric losses develop below 100 GHz in the spectra. Although the macroscopic crystal structure is cubic, IR spectra give evidence about the lower local symmetry which can be assigned to the presence of polar clusters below . Infrared spectra above still reveal more modes than predicted by selection rules in the paraelectric phase of the space group so that we suggest selection rules which take into account chemical inhomogeneity in the ”-perovskite sublattice.
pacs:
63.20.-e; 77.22.-d; 78.30.-jI Introduction
The relaxor ferroelectricity in complex perovskites like PbMg1/3Nb2/3O3 (PMN) has been intensively investigated since the early work by Smolenskii and Agranovskaya smolenskii58 and the interest in this class of dielectrics underwent a revival after the pioneering work by Park and Shrout park97 , who discovered ultrahigh strain and giant piezoelectric response in PbMg1/3Nb2/3O3-PbTiO3 and PbZn1/3Nb2/3O3-PbTiO3 single crystals. The relaxor ferroelectrics exhibit a high and broad peak in the temperature dependent permittivity whose position remarkably shifts to higher temperatures with increasing measuring frequency. The peculiar dielectric properties are caused by a wide dielectric relaxation which broadens and slows down on cooling.viehland The relaxation originates from the dynamics of polar clusters (1-6 nm in diameter), which develop below the Burns temperature Td (600-700 K in various complex perovskites)burns83 and it is believed that the broad distribution of relaxation frequencies has its origin in random fields and random forces as a consequence of chemical disorder in the perovskite B sites occupied by two cations of different valence (e.g. Mg2+ and Nb5+ in PMN).westphal92 Therefore it appears that the degree of chemical order of B-site cations plays a crucial role in the dielectric response of perovskite relaxors.
It was shown that the B cations in Pb(B’B”)O3 (B’=Mg, Ni, Zn and B”=Nb, Ta) perovskites reveal the 1:1 order in small domains (2-9 nm) dispersed in a disordered perovskite matrix. In the 1:1 ordered domains with general formula Pb()O3 the sub-lattice is occupied solely by B” cations, but the one contains a random distribution of B’ and of the remaining B” cations in the ratio 2:1.akbas97 ; yan98 ; xu00 In this description the ordered structure of PMN, for example, can be represented as Pb(Mg2/3Nb1/3)1/2Nb1/2O3.yan98 ; xu00 ; davies00 First-principles-based simulations have shown that the polar nanoregions appear predominantly in chemically ordered regions.burton06 The size of 1:1 ordered domains can be enlarged by suitable doping or sometimes by longer annealing the ceramics. For example, in PMN the ordered domains were enlarged by two orders of magnitude (up to 500 nm) by 30% La doping and simultaneously the permittivity was remarkably reduced to 200 (from 20000 in pure PMN), but a weak dielectric relaxation still remained present.chen89
In closely related PbMg1/3Ta2/3O3 (PMT) ceramics the 1:1 ordering can be achieved by proper high-temperature heat treatment, but the highly ordered samples still contain a large volume of disordered anti-phase boundaries and the 1:1 domains do not coarsen over 10 nm. More pronounced domain growth (up to 40 nm) and up to 95 vol. % ordering has been observed in PMT that contain small admixtures of PbZrO3.akbas97 ; akbas01 ; dmowski02 Nevertheless, in spite of the domain growth, only small influence of the ordering degree on the dielectric relaxation was observed - magnitude and temperature of the maximum permittivity ( and ) slightly reduce with ordering.akbas97 ; akbas01 ; wang05 It therefore appears that the randomness of the ordered structure in the sublattice is the critical factor for appearance of the relaxor ferroelectric behavior which inhibits the normal ferroelectric couplingakbas01 rather than the chemical cluster size.
Numerous publications exist about the dielectric properties of PMT,akbas97 ; akbas01 ; dmowski02 ; wang05 ; bokov61 ; lu96 ; ko03 however, all the measurements were performed only up to 1 MHz and mostly below room temperature. For understanding the relaxation behavior, higher-frequency dielectric spectra at temperatures above room temperature, especially near and above the Burns temperature , are necessary. We will report here about dielectric spectra measurements between 100 Hz and 9 GHz at temperatures up to 490 K and about the dielectric response in the THz and infrared (IR) spectral range (0.1 - 90 THz) for 20 - 900 K. Particularly the THz and IR spectra near are of importance since in several other relaxors we observed that the dielectric relaxation moves from radio-frequency range near up to the THz range near and merges with polar phonons above .kamba05 ; kamba05b ; macutkevic06 ; bovtun06 Moreover, the local ferroelectric instability in the polar clusters was indicated in the IR spectra by an unstable polar optic phonon which partially softens on heating to and hardens above it.wakimoto02b ; kamba05 ; kamba05b ; macutkevic06 ; bovtun06 The question to what extend this behavior is general needs still to be investigated not only near and above , but also below . Simultaneously, it will be of interest to study the influence of the 1:1 order degree on the IR spectra especially above . For this purpose we processed and investigated three types of PMT ceramics of the order from 10 to 90%. It is worth to note that except for the very recent paper on PLZTbuixaderas07 , above no IR reflectivity spectra of relaxors were reported up to now.
II Experimental
To achieve a different degree of the 1:1 order in PMT ceramics we added 5% of PbZrO3 into PMT. Details of the ceramics processing were described in Ref.wang05 . The as-sintered ceramics (at 1230C for 2 hours) have less than 10% order (domain size 3-5 nm) while the ceramics annealed for 1 hour at 1350C exhibit 15% ordering (domain size 3-5 nm) and the 64-hours annealed ceramics show 90% order and ordered domain size of about 150 nm. The phase content in ceramics was monitored by a powder XRD diffractometer Siemens Kristalloflex 805 (Cu K, 40 kV, 35 mA) and conventional TEM (Philips CM300-UT-FE). Details of the order degree determination in PMT ceramics (from the intensity of the (111) superlattice reflections) was published in Ref.wang05
PMT thin film (of 490 nm thickness) was grown on a (0001) oriented sapphire substrate with 40 nm thick SrTiO3 (STO) buffer layer using in situ pulsed laser depositiontyunina04 at the substrate temperature of 650C. The room-temperature x-ray (Cu K ) diffraction studies showed that the film was highly (111) oriented polycrystalline. No indication of B-site order was observed by XRD.
PMT single crystal was grown by the flux method described in Ref. kania06 (kindly provided by A. Kania from the University of Silesia, Katowice, Poland). The crystal size was 5x5x4 mm. The crystal had many cracks inside so that it was difficult to polish it for IR and THz measurements. Due to imperfect surface of the cut crystal plates, the crystal was used just for qualitative comparison with ceramics and thin films.
The low-frequency dielectric properties were measured as a function of temperature in the 100 Hz - 1 MHz frequency range using a high precision LCR meter (HP4284A) and a computer-controlled environmental chamber (Delta 9023). High-frequency response (1 MHz - 1.8 GHz) was obtained by means of the impedance analyzer Agilent 4291B with a Novocontrol BDS 2100 coaxial sample cell and a Sigma System M18 temperature chamber (operating range 100 - 570 K). The TE0n1 composite dielectric resonator methodkrupka06 and network analyzer Agilent E8364B were used for microwave measurements at 8.8 GHz in the 100 - 350 K temperature interval. The cooling rate was 2 K/min.
Measurements at THz frequencies from 7 to 33 cm-1 (0.2 - 1.0 THz) were performed in the transmission mode using a time-domain THz spectrometer based on an amplified Ti - sapphire femtosecond laser system. Two ZnTe crystal plates were used to generate (by optic rectification) and to detect (by electro-optic sampling) the THz pulses. Both the transmitted field amplitude and phase shift were simultaneously measured; this allows us to determine directly the complex dielectric response . An Optistat CF cryostat with mylar windows (Oxford Inst.) was used for measurements down to 20 K.
IR reflectivity and transmission spectra were obtained using a Fourier transform IR spectrometer Bruker IFS 113v in the frequency range of 20 - 3000 cm-1 (0.6 - 90 THz) at room temperature. At lower temperatures the reduced spectral range up to 650 cm-1 only was studied (transparency region of the polyethylene windows in the Optistat CF cryostat). Pyroelectric deuterated triglycine sulfate detectors were used for the room- and high-temperature reflectivity measurements, while more sensitive liquid-He cooled (1.5 K) Si bolometer was used for the low-temperature measurements as well as for high-temperature IR transmission experiment. Polished disk-shaped ceramic samples with a diameter of 8 mm and thickness of 1 mm were used for IR reflectivity studies, while the thin film on sapphire substrate (thickness 05 mm) was investigated in the transmission mode.
III Results and discussions
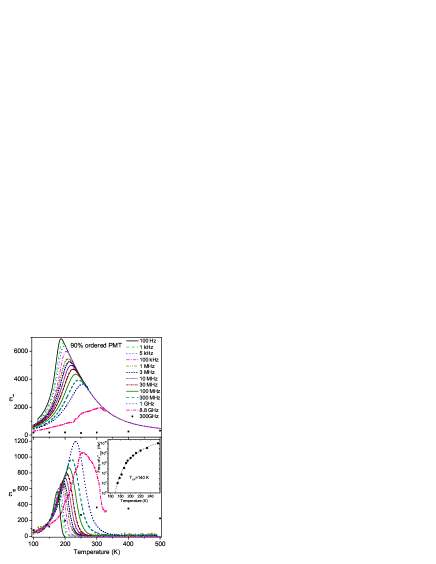
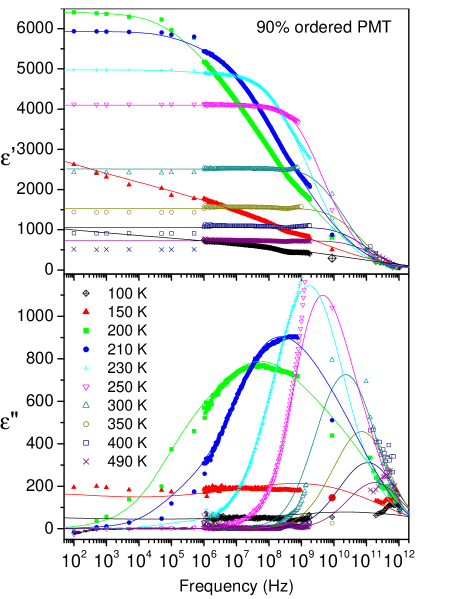
Temperature dependence of the real and imaginary part of complex permittivity for the 90% ordered PMT ceramics at various frequencies is plotted in Fig. 1. Less ordered PMT ceramics exhibit qualitatively similar dielectric anomaly with and shifting to higher values (about 30% and 5% shifts up of and , between PMT ceramics of 90% and 10% order, respectively).wang05 Therefore we do not present here the data of all variously ordered samples. Frequency dependence of the complex permittivity between 100 Hz and 1 THz is plotted in Fig. 2. It shows a broad dielectric relaxation which cannot be fitted with a simple Debye formula. Therefore a more general model of distribution of relaxation times () is used for modeling the complex permittivity. In this case the and are expressed as
| (1a) | |||
| (1b) | |||
with the normalization condition
| (2) |
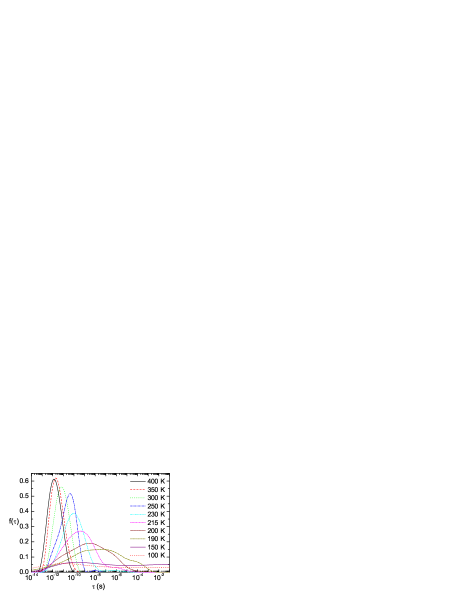

in Eq. 1a marks a sum of phonon and electron contributions into the static permittivity. Solution of the integral equations (Eq. 1) is known as a solution of an ill-posed problem and the most general method for its solution is the Tikhonov regularization tikhonov ; groetsch , which we used for calculation of the distribution function of relaxation times () at different temperatures. The results below 400 K are shown in Fig. 3. The distribution function at higher temperatures was not evaluated since the relaxation moves into the narrow THz range, in the MW range no data are available and almost no dispersion is observed below 1 GHz. Nevertheless, we will show below that the THz relaxation above room temperature merges with the lowest-frequency E symmetry phonon and disappears above .
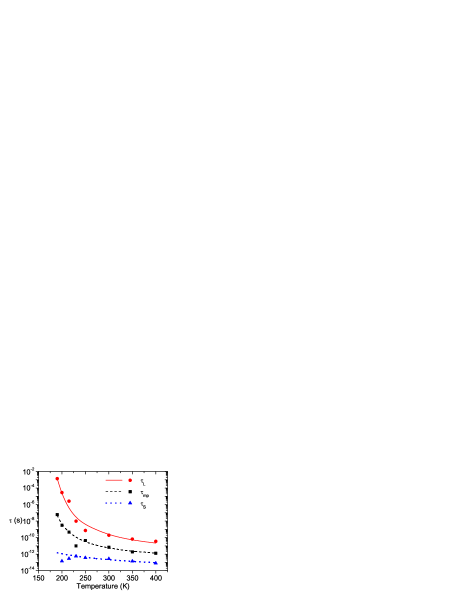
One can see from Fig. 3 that at 400 K only a narrow distribution () appears in the MW range, but on cooling the relaxation slows down and broadens so that it is stretched between kHz and THz range at 200 K. Temperature dependence of the longest (), most probable () and shortest () relaxation times are plotted in Fig. 4 together with their fits. () was fitted to the Arrhenius law
| (3) |
with =7.9 s and =988 K. and follow the Vogel-Fulcher formula
| (4) |
with =1.6 s, =553 K, =146 K and =8.3 s, =809 K and =152 K. One can see that with increasing fitted relaxation time the activation energy and freezing temperature increase. We have fitted as well the frequency of dielectric loss maxima by means of the Vogel-Fulcher formula which yields the freezing temperature =140 K, =1.73.1013 Hz and =875 K (see inset in Fig. 1). It is in reasonable agreement with parameters of previous fits in Fig. 4, but we stress that the relaxation times and have better physical meaning than .
We note that our freezing temperatures in 90% ordered ceramics are slightly (20 K) higher than the published for disordered single crystalko03 . This small difference is not caused by ordering in the B sites since it has an opposite effect; usually decreases with rising ordering.wang05 The higher in the ordered ceramics is presumably caused by the 5% admixture of PbZrO3 in PMT, as also observed in Refs.akbas97 ; akbas01
Note the splitting of the relaxation times distribution function at 230 K, better seen at 215 K (Fig 3). Similar splitting was observed also in other relaxorsmacutkevic06 ; bovtun06 . Long-time relaxation was assigned to flipping and short-time part of to breathing of polar clusters. The former part disappears from the spectra below freezing temperature, while the latter part anomalously broadens on cooling. Frequency independent (i.e. almost uniform ()) spectra are seen below 150 K giving evidence about anomalously broad distribution of relaxation frequencies at low temperatures. This behavior appears to be general since it was observed in all lead-based perovskite relaxor ferroelectrics so far investigated in a sufficiently broad frequency and temperature range.petzelt07 This effect can be understood from the broad distribution of activation energies for hopping of the Pb cations in random fields and bonds of chemically disordered cations with two different valences in the perovskite B sites.rychetsky03
The relaxation (i.e. central peak) was revealed also in the inelastic neutron scattering (INS) spectra.gvasalia03a ; gvasalia04a Its temperature behavior was not investigated, but the neutron scattering experiment showed that the diffuse scattering intensity and the amplitude of the lead displacements exhibit similar temperature dependences.gvasalia04b
We investigated also the higher frequency region above 100 GHz by means of THz and IR spectroscopy at temperatures from 20 up to 900 K. The IR reflectivity above 1000 exhibits almost no frequency dispersion, therefore the IR spectra in Fig. 5 are plotted only up to 1000 (30 THz). The rich phonon structure was observed only below 700. We measured the IR reflectivity of the single crystal as well as of variously ordered PMT ceramics and the comparison of 30 K spectra in inset of Fig. 5 shows that there is appreciably no difference between the polar phonon structure of variously ordered ceramics. Phonon frequencies are also the same for the (B-site disordered) single crystal, only the mode strengths are slightly different.
In order to obtain all polar phonon parameters as a function of temperature, IR and THz spectra were fitted simultaneously using the generalized-oscillator model with the factorized form of the complex permittivity:gervais83
| (5) |
where and denotes the transverse and longitudinal frequency of the j-th polar phonon, respectively, and TOj and LOj denotes their corresponding damping constants. ∗() is related to the reflectivity R() by
| (6) |
The high-frequency permittivity resulting from the electronic absorption processes was obtained from the room-temperature frequency-independent reflectivity tails above the phonon frequencies (i.e. above 1000) and was assumed to be temperature independent.
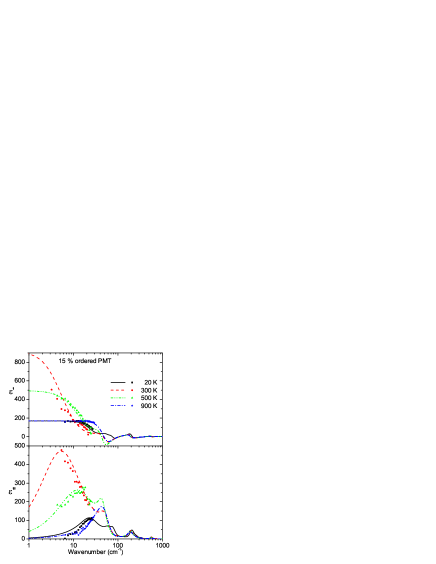
The real and imaginary parts of () obtained from the fits to IR and THz spectra (including the THz experimental points) are shown in Fig. 6. Parameters of the fits performed at 20, 300 and 900 K are summarized in Table I. We resolved 15 polar modes in the IR spectra at 20 K, 11 at 300 K and 8 modes at 900 K.
| 20 K | 300 K | 900 K | |||||||||||||
|---|---|---|---|---|---|---|---|---|---|---|---|---|---|---|---|
| No | |||||||||||||||
| 1 | 25.5 | 30.8 | 41.8 | 42.4 | 115.2 | 15.4 | 49.3 | 38.6 | 42.9 | 835.6 | |||||
| 2 | 61.0 | 17.6 | 62.4 | 16.8 | 3.4 | ||||||||||
| 3 | 79.8 | 36.4 | 107.3 | 29.2 | 24.6 | 52.4 | 31.9 | 106.9 | 39.0 | 60.2 | 52.3 | 43.4 | 104.6 | 34.7 | 136.9 |
| 4 | 136.3 | 96.6 | 145.1 | 56.3 | 3.4 | 143.7 | 138.3 | 146.1 | 88.6 | 1.1 | 146.5 | 235.4 | 148.4 | 112.6 | 1.5 |
| 5 | 203.3 | 59.3 | 261.8 | 60.9 | 15.7 | 192.3 | 64.8 | 248.6 | 40.8 | 18.8 | 185.4 | 65.3 | 309.0 | 50.8 | 24.8 |
| 6 | 267.6 | 52.8 | 329.8 | 62.0 | 0.87 | 250.0 | 41.4 | 273.6 | 50.0 | 0.30 | |||||
| 7 | 283.0 | 10.5 | 329.6 | 61.1 | 0.01 | 274.7 | 47.1 | 329.8 | 56.1 | 0.14 | |||||
| 8 | 343.3 | 48.7 | 373.8 | 70.5 | 0.44 | 339.4 | 26.8 | 341.6 | 30.0 | 0.19 | 312.1 | 53.7 | 411.3 | 31.3 | 0.23 |
| 9 | 386.3 | 30.3 | 388.5 | 27.4 | 0.06 | 344.3 | 57.8 | 412.1 | 20.6 | 0.32 | |||||
| 10 | 400.9 | 76.0 | 409.2 | 11.9 | 0.43 | ||||||||||
| 11 | 411.8 | 48.4 | 433.0 | 23.5 | 0.15 | ||||||||||
| 12 | 434.8 | 26.2 | 458.8 | 27.8 | 0.03 | 424.9 | 39.7 | 451.5 | 37.3 | 0.11 | 426.1 | 47.2 | 445.2 | 46.5 | 0.10 |
| 13 | 515.6 | 56.6 | 522.0 | 55.4 | 0.18 | ||||||||||
| 14 | 559.6 | 56.0 | 700.0 | 77.0 | 1.04 | 560.5 | 65.0 | 642.9 | 117.8 | 1.07 | 535.9 | 112.0 | 646.5 | 104.6 | 1.19 |
| 15 | ? | ? | ? | ? | ? | 649.3 | 85.9 | 700.0 | 77.4 | 0.04 | 648.4 | 90.4 | 690.5 | 79.0 | 0.01 |
Let us compare the number of observed polar modes with the prediction of the factor group analysis (see Table II). We remind that the structural study of PMT down to 1.5 K showed no macroscopic phase transition, the structure remaining cubic at all temperatures.gvasalia04b Simple cubic perovskites of space group have 3 IR-active polar modes, but PMT has two kinds of B-site cations which are 1:1 short range ordered,akbas97 therefore the local space group is rather with 4 IR-active phonons.hlinka06 This is, however, appreciably less than the observed number of polar phonons in Table I. Since the IR spectra are sensitive to local symmetry already in the range of a few unit cells and because of the presence of polar nanoclusters in the lattice, the IR selection rules should allow more modes below . If we assume that the local symmetry of the polar nanoclusters is rhombohedral with 2 formula units per unit cell (like in PMN-PT), then 16 modes are simultaneously active in the IR and Raman spectra below (see Table II). We have observed 15 modes at 20 K, which reasonably agrees with the expectation. The fact that only 11 modes are seen at 300 K, can be explained by higher damping of the modes at RT, which may cause overlapping of some modes.
The situation at high temperatures requires additional discussion. No polar clusters are expected above so that only 4 IR modes are permitted for the space group , but we resolved 8 polar modes in the IR spectra up to 900 K. Factor group analysis for the structure assumes 1:1 chemical ordering in the B siteshlinka06 in small chemical clusters (3-150 nm in PMT)akbas01 ; wang05 , while the rest of the sample volume (e.g. 90% in the 10% ordered sample) remains chemically disordered, i.e. the Mg2+ and Ta5+ cations are randomly dispersed over both and sites. This could have some influence on the IR selection rules. Moreover, even in the chemically ordered nanoregions the sublattice is not occupied by one cation, but it is randomly occupied by Ta and Mg cations in the 1:2 ratio. It is natural to expect that all lattice vibrations where the B cations are involved, could be split due to the chemical inhomogeneity in the sublattice. The reason for the mode splitting in chemically disordered solids is discussed in detail in the review by Barker and Sievers.barker75 We may expect that the modes involving Pb vibration (1+1) do not split, while the rest of the modes (including oxygen vibrations against and ) from the second column in Table II split into doublets. The new factor group analysis of Pb()O3 above , where =Ta and =Ta1/3Mg2/3 is shown in Table II. This analysis predicts 8 IR modes in full agreement with the results in Table I: The TO2, TO3 (200-400) and TO4 modes (500-700) are split because these so called Slater and Axe modeshlinka06 involve the B-cation vibrations. On the other hand, the TO1 mode near 90 (so called Last mode) is not split above , because it involves mostly translation of Pb cations against the O octahedra.
Let us mention the result of the INS experiment on PMN single crystal by Vakhrushev and Shapiro.vakhrushev02 They observed splitting of the TO1 mode also far above and explained it by a two mode behavior due to the chemical disorder. However, their results were not confirmed by other groups performing INS experiments on relaxors.
Our PMT ceramics contain 5% of Zr and the structural studies have shown,dmowski02 ; cantoni04 that the sublattice is occupied only by Ta cations, while all Mg, Zr and rest of Ta cations occupy the sublattice. Heterogeneous occupation of the sublattice with three cations of strongly different mass could cause even more complicated splitting of the modes than that observed (see Table II).
| ABO3 | A(B’1/2B”1/2)O3 | A()O3 | A(B’1/2B”1/2)O3 |
| Z=1 | Z=2 | Z=2 | Z=2 |
| 3(IR) | 3(IR) | 6(IR) | 3(IR,R) |
| 3(IR,R) | |||
| 1(-) | 1(-) | 2(-) | 1(-) |
| 1(IR,R) | |||
| progenitors | 1(IR) | 2(IR) | 1(IR,R) |
| are q0 | 1(IR,R) | ||
| modes | 1(R) | 2(R) | 1(IR,R) |
| 1(R) | 2(R) | 1(IR,R) | |
| 2(R) | 3(R) | 2(IR,R) | |
| 2(IR,R) | |||
| 1(-) | 2(-) | 1(-) | |
| 1(-) | 2(-) | 1(-) | |
| 1(IR,R) | |||
| 3+11 | ++ | 2+2+2 | 7+2+9 |
| 4+2+ | 8+3+2 | ||
| 3 IR + O R | 4 IR + 4 R | 8 IR + 7 R | 16(IR+R) |
PMT is isostructural with PMN, therefore IR spectra are expected similar for both compounds. However, only 8 modes were resolved in the PMN spectra at RT and 20 K and also the characteristic deep minimum seen in PMT near 300 was not resolved in the PMN spectra.prosandeev04 ; hlinka06b The difference may be understood by a larger chemical disorder and higher anharmonicity of Nb vibrations in PMN, which causes a larger effective phonon damping and therefore possible overlapping of modes. Remarkable influence of the B-site ordering on the phonon damping was observed also in PbSc1/2Ta1/2O3 (PST).kamba05b Nevertheless, it is worth to note that our preliminary high-temperature IR reflectivity spectra of PMN as well as recently published IR spectra of PLZTbuixaderas07 obtained above , reveal 6 polar modes, which also cannot be explained assuming the simple ordering. Similar explanation as presented here for PMT, may be, therefore, considered.
An interesting temperature dependence of the mode frequencies was observed below 100 (see Fig. 7). Far-IR (FIR) spectra are less accurate, because FIR spectral range is experimentally difficult attainable. Therefore we investigated both FIR reflectivity of ceramics and FIR transmission spectra of thin films (sapphire substrate is transparent only in the FIR range).
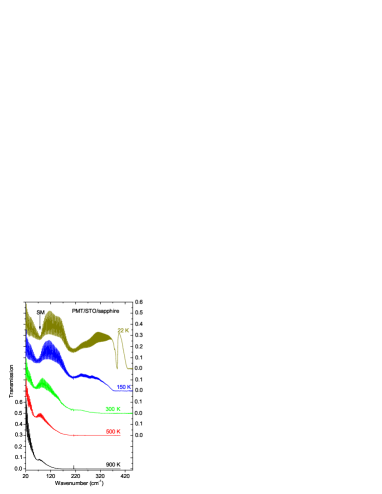
FIR transmission spectra of PMT thin film were measured at 20 - 900 K and shown at selected temperatures in Fig. 8. Dense and large-amplitude oscillations in the spectra are due to the multi-pass interferences in the substrate, while the broad minima correspond to the frequencies of polar modes in the PMT film. The transmission decreases on heating mainly due to the increase in the absorption of the sapphire substrate.
The spectra of a bare sapphire substrate, STO buffer thin film on sapphire and the PMT film on the substrate with STO buffer layer were determined independently for each temperature studied. Temperature dependence of the IR transmission spectra of sapphire substrate was published in Ref.kamba05 , the spectra of STO buffer layer will be discussed elsewhere.nuzhnyy For a given temperature, the transmission spectrum of the sapphire substrate was fitted with a sum of classical damped oscillator model for the dielectric function (using the Fresnel formulae for coherent transmission of a plane-parallel sample, i.e. taking into account the interference effectsBorn )
| (7) |
where means the contribution of the j-th mode to the static permittivity. The rest of the parameters in Eq. 7 has the same meaning as in Eq. 5.
The resulting parameters of the phonons in sapphire substrate were used for the fit of the STO/sapphire and PMT/STO/sapphire two- and three-layer systems, respectively. The complex transmittance was computed by the transfer matrix formalism method including interference effects.Heavens
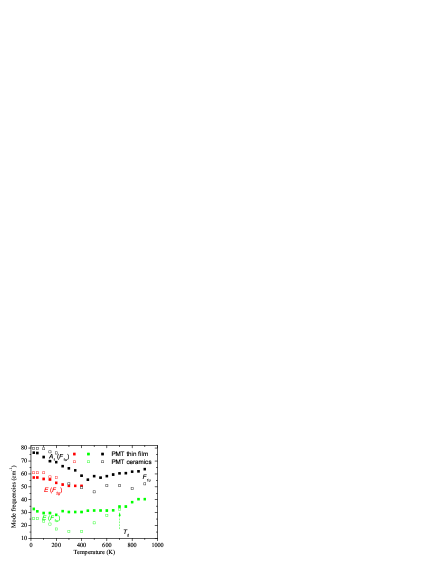
Let us compare the temperature dependence of the low-frequency polar modes obtained from the IR reflectivity and THz transmission spectra of ceramics with the modes calculated from the IR transmission spectra of the thin film (see Fig. 7). In ceramics one can see (follow the open points) an unsplit TO1 mode above 700 K. The mode splits into two components below confirming the appearance of polar clusters with lower local symmetry. The higher frequency TO1 component (of symmetry) slightly softens on cooling to 500 K, but on further cooling it pronouncedly hardens, indicating that we see the local ferroelectric soft mode inside the polar clusters.
The second () component of the TO1 mode exhibits softening below and hardening below 300 K. A new mode appears near 58 below 200K. This mode stems from the Raman active modelushnikov04 of symmetry above and it has symmetry at low temperatures. It becomes resolved at low temperatures due to the breaking of local symmetry as well as due to the lower phonon damping of both TO1 components. Similar temperature behavior of all three phonons was observed in PMN, PST, PLZT and also in other relaxor solid solutionskamba05 ; kamba05b ; macutkevic06 ; buixaderas07 and it seems that it is a general behavior in all lead-based perovskite relaxors.
Let us mention that we observed no overdamping of TO1 phonon below frequently seen in INS spectra of other relaxors, which is called phonon ”waterfall effect”.hirota06 TO1 phonon is underdamped at all temperatures indicating that the ”waterfall effect” in the INS spectra is just an apparent effect due to a coupling of heavily damped soft optic mode with some other excitation, e.g. acoustic phonon branches.hlinka03
Gvasaliya gvasalia03b observed in INS spectra (but did not explain) a remarkable change of the vibrational state density in the range of 50–80 on cooling from 300 to 50 K. This change could be connected with the hardening of the optic modes on cooling seen in Fig. 7.
IR transmission spectra of the thin film yield slightly different mode frequencies (see solid dots in Fig. 7) and moreover, the TO1 mode is split at all temperatures up to 900 K. Different mode frequencies as well as different temperatures of the TO1 splitting in ceramics and thin films can be caused by the strain which induces anisotropy in the film. Nevertheless, we observed that the film is rather relaxed, strain is smaller than 0.1%, therefore the strain effect on the phonon spectra should be small. The film is mostly (111) oriented and along the same direction is oriented also the spontaneous polarization in rhombohedral phase of PMT. If we assume that the local symmetry in polar clusters is also rhombohedral and that the modes are IR active for polarization of IR radiation perpendicular to (111), i.e. in the plane of the thin films, than it is clear that the intensity of modes should be enhanced in IR spectra of our thin film. This is probably reason, why the modes are better resolved in high temperature IR spectra of the film, while their intensity remarkably weaken in reflectivity spectra of ceramics on heating.
We note that the accuracy of the phonon frequency determination is different in various experimental techniques used. IR reflectivity of ceramics above 50 is less accurate than the FIR transmission spectra of thin films. Therefore the mode frequencies above 50 in thin film are determined more accurately. This is probably also the reason why the () mode is resolved in IR transmission spectra already at 400 K, i.e. by 200 K higher than in the less sensitive IR reflectivity spectra. On other hand, the THz transmission spectra of the ceramics below 30 are more accurate than the FIR transmission spectra of the thin films, therefore we believe more to the lowest frequency mode obtained from the THz spectra of ceramic samples (especially below 400 K). Simultaneously it is probable that the mode is stiffened in the thin film due to small strain, as frequently observed e.g. in STO thin films.petzelt07
Second reason for different frequency of the mode in ceramics and thin films can be also different strength of relaxation mode in ceramics and films. The relaxation mode expresses the dynamics of polar clusters, i.e. their flipping and breathing. It appears in THz dielectric spectra below together with the mode and both modes are overlapped because they have similar frequencies. The relaxation mode slows down to microwave and broadens on cooling. It is partly seen in the THz dielectric spectra in Figs. 2 and 6 and it is manifested by the highest permittivity and losses near 1 THz close below (not shown in the figures). Below 150 K the relaxation does not contribute to the THz spectra anymore so that the symmetry phonon mode is well resolved at low temperatures (e.g. at 20 K spectra in Fig. 6). Permittivity in the film is lower than in the ceramics. It means that the dielectric strength of the relaxation is higher in ceramics than in the film and the relaxation frequency is lower in the ceramics than in the film. THz and IR spectra were fit below 40 with one effective mode, but because of different relaxation frequency also the peak in seen as mode in Fig. 7 can be different in both kinds of PMT samples.
Nevertheless, it seems that the Burns temperature (i.e. splitting temperature of the TO1 mode) is different in ceramics ( 900 K) and in the thin PMT film (above 900 K). In disordered PMT single crystals, other authorsko03 ; korshunov92 found close below 600 K. The low-frequency dielectric studies of PMT ceramics show even only 430 K (estimated from the linear fit of 1/), which was independent of the degree of chemical order.wang05 Nevertheless, note that these dielectric measurements were performed only below 500 K, i.e far below the expected . Therefore we claim that different values of published by various authors can be caused both by different sensitivity of various experimental techniques as well as by different degree of chemical order. Further experiments are necessary for distinguishing, which factor is more important.
IV Conclusion
Broad-band dielectric spectra from 100 Hz to 90 THz revealed a dielectric relaxation which appears below the Burns temperature close to the soft phonon mode frequency near 1 THz. The relaxation expresses dynamics of polar clusters and it slows down on cooling from the THz region through MW and radio-frequency region and simultaneously broadens anomalously giving rise to frequency independent losses at low temperatures. The relaxation frequency is only slightly influenced by the degree of chemical order in the perovskite B sites. In ceramic samples the TO1 phonon shows splitting below due to the local breaking of the cubic symmetry in polar clusters. In the thin film the TO1 phonon is split at all investigated temperatures below 900 K. Both and components of the TO1 mode remarkably harden below 300-400 K indicating their assignment to ferroelectric soft modes inside the polar clusters. Twice higher number of polar modes than expected from the factor group analysis for the cubic structure was observed above . This discrepancy was accounted for by the chemical disorder in the perovskite B sites. On the other hand, we have shown that the degree of chemical order has insignificant influence on the phonon frequencies. Slightly different phonon frequencies in chemically disordered PMT thin film (in comparison to ceramics) can be explained by different relaxation frequency which overlaps the mode as well as by different spectral techniques used in the study of the thin film and bulk samples.
Finally we conclude that the observed behavior of the dielectric relaxation as well as of the soft phonons appears the same for all lead-based relaxor ferroelectrics with the perovskite structure so far studied.
Acknowledgements.
The work was supported by the Grant Agency of the Czech Republic (Project No. 202/06/0403), AVOZ10100520 and Ministery of Education (OC101-COST539). We are grateful to A. Kania for providing us with the PMT single crystal.References
- (1) G.A. Smolenskii and A.I.Agranovskaya, Soviet Phys. - Tech. Phys. 3, 1380 (1958).
- (2) S.-E. Park and T.S. Shrout, J. Appl. Phys. 82, 1804 (1997).
- (3) D. Viehland, M. Wuttig, and L.E. Cross, Ferroelectrics 120, 71 (1991).
- (4) G. Burns and F. H. Dacol, Solid State Commun. 48, 853 (1983); Phys. Rev. B 28, 2527 (1983).
- (5) V. Westphal, W. Kleemann, and M.D. Glinchuk, Phys. Rev. Lett. 68, 847 (1992).
- (6) M.A. Akbas and P.K. Davies, J. Am. Ceram. Soc. 80, 2933 (1997).
- (7) Y. Yan, S.J. Pennycook, Z. Xu and D. Viehland, Appl. Phys. Lett. 72, 3145 (1998).
- (8) Z. Xu, S.M. Gupta, D. Viehland, Y. Yan, and S.J. Pennycook, J. Am. Ceram. Soc. 83, 181 (2000).
- (9) P.K. Davies and M.A. Akbas, J. Phys. Chem. Sol. 61, 159 (2000).
- (10) B.P. Burton, E. Cockayne, S. Tinte, and U.V. Waghmare, 79, 91 (2006) and references therein.
- (11) J. Chen, H.M. Chan, and M.P. Harmer, J. Am. Ceram. Soc. 72, 593 (1989).
- (12) M.A. Akbas and P.K. Davies, Int. J. Inorg. Mat. 3, 123 (2001).
- (13) W. Dmowski, M.K. Akbas, T. Egami, and P.K. Davies, J. Phys. Chem. Sol. 63, 15 (2002).
- (14) Y.L. Wang, S.S.N. Bharadwaja, A.K. Tagantsev, and N. Setter, J. Eur. Ceram. Soc. 25, 2521 (2005).
- (15) V.A. Bokov and I.E. Myln’ikova, Sov. Phys. Solid State 2, 2428 (1961).
- (16) Z.G. Lu, C. Flicoteaux, and G. Calvarin, Mat. Res. Bull. 31, 445 (1996).
- (17) J.-H. Ko, S. Kojima, S.G. Lushnikov, Appl. Phys. Lett. 82, 4128 (2003).
- (18) S. Kamba, M. Kempa, V. Bovtun, J. Petzelt, K. Brinkman, and N. Setter, J. Phys.: Condens. Matter 17 3965 (2005).
- (19) S. Kamba, M. Berta, M. Kempa, J. Hlinka, J. Petzelt, K. Brinkman, and N. Setter, J. Appl. Phys. 98 074103(2005).
- (20) J. Macutkevic, S. Kamba, J. Banys, A. Brilingas, A. Pashkin, J. Petzelt, K. Bormanis, and A. Sternberg, Phys. Rev. B 74, 104106 (2006).
- (21) V. Bovtun, S. Veljko, S. Kamba, J. Petzelt, S. Varkhrushev, Y. Yakymenko, K. Brinkman, and N. Setter, J. Eur. Ceram. Soc. 26, 2867 (2006).
- (22) S. Wakimoto, C. Stock, Z.-G. Ye, W. Chen, P. M. Gehring, and G. Shirane, Phys. Rev. B 66, 224102 (2002).
- (23) E. Buixaderas, D. Nuzhnyy, S. Veljko, S. Kamba, M. Savinov, J. Petzelt, and M. Kosec, J. Appl. Phys. 101, 074106 (2007).
- (24) J. Levoska, M. Tyunina, A. Sternberg, S. Leppävuori, Ferroelectrics 271, 137 (2002) ; M. Tyunina, J. Levoska, A. Sternberg, S. Leppävuori, J. Appl. Phys. 86, 5179 (1999); M. Tyunina and J. Levoska, J. Appl. Phys. 97, 114107 (2005).
- (25) A. Kania, A. Slodczyk, and Z. Ujma, J. Cryst. Growth 289, 134 (2006).
- (26) J. Krupka, T. Zychowicz, V. Bovtun, S. Veljko, IEEE Trans. UFFC 53, 1883 (2006).
- (27) A.N. Tikhonov and V. Y. Arsenin, Solution of ill-possed problems (J. Wiley, New York, 1977).
- (28) C. W. Groetsch, The theory of Tikhonov regularization for Fredholm equation (Pitman, London, 1984).
- (29) J. Petzelt, S. Kamba, J. Hlinka, in New developments in advanced functional ceramics, p. 387-421, ed. L. Mitoseriu, Transworld Research Network, Trivandrum, India 2007 or ArXiv: cond-mat/0611016.
- (30) I. Rychetsky, S. Kamba, V. Porokhonskyy, A. Pashkin, M. Savinov, V. Bovtun, J. Petzelt, M. Kosec and M. Dressel, J. Phys.: Condens. Matter 15, 6017 (2003).
- (31) S.N. Gvasaliya, B. Roessli, and S.G. Lushnikov, Europhysics Letters 63, 303 (2003).
- (32) S.N. Gvasaliya, S.G. Lushnikov, and B. Roessli, Crystallogr. Rep. 49, 115 (2004).
- (33) S.N. Gvasaliya, B. Roessli, D. Sheptyakov, S.G. Lushnikov, T.A. Shaplygina, Eur. Phys. J. B 40, 235 (2004).
- (34) F. Gervais, in Infrared and Millimeter Waves, vol. 8, ed. K. J. Button (New York: Academic) chapter 7, p. 279.
- (35) J. Hlinka, J. Petzelt, S. Kamba, D. Noujni, T. Ostapchuk, Phase Transitions, 79, 41 (2006) and references therein.
- (36) A.S. Barker and A.J. Sievers, Rev. Mod. Phys. 47, S1-S179 (1975).
- (37) S.B. Vakhrushev and S.M. Shapiro, Phys. Rev. B 66, 214101 (2002).
- (38) M. Cantoni, S. Bharadwaja, S. Gentil, and N. Setter, J. Appl. Phys. 96, 3870 (2004)
- (39) S. A. Prosandeev, E. Cockayne, B. P. Burton, S. Kamba, J. Petzelt, Yu. Yuzyuk, R. S. Katiyar, and S. B. Vakhrushev, Phys. Rev. B 70, 134110, (2004).
- (40) J. Hlinka, T. Ostapchuk, D. Noujni, S. Kamba, and J. Petzelt, Phys. Rev. Lett. 96, 027601 (2006).
- (41) D. Nuzhnyy, J. Petzelt, S. Kamba, T. Yamada, M. Tyunina, A.K. Tagantsev, J. Levoska, N. Setter, subm. to Integr. Ferroelectrics.
- (42) M. Born and E. Wolf, Principles of Optics, Oxford, Pergamon, 1960.
- (43) O. S. Heavens, Rep. Prog. Phys. 22, 1 (1960).
- (44) S. Lushnikov, S. Gvasaliya, and R.S. Katiyar, Phys. Rev. B 70, 172101 (2004).
- (45) K. Hirota, S. Wakimoto, and D.E. Cox, J. Phys. Soc. Jpn. 75, 111006 (2006) and references therein.
- (46) J. Hlinka, S. Kamba, J. Petzelt, J. Kulda, C.A. Randall and S.J. Zhang, Phys. Rev. Lett. 91, 107602 (2003).
- (47) S.N. Gvasaliya, S.G. Lushnikov, I.L. Sasshin, and T.A. Shaplygina, J. Appl. Phys. 94, 1130 (2003).
- (48) O.Yu. Korshunov, P.A. Markovin, and R.V. Pisarev, Ferroelectrics Letters, 13, 137 (1992).