Variable X-ray Absorption toward Gravitationally-Lensed Blazar PKS 1830211
Abstract
We present X-ray spectral analysis of five Chandra and XMM-Newton observations of the gravitationally-lensed blazar PKS 1830211 from 2000 to 2004. We show that the X-ray absorption toward PKS 1830211 is variable, and the variable absorption is most likely to be intrinsic with amplitudes of – depending on whether or not the absorber is partially covering the X-ray source. Our results confirm the variable absorption observed previously, although interpreted differently, in a sequence of ASCA observations. This large variation in the absorption column density can be interpreted as outflows from the central engine in the polar direction, consistent with recent numerical models of inflow/outflows in AGNs. In addition, it could possibly be caused by the interaction between the blazar jet and its environment, or the variation from the geometric configuration of the jet. While the spectra can also be fitted with a variable absorption at the lens redshift, we show that this model is unlikely. We also rule out the simple microlensing interpretation of variability which was previously suggested.
1 Introduction
PKS 1830211 (Pramesh Rao & Subrahmanyan, 1988; Subrahmanyan et al., 1990; Jauncey et al., 1991) consists of two (Lidman et al., 1999) blazar images separated by 1′′ and lensed by a (Wiklind & Combes, 1996; Gerin et al., 1997) spiral galaxy (Winn et al., 2002). PKS 1830211 was observed in the radio (e.g., Pramesh Rao & Subrahmanyan, 1988; Lovell et al., 1998), infrared (e.g., Lidman et al., 1999; Courbin et al., 2002; Winn et al., 2002), X-rays (Mathur & Nair, 1997; Oshima et al., 2001; de Rosa et al., 2005; Dai et al., 2006), and Gamma-rays (Mattox et al., 1997), and the spectral energy distribution of PKS 1830211 (de Rosa et al., 2005) shows two emission bumps with one in the infrared and the other between the hard X-ray and Gamma-ray bands.
The gravitational lens PKS 1830211 is complicated in many aspects, and one of them is the X-ray absorption. The X-ray absorption was first detected by ROSAT (Mathur & Nair, 1997). Later ASCA observations (Oshima et al., 2001) show that the X-ray absorption is variable; these authors favored a model in which microlensing was the cause of variability. Recently, PKS 1830211 was observed by Chandra and XMM-Newton for five epochs, which enabled us to study the nature of the X-ray absorption in detail combining the angular resolution of Chandra and the large collecting area of XMM-Newton. Since the two images are resolved by Chandra, we can test the microlensing model predictions and study the X-ray absorption separately for the two lensed images. Dai et al. (2006) found that the differential absorption at the lens galaxy between the two images is cm-2. In this paper, we study the time evolution of the absorption in the system from the five Chandra and XMM-Newton observations and confirm that the X-ray absorption toward PKS 1830211 is variable. Moreover, we rule out the microlensing interpretation of the observed variability.
2 Observations and Data Reduction
We observed PKS 1830211 twice with Chandra and three times with XMM-Newton from 2000 to 2004. The details of the observations are listed in
Table 1. The Chandra data were reduced with the
CIAO3.2 software tools provided by the Chandra X-ray Center (CXC)
following the standard threads on the CXC website.111The CXC
website is at http://cxc.harvard.edu/. Only events with standard
ASCA grades of 0, 2, 3, 4, and 6 were used in the analysis. We
improved the image quality of the data by removing the pixel
randomization applied to the event positions by the standard pipeline.
In addition, we applied a sub-pixel resolution technique (Tsunemi et al., 2001; Mori et al., 2001)
to the events on the S3 chip of ACIS where the quasar images are
located. This allowed us to resolve the two lensed images of the
blazar. The XMM-Newton data were reduced using the standard analysis software
SAS6.0. We used the tasks epchain and emchain from
SAS to reduce the PN and MOS data, and filtered the events with
patterns and for the PN and MOS chips, respectively.
3 Spectral Analysis
We fitted the spectra of PKS 1830211 using XSPEC V11.3.1
(Arnaud, 1996) in the 0.35–8 keV observed energy range for Chandra spectra and in the 0.35–10 keV range for XMM-Newton spectra. In all of our
models, we fixed the Galactic absorption at cm-2 (Dickey & Lockman, 1990).
3.1 Chandra Spectra of Individual Images
We analyzed the Chandra spectra of individual images A and B. We modeled the spectra with a power law modified by the Galactic absorption and the absorption at the lens redshift; the fitting results are listed in Table 2. We experimented with two models where the power law photon indices for the two images were allowed to be different (Model 1) and where they were constrained to be the same (Model 2). We assumed that the excess absorption (above Galactic) arises in the lens galaxy at z=0.886 (we test this assumption later). In both the models, the column densities at the two Chandra epochs for image B are consistently larger than those of image A. In addition, the absorption in the first epoch is consistently larger than that in the second epoch for both images, except for image B in Model 1 where it is similar within errors. The photon indices obtained from Model 1 fits are similar for the two images and in both epochs, partially due to the large error bars on the parameter caused by the low signal-to-noise ratio of the individual spectra. The photon indices obtained from Model 2 show difference from epoch to epoch, which again is not significant. The difference between the absorption in the two images occurs simply because the lines of sight of the two images intersect different parts of the lens galaxy (Dai et al., 2006). The difference between the absorption at the two epochs indicates that the X-ray absorption is variable. The origin of the absorption variability could be either at the lens redshift or at the source redshift. We note that the differential absorption between images B and A is similar in the two epochs, especially in Model 2. This is suggestive of absorption variability occurring at the source redshift.
3.2 Chandra and XMM-Newton Spectra of Combined Images
We then analyzed the spectra of the combined images AB for the Chandra and XMM-Newton observations. We first fitted the spectra of PKS 1830211 of the five epochs with a power-law model modified by neutral absorption from the Milky Way and the lens galaxy. The fitting results are listed in Table 3 (Model 3). We note that the absorption at the lens redshift for this model should be treated as an averaged absorption for the two lines of sight. We also fitted the co-added three XMM-Newton spectra to obtain a higher signal-to-noise ratio spectrum, and the results are also listed in Table 3. The higher S/N of XMM-Newton spectra allows better constraints on the power-law spectral index. We find that the spectral index varies between the Chandra and the XMM-Newton observations, though variations within the Chandra epochs and XMM-Newton epochs are smaller. Comparing the fitting results of Model 3 and Model 2, the spectral index obtained by fitting the combined images AB for the Chandra observations are consistent with results from individual spectral fits in § 3.1. The absorption at the lens is also variable, especially when comparing the second Chandra observation with other epochs. We further test the variability of the spectra by comparing a model with no spectral variability (with the exception of normalization) and another model with variable absorption and spectral index. We found that the model with the spectral variability produced a better fit with a improvement of 56.1 (a null probability of by the F-test) when jointly fitting the five X-ray observations. When we only consider the three XMM-Newton observations, the corresponding improvement is 14.5 with a null probability of 0.0097 given by the F-test. The largest absorption variation is between the second Chandra epoch and the first XMM-Newton epoch. Although the variable spectral index in blazars is common (e.g., Foschini et al., 2006), the absorption at the lens galaxy is unlikely to vary on the time scales of years. As discussed in § 3.1, it is more likely that the variable absorption component is at the source redshift close to the AGN, where a short time-scale variability is possible and may be expected.
The next model we tried is a power-law modified by three absorption components, the Galactic absorption and the absorptions at the lens and the source. We fixed the absorption at the lens as cm-2, the smallest absorption column density detected in the five epochs from the previous model. This is the largest absorption column density at lens we can set to ensure no absorption variability at the lens galaxy. The fitting results are listed in Table 3 (Model 4). Again we detected variability of both the photon index and the absorption at the source redshift. Using the same test that we described in the previous model, we found that the model allowing spectral variability improved the by 59.8 with a null probability of for jointly fitting the five X-ray observations, and an improvement of 14.7 with a null probability of 0.01 for jointly fitting the three XMM-Newton observations. The largest absorption variation for this model is between the second Chandra epoch and the first XMM-Newton epoch. The variable absorption in this model can be naturally associated with outflows from the central engine. Although, this model produces comparable fits for the two Chandra spectra compared with Model 3, where there is no absorption at the source redshift, the fits for the XMM-Newton spectra with a higher S/N are worse than Model 3 with increases of 5.8, 37.2, 13.0 for the three XMM-Newton spectra. We also tested whether fitting the absorption component at the source with a warm absorber or a partially covering absorber would improve the fit. While the warm absorber model produces a worse fit, the partial covering model (Table 3, Model 5) produces comparable fits to Model 3. For the partial covering model, the model allowing spectral variability produces improvement of the by 79.7 with a null probability of for jointly fitting the five X-ray observations, and an improvement of 14.1 with a null probability of 0.01 for jointly fitting the three XMM-Newton observations. The largest absorption variation for this model is , again, between the second Chandra epoch and the first XMM-Newton epoch.
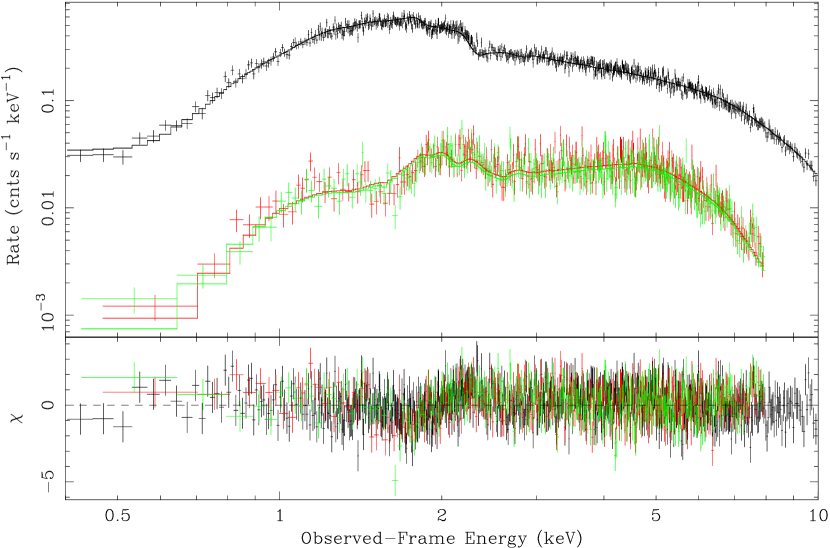
As a final improvement to our model, we assume that the lines of sight of the two lensed images pass through different locations in the lens galaxy and thus have different absorption column densities. This differential absorption is measured as cm-2 (Dai et al., 2006). Therefore, we have a model composed of two power-law components and each of them is modified by three absorptions from Galactic, lens, and source. The two power-law components representing the two lensed images have the same photon index but different normalizations. The normalization ratio between images A and B is constrained as by taking the hard X-ray flux ratios (3–8 keV) from the Chandra observation. The Galactic absorption and the absorption at the source are the same for the two power-law components, and the absorbers at the source are assumed to be partially covering the continuum. The absorber column densities at the lens are different for the two power-law components by the amount given by Dai et al. (2006). We fit the two Chandra spectra and the co-added XMM-Newton spectrum simultaneously with this model. We constrained that the absorption at lens did not vary. The fitting results are listed in Table 3 (Model 6), and the spectra are shown in Figure 1. The fitting results indicate that the absorption at the source has varied by roughly .
4 Discussion
We detected the variable absorption, variable power-law photon index, and variable flux for the blazar PKS 1830211. The observed variability between Chandra and XMM-Newton spectra could be, in part, due to imperfect cross-calibration between the two. However for high S/N spectra, the cross-calibration between Chandra and XMM-Newton can yield a spectral difference of 0.03222http://xmm.esac.esa.int/external/xmm_sw_cal/calib/cross_cal/index.php, whereas our measured differences are between 0.15–0.3. In addition, the higher S/N XMM-Newton spectra show a statistically significant variability within the three XMM-Newton observations ( improvement of 14.5, 14.7, and 14.1 for Models 3, 4, and 5 with spectral variability). We also found the spectral variability between the two Chandra observations, where the second Chandra epoch has consistently lower absorption column densities than the first observation. This is better demonstrated in § 3.1, where we analyzed the individual spectra of each image. We plot the variations of absorption in Figure 2, photon index variations in Figure 3, and the photon index against unabsorbed flux in Figure 4. It is well known that blazars are variable, so the observed spectral variability is not surprising in itself. We also found that the photon index and flux are correlated (Figure 4). This relation has been observed in several Gamma-ray loud AGNs (Foschini et al. 2006). PKS 1830211 provides an additional example of a source following this correlation.
The variable absorption is more intriguing. The variable absorption toward PKS 1830211 was detected previously with ASCA observations (Oshima et al., 2001), although interpreted differently. Oshima et al. (2001) obtained a variation amplitude of when modeling the absorption at the lens, which is consistent with our measurement of (Model 3). We note that the variation detected by Oshima et al. (2001) is on the timescale of 10 days while that found by us is on the timescale of years. It is possible that the variable absorption is at the source redshift. Depending on the nature of the absorber, we obtained variations of and for a fully covering absorber (Model 4) and a partially covering absorber (Model 5, 6), respectively. The other possibilities are microlensing models.
Oshima et al. (2001) proposed a microlensing interpretation to explain the apparent variable absorption. The basic idea is that the absorption does not vary but is different for the two images, and the microlensing produces flux changes between the two images which appears as variable absorption. As we discussed in the spectral fits to individual Chandra images (§ 3.1), the absorption varies in individual images between the two epochs, which cannot be attributed to this simple microlensing model. For this reason, we rule out the simple microlensing model as the cause of variable absorption in PKS 1830211. More complicated microlensing models are required which must involve significant emission size differences between the soft and hard X-ray regions to interpret the data. However, even these models will have difficulty explaining the similar differential absorptions between images A and B for the two Chandra epochs. Microlensing will only produce uncorrelated changes between the images.
Variable absorption thus appears to be a robust result, independent of model. The variability can either come from the lens or from the source redshift. If the variable absorption is at the lens, a variability amplitude of can sufficiently parameterize the Chandra and XMM-Newton spectra without invoking any absorption at the source. Recently, variable Mg II absorption has been detected in an intervening absorber in front of a Gamma-ray burst (Hao et al., 2006). The observed Mg II column density changes as the burst expands geometrically (Frank et al., 2006). Similarly, if the size of the blazar changes with luminosity, it may produce variable absorption at the lens. Another mechanism that can produce variable absorption at the lens galaxy is proposed by Dong (2006), where microlensed images, slightly shifted from the original image position, intersect slightly different positions at the lens, producing variable absorption. However, in PKS 1830211, the differential absorption of the two images in the two Chandra epochs is similar, arguing against the variability at the lens. It is far more likely that the variable absorption is intrinsic to the blazar, simply because there are other AGNs with variable intrinsic absorption, including blazars (see below).
While the absorption toward the gravitational lens PKS 1830211 is very complicated, with the sequence of Chandra and XMM-Newton observations, a converging picture is emerging. Besides the Galactic absorption of (Dickey & Lockman, 1990), there is also an intrinsic absorption and absorption from the lens galaxy. The absorption column densities in the lens galaxy are different for the two lensed images by cm-2 (Dai et al., 2006), and this is consistent with the differential extinction measurement between the two images and a Galactic dust-to-gas ratio. The amplitude of the variability of the intrinsic absorption is model dependent with amplitudes of –.
Recently, the intrinsic absorption for blazars has been reported in several cases, such as GB B1428+4217 (Worsley et al., 2004a), PMN J05253343 (Worsley et al., 2004b), and RBS 315 (Piconcelli & Guainazzi 2005; see also Tavecchio et al. 2007). In this paper, we present variable intrinsic absorption toward gravitationally-lensed blazar PKS 1830211. The large variation in the absorption column density can be interpreted as outflows similar to those detected in BAL QSOs. However, as PKS 1830211 is a blazar, this outflow must be in the polar direction. Recent numerical simulations of accretion flows in AGNs (Proga, 2006) discussed the cases of polar outflows; our observations of PKS 1830211 might be providing an example in support of such models. In addition, it is also possible that the intrinsic absorption variation is caused by the interaction between the blazar jet and its environment, or the variation from the geometric configuration of the jet. More intense monitoring of this system or further variability studies using a large sample of blazars are needed to better constrain the nature of their X-ray spectral variation.
References
- Arnaud (1996) Arnaud, K. A. 1996, ASP Conf. Ser. 101: Astronomical Data Analysis Software and Systems V, ed. Jacoby G. & Barnes J., 17
- Courbin et al. (2002) Courbin, F., Meylan, G., Kneib, J.-P., & Lidman, C. 2002, ApJ, 575, 95
- Dai et al. (2006) Dai, X., Kochanek, C. S., Chartas, G., & Mathur, S. 2006, ApJ, 637, 53
- Dong (2006) Dong, Subo 2006, ApJ submitted, astro-ph/0612403
- de Rosa et al. (2005) de Rosa, A., Piro, L., Tramacere, A., Massaro, E., Walter, R., Bassani, L., Malizia, A., Bird, A. J., & Dean, A. J. 2005, A&A, 438, 121
- Dickey & Lockman (1990) Dickey, J. M. & Lockman F. J. 1990, ARA&A 28, 215
- Frank et al. (2006) Frank, S., et al. 2006, ApJ submitted, astro-ph/0605676
- Foschini et al. (2006) Foschini, L., et al. 2006, astro-ph/0603268
- Garmire et al. (2003) Garmire, G. P., Bautz, M. W., Nousek, J. A., & Ricker, G. R. 2003, SPIE, 4851, 28
- Gerin et al. (1997) Gerin, M., Phillips, T. G., Benford, D. J., Young, K. H.,Menten, K. M., & Frye, B. 1997, ApJ, 488, L31
- Hao et al. (2006) Hao, H., Stanek, K. Z., Dobrzycki, A., Matheson, T., Bentz, M. C., Kuraszkiewicz, J., Garnavich, P. M., Howk, J. C., Calkins, M. L., Worthey, G., Modjaz, M., & Serven J. 2006, ApJ Letter submitted, astro-ph/0612409
- Jauncey et al. (1991) Jauncey, D. L., et al. 1991, Nature, 352, 132
- Lidman et al. (1999) Lidman, C., Courbin, F., Meylan, G., Broadhurst, T., Frye, B., & Welch, W. J. W. 1999, ApJ, 514, L57
- Lovell et al. (1998) Lovell, J. E. J., Jauncey, D. L., Reynolds, J. E., Wieringa, M. H., King, E. A., Tzioumis, A. K., McCulloch, P. M., & Edwards, P. G. 1998, ApJ, 508, L51
- Mathur & Nair (1997) Mathur, Smita & Nair, Sunita 1997, ApJ, 484, 140
- Mattox et al. (1997) Mattox, J. R., Schachter, J., Molnar, L., Hartman, R. C., & Patnaik, A. R. 1997, ApJ, 481, 95
- Mori et al. (2001) Mori, K., Tsunemi, H., Miyata, E., Baluta, C., Burrows, D. N., Garmire, G. P., & Chartas, G. 2001, in ASP Conf. Ser. 251, New Century of X-Ray Astronomy, ed. H. Inoue & H. Kunieda (San Francisco: ASP), 576
- Oshima et al. (2001) Oshima, T., Mitsuda, K., Ota, N., Yonehara, A., Hattori, M., Mihara, T., & Sekimoto, Y. 2001, ApJ, 551, 929
- Piconcelli & Guainazzi (2005) Piconcelli, E., & Guainazzi, M. 2005, A&A, 442, L53
- Pramesh Rao & Subrahmanyan (1988) Pramesh Rao, A., & Subrahmanyan, R. 1988, MNRAS, 231, 229
- Proga (2006) Proga, Daniel 2006, astro-ph/0610383
- Subrahmanyan et al. (1990) Subrahmanyan, R., Narasimha, D., Pramesh-Rao, A., & Swarup, G. 1990, MNRAS, 246, 263
- Tavecchio et al. (2007) Tavecchio, F., Maraschi, L., Ghisellini, G., Kataoka, J., Foschini, L., Sambruna, R. M., & Tagliaferri, G. 2007, ApJ, 665, 980
- Tsunemi et al. (2001) Tsunemi, H., Mori, K., Miyata, E., Baluta, C., Burrows, D. N., Garmire, G. P., & Chartas, G. 2001, ApJ, 554, 496
- Weisskopf et al. (2002) Weisskopf, M. C., Brinkman, B., Canizares, C., Garmire, G., Murray, S., & Van Speybroeck, L. P. 2002, PASP, 114, 1
- Wiklind & Combes (1996) Wiklind, T. & Combes, F. 1996, Nature, 379, 139
- Winn et al. (2002) Winn, Joshua N., Kochanek, Christopher S., McLeod, Brian A., Falco, Emilio E., Impey, Christopher D., & Rix, Hans-Walter 2002, ApJ, 575, 103
- Worsley et al. (2004a) Worsley, M. A., Fabian, A. C., Celotti, A., & Iwasawa, K. 2004a, MNRAS, 350, L67
- Worsley et al. (2004b) Worsley, M. A., Fabian, A. C., Turner, A. K., Celotti, A., & Iwasawa, K. 2004b, MNRAS, 350, 207
| Date | Telescope | Grating? | Exposure Time (sec) |
|---|---|---|---|
| 2000-06-26 | Chandra | HETGS | 47471 |
| 2001-06-25 | Chandra | HETGS | 51219 |
| 2004-03-10 | XMM-Newton | none | 8328 |
| 2004-03-24 | XMM-Newton | none | 27004 |
| 2004-05-05 | XMM-Newton | none | 21356 |
| Date | Image | (z=0.886), cm-2 | ||
|---|---|---|---|---|
| Model 1: An absorbed power-law | ||||
| 2000-06-26 | A | 100.5(108) | ||
| 2000-06-26 | B | 129.6(106) | ||
| 2001-06-25 | A | 140.7(120) | ||
| 2001-06-25 | B | 113.8(116) | ||
| Model 2: An absorbed power-law with . | ||||
| 2000-06-26 | A | 229.6(215) | ||
| 2000-06-26 | B | |||
| 2001-06-25 | A | 255.2(237) | ||
| 2001-06-25 | B | |||
Note. — Galactic is fixed at (Dickey & Lockman 1990) for all models.
| Chandra | XMM-Newton | |||||
|---|---|---|---|---|---|---|
| Parameters | I | II | I | II | III | XMM-Co-Added |
| Date | 2000-06-26 | 2001-06-25 | 2004-03-10 | 2004-03-24 | 2004-05-05 | |
| Model 3: A power-law with absorption at the lens and the Galaxy | ||||||
| () | ||||||
| Unabsorbed Flux aaThe unabsorbed fluxes in all models are calculated between 0.4–8 keV and in units of erg cm-2 s-1. | ||||||
| 365.6(305) | 365.6(337) | 151.8(152) | 447.3(396) | 314.3(301) | 843.7(743) | |
| Model 4: Same as Model 3, with additional absorption at the sourcebbThe absorption at lens is fixed at for this model. | ||||||
| () | ||||||
| Unabsorbed Flux | ||||||
| 369.9(305) | 365.6(337) | 157.6(152) | 484.5(396) | 327.3(301) | 899.3(743) | |
| Model 5: Same as Model 4, but with a partially covering absorber at the sourcebbThe absorption at lens is fixed at for this model. | ||||||
| () | ||||||
| Covering Factor | 0.44 (fixed) | 0.44 (fixed) | ||||
| Unabsorbed Flux | ||||||
| 370.6(305) | 365.9(337) | 137.4(151) | 447.4(395) | 315.6(300) | 827.0(742) | |
| Model 6: Same as Model 5, but with two different power-law componentsccfootnotemark: | ||||||
| () | ||||||
| () | ||||||
| Covering Factor | ||||||
| 1488.8(1367) | ||||||
Note. — Galactic is fixed at (Dickey & Lockman 1990) for all models.