Bar imprints on the inner gas kinematics of M33
Abstract
We present measurements of the stellar and gaseous velocities in the central 5′ of the Local Group spiral M33. The data were obtained with the ARC 3.5m telescope. Blue and red spectra with resolutions from 2 to 4Å covering the principal gaseous emission and stellar absorption lines were obtained along the major and minor axes and six other position angles. The observed radial velocities of the ionized gas along the photometric major axis of M33 remain flat at 22 km s-1 all the way into the center, while the stellar velocities show a gradual rise from zero to 22 km s-1 over that same region. The central star cluster is at or very close to the dynamical center, with a velocity that is in accordance with M33’s systemic velocity to within our uncertainties. Velocities on the minor axis are non-zero out to about 1′ from the center in both the stars and gas. Together with the major axis velocities, they point at significant deviations from circular rotation. The most likely explanation for the bulk of the velocity patterns are streaming motions along a weak inner bar with a PA close to that of the minor axis, as suggested by previously published IR photometric images. The presence of bar imprints in M33 implies that all major Local Group galaxies are barred. The non-circular motions over the inner 200 pc make it difficult to constrain the shape of M33’s inner dark matter halo profile. If the non-circular motions we find in this nearby Sc galaxy are present in other more distant late-type galaxies, they might be difficult to recognize.
Subject headings:
galaxies:individual(M33)-galaxies:kinematics and dynamics -galaxies:structure,dark matter1. Introduction
The central regions of late type spiral galaxies are still quite puzzling places. Often they show a young, massive, compact star cluster and no clear evidence of a stellar bulge or bar (e.g. Boker et al., 2002) leaving open the question of a fueling mechanism for star formation in their shallow central potential. The central region of the Local Group galaxy M33 is the posterchild of such an environment. It hosts a bright blue compact cluster at its center but, unlike other bright Local Group members, no definitive evidence of a bar or bulge has been found yet. Being nearby (840 kpc,=4 pc, Freedman et al., 2001) and at favorable inclination (52∘, Corbelli & Salucci, 2000), M33 allows however a detailed look at the spatial distributions and kinematics of various components in the central region.
The mass of the blue compact nuclear cluster in M33 has been estimated to be of order M⊙ (Kormendy & McClure, 1993; Lauer et al., 1998). Its small mass-to-light ratio is indicative of a young population of stars (age - yr) concentrated in the compact core (Kormendy & McClure, 1993). An age spread is likely to be present across the cluster, due to a possible sequence of accretion events. However, there are models which predict a single-age stellar population by taking into account the role of dust in processing the UV/optical stellar spectrum (Gordon et al., 1999). From the theoretical point of view it is unclear whether compact nuclear clusters are born and manage to survive at the dynamic center or they develop non-steady motions around the mass centroid or migrate towards the center and eventually get disrupted as they approach it (Miller & Smith, 1992; Portegies-Zwart et al., 2003; Milosavljevic, 2004). In the latter cases the dynamic center would not coincide with the position of the bright cluster, but given the shallow potential of M33 (van der Marel et al., 2006) it is unclear that this has happened for this galaxy. There has been no accurate and conclusive spectroscopic determination of the dynamical center via stellar absorption lines or emission line gas mapping of the central 1 kpc region of M33. Rubin & Ford 1980 noticed a possible small displacement of the dynamic symmetry center with respect to the location of the compact nuclear cluster. Locating the dynamical center of M33 has been one of the goals of our project even though we shall discuss in this paper the difficulties of reaching a definite conclusion on this issue. With the nuclear cluster light taken out, the photometric center of M33 is difficult to identify because of the presence of dust. M33 lacks a supermassive black hole at the center, the upper limit to the mass being as low as 1500 M⊙ (Gebhardt et al., 2001; Merrit et al., 2001). Given the shallow potential well of the center of M33 this is not a surprise although the downward extrapolation of the relationship between stellar velocity dispersion and supermassive black hole mass predicts a black hole mass for the cluster that is well above the quoted limit.
Understanding the innermost region of M33 is important also for possible constraints to cosmological models of structure formation, in particular to distinguish cuspy dark matter halo models from isothermal core models. In a recent determination of the rotation curve from the CO J=1-0 line data at kpc, Corbelli (2003) discusses cosmological models compatible with the data and finds that an additional mass component is required in the innermost 1 kpc. What is the nature of this component? Can measurements of the kinematics of stars in the innermost 1 kpc region help in solving some of these issues?
Photometric evidence for a bulge has been presented for M33 but this is far from being conclusive. Exponential profiles typically provide a good fit to the stellar surface brightness in the large-scale disk but in the inner few hundred parsecs the brightness exhibits an excess with respect to the inward extrapolation of the disk exponential law (e.g. Bothun, 1992; Regan & Vogel, 1994). It is unclear whether this is due to an excess of stellar density distributed in a disk or to a bulge/spheroidal light distribution. In the latter case Regan & Vogel (1994) derive a large angular size spheroid (8′ or 2 kpc effective radius) from photometric fits to the disk and spheroidal light distribution. Minniti et al. (1993) have claimed a photometric detection of a smaller central component, a bulge with an effective radius of 0.5 kpc, through JHK-band imaging of the central region of M33. This is perhaps a pseudobulge since it underwent a star formation episode less than 1 Gyr ago. They find a displacement of the center of symmetry of the bulge with respect to the nuclear cluster by about 20′′ to the southeast. They mention dust as a possible origin of this photometric center shift but we note that the large OB stellar association south-east of the nucleus might also cause some displacement of the light center. Recent GALEX far-UV and near-UV mosaics of M33 (Thilker et al., 2005) have also shown an excess of light in the innermost 0.5 kpc region, in agreement with optical photometric results and with the high level of star formation detected by infrared and H surveys (see Magrini et al. 2007 and references therein).
A change in the ellipticity of the isophotes between the inner and the outer regions of a disk galaxy is ofter used to infer the presence of weak bars in nearby galaxies and to measure the bar strength even in more distant systems (Abraham et al., 1999). Larger IR maps of M33 (Regan & Vogel, 1994; Block et al., 2004) point at a weak bar which becomes visible after subtraction of the exponential disk and a spheroidal light distribution. The bar would have a position angle close to 90∘ and projected radial extend smaller than 6’. However an alternative explanation to the bar-like emission is a possible change of the pitch angle of the the spiral arms at smaller radii. Fourier decomposition of galaxy images in the blue has also revealed a bar structure (Elmegreen et al., 1992). The metallicity, which has a negligible gradient in the entire star forming disk of M33 (Crockett et al., 2006; Magrini et al., 2007), also rises suddenly in the innermost 0.5 kpc indicating a possibly complex star formation history.
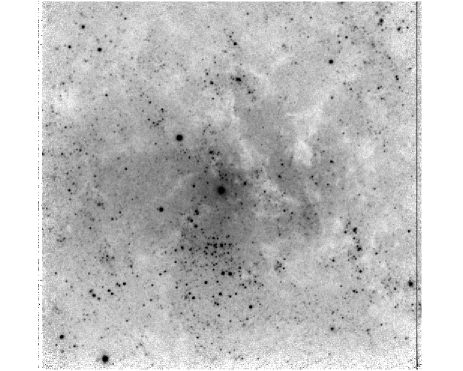
It is remarkable that in spite of this large number of photometric studies of the innermost region of M33, there is not a similarly detailed study of the stellar and gas kinematics. Colin & Athanassoula (1981) noticed an appreciable velocity asymmetry in the inner velocity field using the ionized gas as a kinematic tracer. This however has not been confirmed by the CO rotation curve (Wilson & Scoville, 1989; Corbelli, 2003). In a conference paper, Rubin & Ford (1980) presented emission-line gas spectroscopy at along the major axis only. They find a constant radial velocity all the way into the center, an intriguing result that has not received further follow-up or interpretation. The published HI data (Newton, 1980; Deul & van der Hulst, 1987) do not have sufficient angular resolution to assess the kinematics at small distances from the center and within 200 pc radius only a few molecular clouds have been detected (Wilson & Scoville, 1990; Heyer et al., 2004), insufficient to measure a rotation curve. Therefore, the central gas kinematics has to be investigated via line emission from HII regions and diffuse ionized gas, which fortunately is very abundant (see Figure 1). Stellar velocities, to our knowledge, have never been measured. The intrinsic difficulties of accurate kinematical measurements in the central region of this nearby galaxy compared to e.g. M31, lie in the relatively fainter stellar light (except at the location of the nuclear cluster) and in the slow rising of its rotation curve which implies velocities below 30 km s-1 in the inner 0.5 kpc region. These are of the same order or lower than the expected stellar velocity dispersions.
In this paper we will discuss the results of a set of observations which outline the complex kinematics of the central region of M33. These will hopefully complement other information available for this nearby galaxy, to further establish it as a template for interpreting observations of less resolved, more distant late type galaxies. In Section 2 we outline our observations of the stellar and gaseous kinematics in the inner 0.5 kpc of M33. Results are presented in Section 3, while Section 4 discusses possible dynamical mass models to explain the data. We conclude with a summary of our most relevant results in Section 5.
2. Observations and data reduction
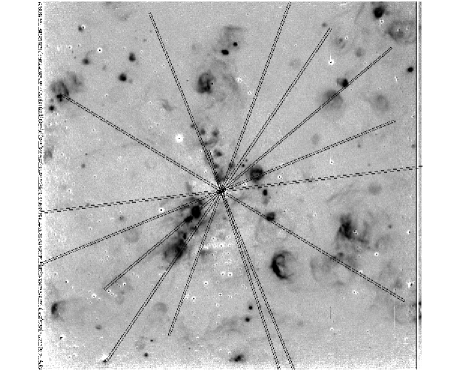
We obtained spectroscopic observations of the central region of M33 with the ARC 3.5-m telescope in various short observing runs in 2002, 2004, 2005, and 2006 using the DIS long-slit spectrograph. The two cameras in DIS covered wavelengths from 3700-5500Å (2004) or 4300-5500Å(other years) in the blue, and 5600-7200Å in the red. The dichroic which splits the light in blue and red components is around 5400Å which implies low sensitivity in the region 5300-5500Å. Spectra of the Ca triplet near 8500Å were obtained for the major axis (PA=22∘) in 2005. The slit width for all spectra was 1.5′′. The slit length was 5′ which corresponds to 1.2 kpc at a distance of 840 kpc. Between the 2002 and 2004 observations the optics of the spectrograph were replaced resulting in changes to the spatial scale from 0.54′′/pixel to 0.4′′/pixel. The 2006 observations were taken with new high resolution gratings in place. The spectral resolution of the various spectra (FWHM) varied from 2.0 to 4.0 Angstrom. Seeing was typically between 1′′ and 2′′. Spectra were obtained at position angles 18∘, 22∘ (nominal major axis), 112∘ (minor axis), 96∘ (suspected bar major axis), 59∘, 130∘, 146∘, and 160∘. The PA=18∘ data were combined with PA=22∘. The slits are shown overlayed on the H emission image in Figure 1. In some cases we obtained two spectra shifted in position to extend the spatial coverage to more than 5′ along a given PA. Major and minor axis spectra were observed a few times with somewhat different centering for the nucleus. In addition, several spectra parallel to, but offset from the major axis spectrum by 1′′ to 8′′, and one at 142′′ SE offset were obtained. These are not shown in Figure 1 to avoid clutter. The net exposure times ranged from 20 to 90 minutes, split in double or triple exposures to eliminate cosmic rays in post-processing. The shorter exposure times apply to the intermediate position angles, while the longer times apply to separate major and minor axis spectra. For all exposures the galaxy was accurately centered in the slit using the slitviewer camera before offsets were done as needed.
Several stars of spectral type F5V through K3III were observed as templates for the stellar velocity measurements. The blue spectra of M33 were predominantly used to measure the stellar velocities, although the H and [OIII] emission lines did provide a check on the H, [NII], and [SII] velocities from the red spectra. In the 2006 run of PA= 130∘, 146∘, and 160∘ the red camera was not available and we include the H emission line velocities for those cuts. The Ca triplet observations provided a more accurate zero point for the stellar velocities than the blue spectra due to the presence of numerous bright sky lines in the IR. Since we wanted to measure the red emission lines, and because the CCD in use for our observations showed significant fringing in the IR and had rather low sensitivity around 8500Å, we only observed the major axis at this wavelength range. These data did enable us to anchor the velocity of the cluster and bright disk part on the major axis, and to measure stellar velocity dispersions along the brightest part of the major axis.
The large angular size of M33 implies that separate sky exposures had to be obtained to subtract sky lines. We observed blank sky regions each night between M33 exposures. HeNeAr lamp exposures were obtained regularly for wavelength calibration. For the red spectra, velocity zero points were determined from the 6923Å sky line for the red emission lines, and from 4 sky lines near the Ca triplet. The blue region of the spectrum has no bright sky lines near the region of interest and the blue spectra’s zero points were set by aligning them with the corresponding red spectra. We estimate the final uncertainty in the zero points to be km s-1.
All data were reduced using standard IRAF processing techniques. Elimination of cosmic rays was done using the crreject option in IRAF. This works well for most of the spectra, but can introduce spurious effects for the bright nuclear star cluster, due to slight changes in seeing, the effects of refraction in the earth’s atmosphere, or in exact centering of the nucleus in the slit. Therefore, measurement of the gas velocities close to the nucleus (shown in Figures 8 and 9) and of the Ca triplet data for the star cluster was done on single spectra. Fringing in the Ca triplet data was reduced satisfactorily by flatfielding the spectra with the quartz flat.
In addition to the spectroscopic observations we also have a deep H image of M33 obtained with the Burrell Schmidt (Hoopes & Walterbos 2000) and we obtained short-exposure, sub-arcsec seeing H, [OIII], and continuum images of the central 4.6′ with the SPICAM imaging camera on the ARC 3.5-m telescope. The latter images provide useful information on the morphology and location of dust lanes, OB assocations, HII regions, and other emission-line sources. Some of the images are shown in Figure 1.
From 21-cm data the inferred systemic velocity of M33 is -180 km s-1, the major axis orientation is PA=22∘, and the disk inclination is (Corbelli & Salucci, 2000) and we shall use these values throughout the paper. The approaching half of M33 is west of the major axis. In showing the velocities along a slit position, our convention is that negative radial distances refer to the east side of the galaxy and increase towards the west side.
2.1. Gas velocity and velocity dispersion measurements
The velocities of the ionized gas were determined on blue and red spectra, measuring the H, [OIII]5007, H, [NII]6783, [SII]6716, and [SII]6731 lines. In the red, the four lines were measured simultaneously to determine one redshift, and individually to test internal consistency. Close to the nucleus [NII]6583 remained the only line visible due to a strengthening of the [NII]/H ratio and the strong stellar H absorption of the stellar nucleus. Outside the nucleus H was the strongest line. Velocities from the red spectra typically have better accuracy, although the H velocities generally agreed well with the H results. Velocities from the [OIII]5007 line line did not always agree with the Balmer line measurements, likely indicating real differences. The [OIII] emission is enhanced in shocks and high excitation regions and it is possible that the [OIII] velocities preferentially probe a less quiescent gas phase; this will be addressed in a second paper where we look at the excitation ratios of the gas in the central region. All the lines were measured with the SPLOT routine in IRAF. From consistency checks between different exposures of the same P.A., overlapping sections between spectra, and internal consistency between the 4 emission lines in each red spectrum we infer that typical uncertainties in the emission line velocities are of order 4 km s-1 (including zero point uncertainties).
2.2. Stellar velocity and velocity dispersion measurements
In order to derive the M33 stellar velocities along the line of sight we used a cross-correlation technique (as described by Kurtz & Mink, 1998) and implemented in the RVSAO set of programs in the IRAF environment. This technique is based on the original power spectrum method developed by Tonry & Davis (1979) and is suitable for rotation curve measurements when line profiles are Gaussian and no complex velocity structures or multiple components are present (Barton et al., 2000). The faint and low mass stellar disk of M33 does not show evident signs of complexity and furthermore the high spatial resolution achieved in this nearby galaxy minimizes the possibility of multiple components overlapping along the line of sight. Our spectral resolution is such that no precise information on the stellar velocity dispersion (of order 25-30 km s-1, e.g. Kormendy & McClure 1993) could be derived from the blue data, but the Ca triplet data did provide some results. The stellar disk kinematics were obtained from absorption features present in the highest resolution spectra across the wavelength range running from about 4400Å to 5500Å. In order to investigate the reliability of absorption line, often mixed with emission line gas, we have also used the cross-correlation technique in the restricted wavelength range 5030Å to 5500Å and find consistent results: we shall refer to this restricted wavelength range correlation as the ‘Mg side’ correlation. All velocities were corrected to Vhelio using the program rvcorrect in IRAF.
A zero point offset in the velocity scale arises in the resulting velocities because of the varying flexure of the spectrograph as it rotates at the Nasmyth focus. The stars observed for cross-correlation are never observed at the same rotator angle of M33 implying a varying relative zero point after wavelength calibration is applied. We aligned the velocity curves setting the cluster velocity to -180 km s-1, as suggested by Ca triplet line analysis.
A number of stellar templates were observed for each instrumental set-up. Spectra were rebinned along the spatial direction to obtain a nearly constant signal-to-noise ratio along the slit. The uncertainties shown in the results are those provided by the XCSAO routine outputs and they do not take into account possible template mismatch. Along the disk, different templates gave consistent results to within a zero point shift only. The stellar nuclear cluster is bluer than the disk, likely different in age, and it may host a mixture of young and old stellar populations. Some template mismatch between nuclear cluster and disk then can cause higher uncertainties in the velocity zero point of the cluster compared to that of the disk when blue spectra are used. This results in an increased scatter eventhough the measured radial dependence of the stellar velocities in M33 was generally consistent along the disk. This is evident for example around the nuclear cluster region and along the minor axis (shown in Figure 3, top panel). The Ca triplet lines are narrow and strong and vary only slowly with metallicity and star temperature. They can therefore be used even if a mixture of stellar populations is present (Kormendy & McClure, 1993). Outside of the nucleus however, as the lines become weak, sky line contamination and remaining fringing become a problem. We therefore obtained results only for the cluster and central disk region on the major axis. To best estimate the radial velocity of the star cluster we measured the position of sky lines and the wavelengths of the Ca triplet lines in the single-exposure wavelength calibrated spectrum with the best seeing. This was done through a fit to several sky lines and to the sharp troughs in the triplet absorption lines. This way we avoid any influence of the stellar template that is used in the cross-correlation method on the derived radial velocity. In addition, by tying the absorption velocity to the sky line wavelengths we eliminate effects of a zero point offset in the velocity scale associated with varying flexure in the spectrograph as it rotates at the Nasmyth focus. The resulting velocity we derived for the cluster was indistinguishable within the uncertainty from the systemic velocity of -180 km s-1. We estimate our zero point uncertainty to be about km s-1. Through cross-correlation with stellar templates in the restricted wavelength range 8480Å 8680Å we also measured stellar radial velocities close to and in the cluster region (Figure 2).
3. Kinematics of Gas and Stars in the central region
The M33 data presented in this paper probe velocities at high spatial resolution and very close in to the nucleus compared to typical rotation curve measurements obtained from the ground for almost all other galaxies. A few issues that pertain specifically to the central region of this nearby low luminosity disk galaxy need to be underlined. First, the observed radial velocities and the velocity dispersions are quite low. Radial velocities are less than 30 km s-1. This is of the same order as might be expected for velocity gradients across spiral arms and for velocities in expanding HII shells around regions of star formation. We will focus here on systematic velocity patterns rather than individual features. Second, the typical uncertainty in the zero point determinations is about km s-1. This implies that any apparent asymmetries of this order in the measured radial velocities from one side of the center to the other may not be real. Third, the scaleheights of the gaseous and stellar disks are expected to be much larger than the closest distances to the central region we can probe: 1′′ corresponds to 4 pc. Therefore, projection effects can lead to misinterpretation of velocities very close to the center, because the gas could be further away from the center even if seen projected close in. We don’t know the scaleheights of the various components in the mass modeling and this also becomes a bigger problem close to the center where the nuclear cluster is a compact source in a likely much thicker gas disk.
3.1. Emission line velocities of the ionized gas
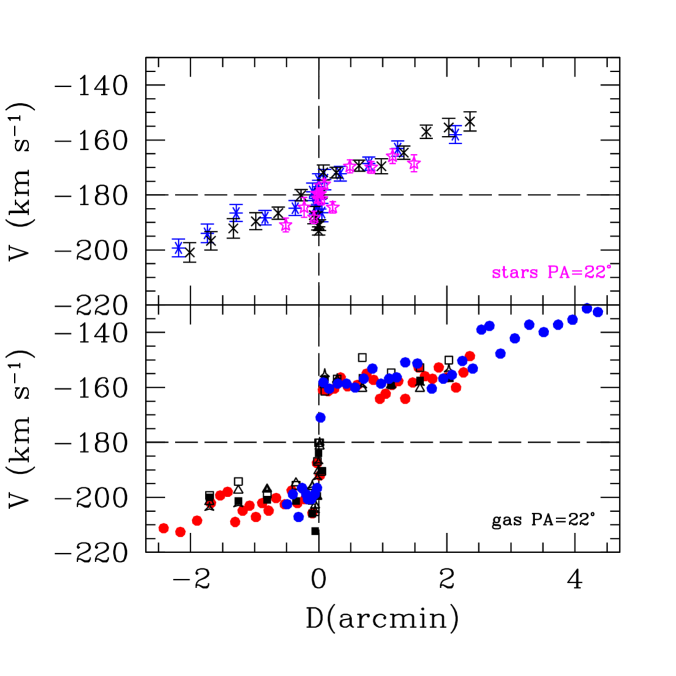
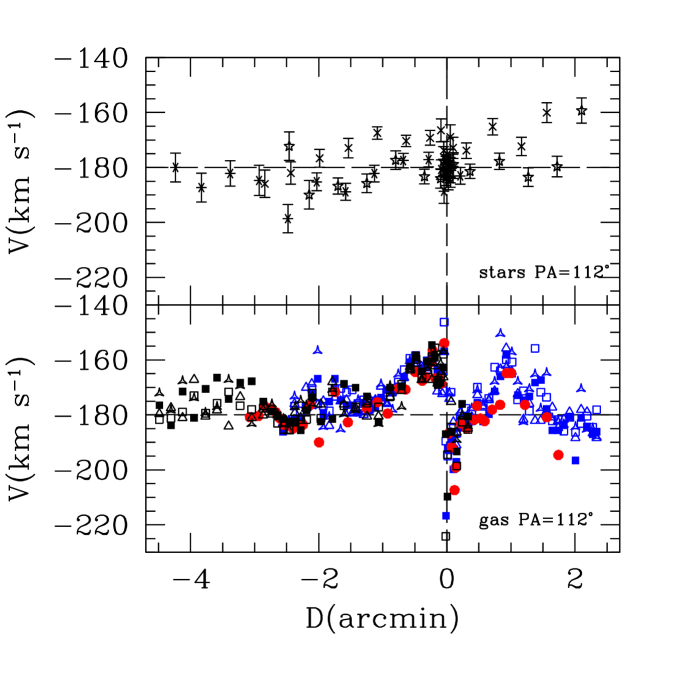
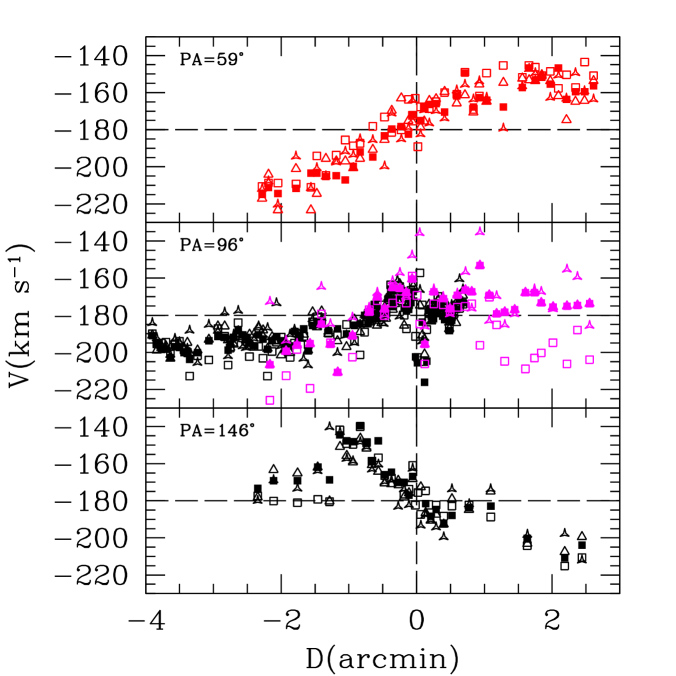
The major and minor axis velocities of the ionized gas in the inner region of M33 are shown in bottom panels of Figures 2 and 3. The most remarkable feature of the major axis velocities is that they are constant at km s-1 on average from (0.5 kpc) down to within ( pc) from the center, in agreement with the results by Rubin & Ford (1980). The minor axis velocities are characterized by significant non-zero velocities within 1-1.5′ from the center, and reach maximum values similar to those observed along the major axis. Even though velocities have a regular pattern along the minor axis, they are far from being constant. Here velocities are not symmetric with respect to the blue cluster center which appears to be located at or close to the dynamical center (see also Section 3.2 and 3.3). On the west side of the minor axis velocities vary by about 50 km s-1 across the innermost region. The minor axis is close to the suspected bar direction (estimated at approximately PA=96∘ from Fig.1 in Block et al.2004 or Fig.1 in Elmegreen et al. 1992). We show the ionized gas velocities for PA=96∘ in the middle panel of Figure 4. The velocities in this direction are much like that of the minor axis, with somewhat reduced amplitude. The velocities East of -1′ drop below systemic as expected, given we see the approaching side of the disk here.
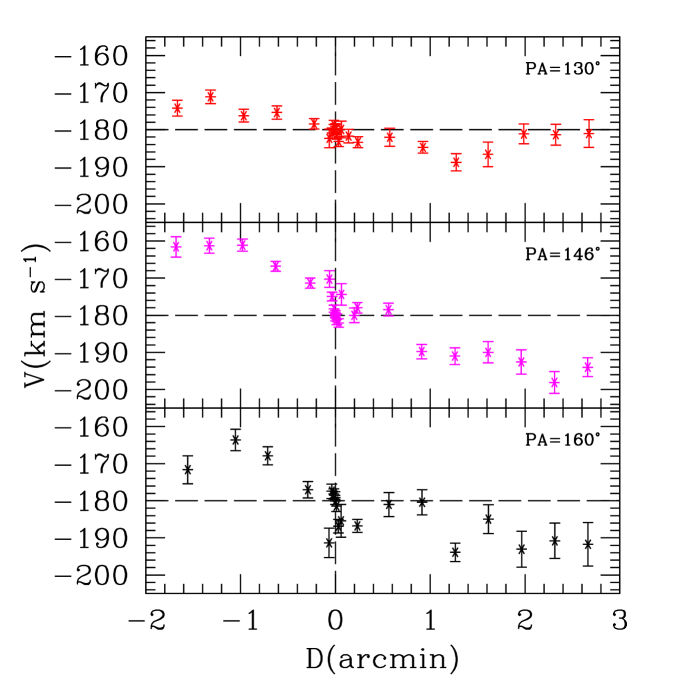
The other two panels in Figure 4 show velocities along PA=59∘ and PA=146∘, while Figure 5 repeats the PA=146∘ data averaging all four red lines, and adds H measurements along PA=146∘ and the neigboring directions PA=130∘ and 160∘. A few points are worth noticing about the radial velocities at the various intermediate PAs. First, the radial velocity maxima reach values as high as observed on the major axis. This would not be expected if major axis velocities were due to gas in circular motion around the center. Specifically, if the rotation curve were flat inside 0.5 kpc as suggested by the major axis velocities, we ought to see constant velocities with a reduced amplitude and a sign change at the center, for all the intermediate PAs. In the inner velocities are instead asymmetric with respect to the center, especially along PA=146∘. Here east side velocities rise to about 30 km s-1 and abruptly decrease around -1′ while on the west side they stay close to systemic for D.
In Figure 7 we show line of sight velocities observed along directions parallel to major axis. The slits cut the minor axis at different projected distances from the nuclear cluster center. Major-axis velocities show the steepest jump when the minor axis is crossed. The systematic shift in the velocity at the minor axis crossing that is evident in the various cuts, is in agreement with the non-systemic velocities observed on the minor axis. We don’t notice any peculiarity in the velocity curve which samples regions at larger galactocentric distances along a direction parallel to major axis (142′′ east offset). The velocities appear normal for disk rotation and the intersection with the minor axis occurs at the systemic velocity this far out.
We tried to measure the velocity dispersions implied by the widths of the emission lines. The highest S/N exposures of the major and minor axis gas velocities in the red were from 2002. These data have a spectral resolution (FWHM) of about 2.5Å, corresponding to 115 km s-1, or a 1 sigma dispersion of about 50 km s-1. We measured the dispersions by deconvolving the widths of the 4 principal red lines (H, [NII]6548, [SII]6716+6731) with the widths of nearby sky lines in the same frame, or with the widths of lines in the arc spectrum at exactly the same location of the data. Typically, in cases where the deconvolution of the line widths gave a consistent result, the derived dispersions were 12 to 20 km s-1 with only very few locations of higher values. There were also several cases where no discernable broadening could be measured. The dispersion due to thermal motion of the gas, for temperatures of 5000 to 10,000K, would be 6 to 8 km s-1 for the Balmer lines.
3.2. The stellar velocity pattern
In the top panels of Figures 2 and 3 we show the stellar velocities measured along the major and minor axis. For the major axis, we include results from the Ca triplet and from the blue spectra, while the minor axis has only velocities derived from the blue spectra. The use of the whole wavelength range in the blue or only of the Mg side (see Section 2) gave consistent results. Velocities along the major axis rise much more slowly for the stars than for the gas. On the minor axis, velocities are close to or at systemic, although we do note that average velocities within from the center are positive with respect to the systemic velocity, a trend which is also observed for the gas. This assumes that the star cluster is at the systemic velocity, a result derived from the Ca triplet measurements. The increased scatter in the minor axis stellar data compared to the major axis data is likely due to increased uncertainty regarding the relative zero points of the nuclear star cluster versus the disk velocities, as discussed in Section 2.
We also measured stellar velocities at PA=130∘, 146∘, and 160∘. These data were obtained with a new blue high resolution grating in place in 2006. The results are shown in the panels of Figure 6. The radial velocity patterns for the stars along these directions are quite similar to those of the gas (Figure 5) but of lower amplitude.
3.3. Velocities in the innermost 60 pc region
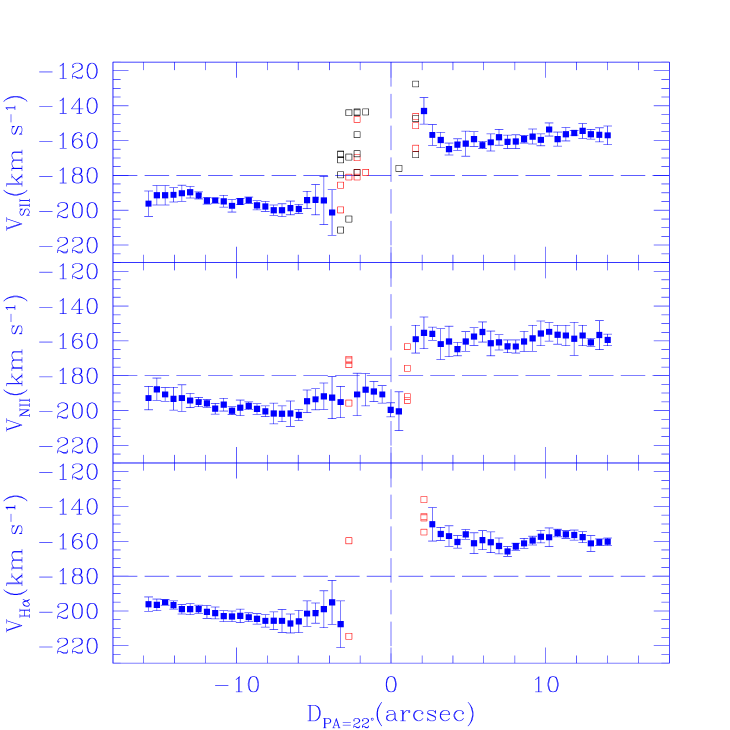
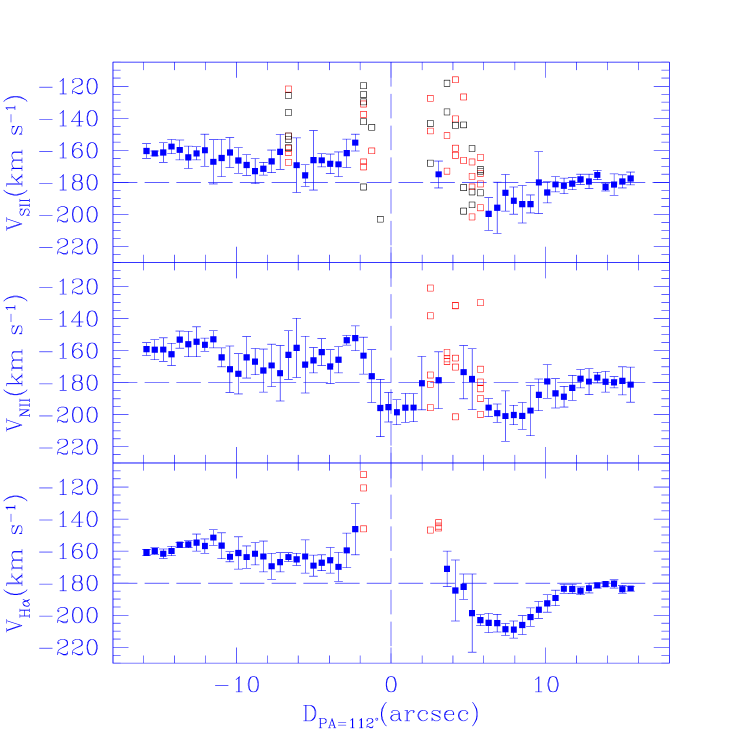
To better characterize the emission line velocities close to the nucleus, we measured each of the four red emission line on individual exposures of the major and minor axis. This was done to avoid any smearing or loss of information that might be introduced close to and across the bright nucleus in the combination of frames during the cosmic ray elimination process. We measured the velocities every single spatial pixel over a region of -15′′ to +15′′ along the major and minor axes. The velocities derived this way were all shifted in zero point using the 6923Å sky line, and then averaged for each pixel when all frames have consistent values i.e. an rms dispersion around the mean less than 25 km s-1. Measurements are not averaged and refer to single frames when the rms dispersion was larger or lines were hardly measureable due to blending with stellar absorption or to intrinsic weakness. [SII] velocities are an average of the velocities derived for the 6716Å and 6731Å lines when they give consistent values. In the opposite case individual measurements of the two [SII] velocities are shown, rather than the average and rms dispersion. Results are shown in Figures 8 and 9.
Data along the major axis show that velocities remain constant in H and [NII], while the [SII] velocities seem to increase near the center. The latter result is uncertain given the large scatter in individual measurements. The only emission line that remains visible across the stellar nucleus is [NII]6854. Even this line is however of limited S/N due to underlying very bright stellar continuum; the [NII]6584 line sits just at the edge of the deep stellar H absorption associated with the cluster. The [NII] velocities on the major axis suggest that the systemic velocity is not measured at the position of the cluster but about 1′′ to the SW of it (along the major axis). This offset was also noted by Rubin & Ford (1980). On the minor axis we find the same value of the gas radial velocity we measure at the cluster position on the major axis. The results are in agreement and point out to a gas velocity of order -200 km s-1 which could imply that the dynamical center is not exactly at the cluster center. However, the presence of similar velocity jumps over short distances on the cuts parallel to the major axis (Figure 7) and the possibility of outflows and non-circular motions imply that it may be difficult to pinpoint the exact dynamic center of M33. The nucleus might be ”wandering” around the dynamic center, either falling in or oscillating (e.g. Miller Smith 1992).
Another somewhat striking aspect of Figure 9 is the negative velocity feature on the minor axis at D in western direction. This is measured quite accurately in H, and reproduced at the intersection with the minor axis on the cut 8′′ offset from the major axis in Figure 7 (top panel). The feature is about 30 km s-1 deep with respect to systemic extending over arcsec or 12 pc. No expanding HII shell is visible at this location. In our H image there is a combination of diffuse emission and faint filamentary structures in this region, much like the emission over most of the area covered by our spectra, but not a single large shell. It is possible that the feature is part of the general oscillatory patterns we see in the gas motions here, that may be associated with shocks or with the bar (see Section 4). A more speculative option is that the dip is associated with a possible keplerian fall off or rotation connected to a black hole at or near that location. However, at our slit positions we did not notice any evident increse in the stellar velocity dispersion. Any meaningful discussion on this issue requires full 2-D velocity field mapping of the central region with high spatial and velocity resolution.
4. Mass modelling of the central region
A comparison of the stellar and gas major axis velocities points to a systematic difference: the stars seem to rotate more slowly than the gas does. This behaviour suggests that asymmetric drift reduces the stellar rotation curve, with the effect being most pronounced close to nucleus, as observed. There are two other noticeable features in the ensemble of gas radial velocity plots shown in the previous Sections. Going radially outwards from the nuclear cluster there is not a particular direction that has the maximum or minimum radial velocities. The major axis direction cannot be easily defined then: for each slit position crossing the center the maximum observed radial velocity is of order 20-30 km s-1 in the radial range . Continuous tilting of the orbits i.e. a non defined preferential direction for the major axis is not sufficient to explain the observed pattern. Velocities along a slit passing through the center do not show a clear symmetry with respect to the nuclear star cluster except along PA=22∘, the major axis of the large scale disk. Asymmetries with respect to the nuclear cluster might be present in the stellar velocities as well, especially along PA=146∘, even though uncertainties in the results of the cross-correlation tecnique and in the central cluster velocity limit our ability to firmly establish their amplitude. Thus models which consider pure circular orbits might be inappropriate for the innermost region of M33. However, we will first explore these models, where circular components make the largest contribution to the observed radial velocities, attributing any gas residual velocity to local peculiar motions such as radial inflows/outflows, shocks, etc. In this framework asymmetric drift should provide the likely explanation for any difference between gas and stellar velocities and gas velocities should be consistent with a dynamical mass model. In the second part of this Section we shall examine if possible asymmetries in the stellar and gas velocity pattern can be related to the displacement of a small bulge, as suggested by Minniti et al. (1993), which would be the dominant mass component in the innermost region. At the end of this Section we interpret the emission line gas kinematics inside in terms of large non-circular orbits around the dynamical center and discuss the possible role of a weak stellar bar in determining the gas flow pattern and its deviations from pure circular orbits.
4.1. The axisymmetric potential
In this Section we consider circular orbits for the gas and stars, centered on the nuclear star cluster. The star distribution is symmetric around the azimuthal direction and about the disk equator. We shall assume that the orientation of the orbits along the line of sight follows that of the large scale disk, namely they are inclined by around the position angle of the major PA=22∘. We assume at first that the circular rotational velocity is traced by the gas emission lines observed along the nominal major axis, corrected by the inclination of the disk along our line of sight. For , gas radial velocities imply a flat rotation curve with an amplitude of 29 km s-1.
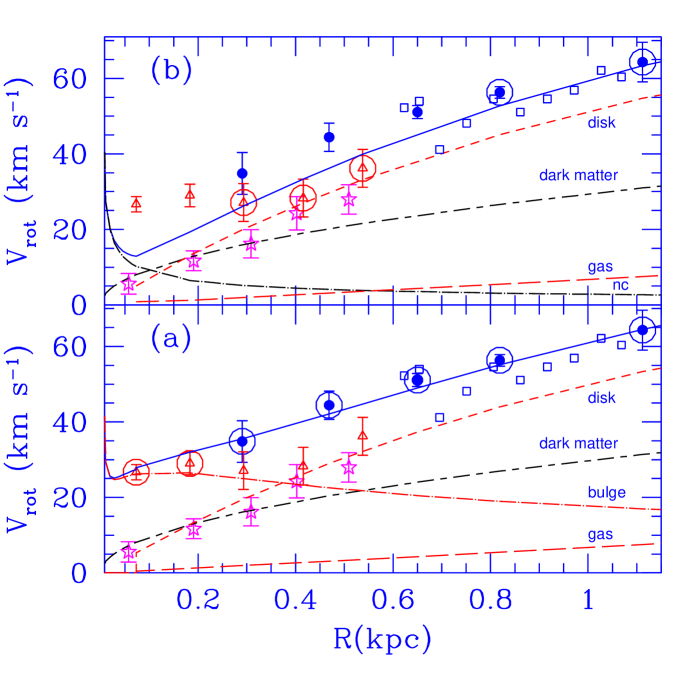
In Figure 10 we show these velocities, averaging and binning red and blue emission line velocities along along PA=22∘ (triangle symbols). The open stars are stellar rotational velocities along the same direction. In Figure 10 the CO J=1-0 rotation curve is also plotted. This is obtained from azimuthal averages of data within of the major axis (Corbelli 2003). The azimuthal averages of the CO velocities are larger than optical line emission velocities at radial distances around 0.5 kpc. This may be due to peculiar motion (e.g. crossing of spiral arms) along various directions or to the fact that PA=22∘ may not be exactly the major axis direction. The rotation curve is traced by optical emission line velocities: is flat inside and the mass density should decline as . The stellar circular velocities follow the gas rotational velocities after asymmetric drift corrections are applied. Considering the mean of the radial velocity times the velocity perpendicular to the plane as constant with height above the plane, from the mass volume density we can estimate the drift following equation 4.33 of Binney Tremaine (1987) as:
| (1) |
where and are the circular velocity and observed stellar rotational velocity respectively, , , and are the radial, azimuthal and vertical velocity dispersion. In the above equation we have assumed that . Using also the assumption that (Binney Tremaine 1987, eq.3.76), we have:
| (2) |
The observed stellar rotation is well fitted by , where is in km s-1 and in arcmin. Assuming that the observed gas velocities trace and hence the gravitational potential, we can infer the mass density from the gas kinematics. The flatness of in the innermost region of M33 and the above equation implies of order 10 km s-1. This is too a small value given the observed stellar dispersions in the disk (of order 30 km s-1), away from the nuclear cluster. Therefore the mismatch between a flat rotation curve for the gas and a rising rotation curve for the stars cannot be only the result of asymmetric drift. Likely the flatness of the radial velocities distribution along PA=22∘ is not due to pure circular motion but to a combination of rotation and some streaming motions in a non-axisymmetric potential. This picture also provides a natural explanation for the non zero velocities observed along the putative minor axis at PA=112∘ and we shall discuss it in Section 4.3. A slow rising gas rotation curve reaches a better agreement with the stellar rotation curve affected by asymmetric drift. Since stellar velocity dispersions in the disk are 30 km s-1 or higher, it is feasible to assume km s-1. Since is of order 29 km s-1 close to the center and decreases further out, then eq.(1) implies that the derivative of the stellar density should be:
| (3) |
This condition implies that asymmetric drift can explain the differences between the stellar and the gas rotation curve when the last one is rising. This is inconsistent with the hypothesis that optical gas velocities observed along PA=22∘ effectively trace the rotation curve in an axisymmetric potential. An almost flat rotation curve requires in fact the above derivative to be of order . There are other difficulties related to the interpretation that the optical gas velocities observed along PA=22∘ define a flat rotation curve for this galaxy. If the constant velocities of order 29 km s-1 along the major axis at PA=22∘ are due to pure circular rotation then we should find constant velocities of order 14,4,9,13 km s-1 along PA=59∘,130∘,146∘,160∘ respectively. We don’t have any evidence for these constant values in the inner region except possibly for PA=160∘. Moreover, we find no acceptable combination of mass components (bulge, dark matter halo, stellar disk) for fitting a completely flat curve in the innermost 0.5 kpc region of M33 and its sudden rise around 0.5 kpc. In addition, the disk mass to light ratio in the innermost regions is constrained by the fit to the large scale RC and cannot be considered arbitrarily small such as to leave a dominant shallow bulge component out to 0.5 kpc.
In this sub-section we still want to examine another possibility related to the axisymmetric potential, namely that the rotation curve is traced by the CO and HI lines down to 0.3 kpc. We consider only the two innermost points of our optical binned emission line set to complement this further in. This removes our previous assumption of a flat rotation curve out to R kpc and that major axis position angle is strictly 22∘. The higher azimuthal averages of CO velocities considered might in fact indicate that indeed the rotational velocities are higher along other directions (consistent with our data). In Figure 10 the circled symbols show the inner data used to define a rotation curve and which we now use fit a mass model. For kpc the rotation curve used is described by Corbelli (2003) and extends out to 19 kpc. We follow the approach of Corbelli (2003) in a cold dark matter framework and use a dark matter profile as described by Navarro et al (1997). As mass components we shall use an exponential stellar disk, a dark matter halo, a bulge, a gaseous disk and the nuclear cluster. We allow the exponential disk to have all possible mass-to-light ratio values. For the bulge we assume a rotational velocity of the following form:
| (4) |
where the mass and the scale radius are free parameters. We set the stellar disk scalelength equal to the K-band scalelength of 5.6′ (Regan Vogel 1994) and search for the bulge and dark matter parameters which give the lowest compatible with the data. The lowest bulge mass and scalelength compatible with the data are M⊙ and kpc. We show the central region of this mass model fit in Figure 10. The mass to light ratio of the disk and of the bulge are of order unity even though uncertainties in the bulge luminosity leave this ratio uncertain for the bulge itself. A larger bulge gives acceptable fits and we cannot exclude it from dynamical arguments. The dark matter halo parameters in this fit are similar to those found by Corbelli (2003). The gas rotation curve in this case is far from flat and it is compatible with the rotation curve inferred from the stellar absorption lines, provided that the last one is affected by asymmetric drift. The velocity dispersions required by the asymmetric drift correction to stellar rotation in order to agree with gas rotation are of order 20-30 km s-1.
Could the position angle of the major axis be effectively changing for kpc, as indicated by higher velocities observed in CO along other directions? We cannot exclude that the direction of major axis is changing with radius but this alone does not explain the complex pattern we observe in the emission line velocities. Despite the good dynamical fit to the slow rising rotation curve of Figure 10, compatible with the dynamical model of the extended disk rotation, its projection along other directions does not agree with the observations presented in this paper. Orthogonal directions such as PA=146∘ and PA=59∘ reach similar velocities on the East side for example but much lower value on the West side. Overcoming these discrepancies in the framework of simple models discussed above implies taking into account additional peculiar motions. M33 has its near side west of major axis. Evidence for this is provided by dust lanes, which become more pronounced west of the major axis in a blue image of M33 (e.g. Figure 1). This orientation is also consistent with trailing spiral arms. In this geometry, a positive anomalous velocity on the near side can be interpreted in terms of local radial infall of gas towards the center. Evidence for local radial gas infall in our sampled areas might come only from a region 1′ west on minor axis and along the East side at PA=59∘. These peculiar velocities might be connected to shocks along dust lanes or to the beginning of the northern/southern spiral arm. The possibility that these features are related to shocks will be analyzed in more detail in a forthcoming paper where emission line ratios are examined. South-East of the nucleus, towards the strong OB association, the gas shows strong positive velocities which could be interpreted as a large nuclear outflow, possibly intersecting also the innermost 1′ East on minor axis. However, since a similar anomaly is observed also in the stellar velocity pattern, even though of smaller amplitude, we cannot give any definite conclusion on the existence of such outflow.
In the rest of this Section we will discuss the possibility that the anomalous velocities we observe are not related to gas inflow or outflow patterns superposed on pure circular rotational velocities in an axisymmetrical potential, but to large scale distortions of the potential, such as given by a displaced bulge or by a weak bar.
4.2. A displaced bulge
The ordered motion detected in central regions of M33 and the high star formation rate (Thilker et al. 2005; Magrini, Corbelli, Galli 2007) point out that if any bulge is in place this is more likely a pseudo-bulge, intermediate between a spheroid and a disk.
Looking in detail at the gas and stellar radial velocities along PA=130∘,146∘,160∘ we notice that between -1′ and 0.5′ velocities are symmetric around a point located at where velocities are of order -170 km s-1. Abrupt changes in the velocity are noticeable outside the -1′ -0.5′ region. These asymmetries around a displaced center with respect to nuclear cluster are possibly in line with a suggestion by Minniti et al. (1993) about a bulge that is offset from the nuclear cluster. They reached this conclusion from looking at the V and H band images of the center of M33. However the presence of dust lanes in this region and of the bright OB association in the south-east did not allow any definitive conclusion to be drawn. The displacement in the kinematic symmetry point we find is of order 15′′ to the South-East, compatible with the suggestion of Minniti et al. (1993). The excess light they found in the innermost 0.24 kpc, is compatible again with what is required by the mass modeling of the large scale rotation curve. The excess of light in the innermost 0.5 kpc region detected by azimuthal averages of near infrared J,H,K emission by Regan Vogel (1994) points to a larger spheroidal component (8′ effective radius). This conclusion however relies on the assumption that the exponential disk scalelength does not change going from the extended disk to the innermost region and that an light distribution is effectively in place for the spheroid. In reality, departures from law are evident both in the blue and in the near infrared bands (Bothun 1992; Regan Vogel 1994). A possible displacement of the bulge however does not explain the peculiar symmetric steep rise and flatness of the gas velocity observed along PA=22∘ centered on the stellar nuclear cluster.
4.3. An oval bar
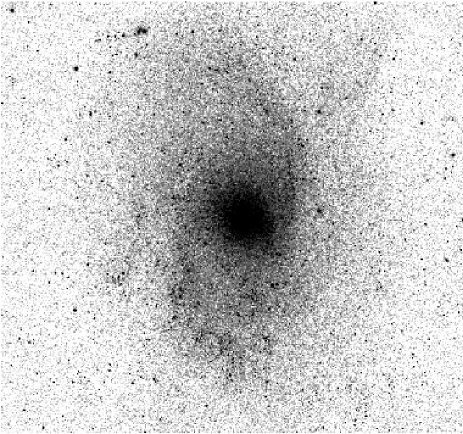
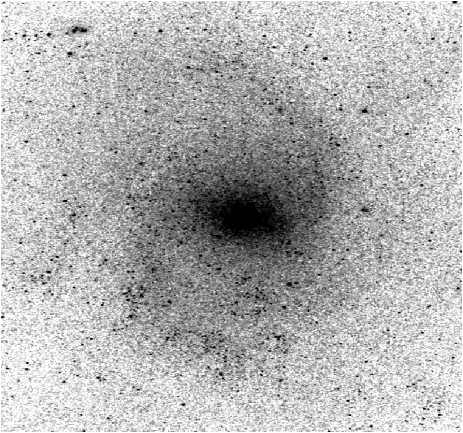
As stated in the Introduction, photometric evidence for a bar has been given by near-IR photometry but also by the Fourier transform technique on galaxy images in the blue band (Elmegreen, Elmegreen Montenegro 1992). We shall discuss here whether any anomalous velocity with respect to the axisymmetric potential can be interpreted in terms of a triaxial potential, and if this triaxial figure is rotating, as is the case for a bar. Near-IR images point to a bar which we initially estimated to be roughly aligned along PA=96∘. This position angle estimate is close to the minor axis and that makes the bar more difficult to see because projection effects make it appear rounder. To investigate the light distribution we downloaded the 2MASS K-band image, rotated it by 22∘ clockwise to align the major axis with y-axis, and stretched the x-pixel size by 1.62 to attempt to deproject the image to what it might look face-on if the components are all in a thin disk. The central portions of the rotated and of the deprojected images are shown in Figure 11. The stretched image needs to be interpreted with caution since e.g. a spherical light distribution would be stretched out into an oval shape. Nevertheless, a central broad oval concentration of light appears to be visible in the non-stretched image too.
We measured the ellipticities of the isophotes on a non-stretched median filtered K-band image. The ellipticity is low averaging about 0.15 from 50 to 150 arcsec distance from the center, and the PA of the isophotes is in the non-rotated frame, somewhat different from our previous estimate (96∘ by inspecting stretched images). Inside 50 arcsec but still outside the central star cluster the ellipticity is higher, about 0.3. Outside 150 arcsec visible spiral arms converging onto the center limit the validity of the isophote fitting procedure. The deprojected bar radial extent can then estimated to be at least 2.5′ or 0.6 kpc, and it can possibly be even larger. Regan & Vogel (1994) estimated a deprojected bar length of about 0.8 kpc while Elmegreen et al. (1992) claim a longer bar, extending out to about 1.5 kpc. It is not yet clear what limits the extent of weak bars. According to Combes Elmegreen (1993) in late-type galaxies the bar extent is comparable to the radial scalelength of the stellar disk; the K-band radial scalelength of the stellar disk of M33 is about 1.4 kpc(Regan & Vogel, 1994) so this theory predicts a bar length in close agreement with the estimate of Elmegreen et al. (1992). The bar in M33 is weak according to most classification schemes. For example following Abraham et al. (1999) and using the 2-MASS image of Figure 11 we computed an intrinsic bar axial ratio of 0.57, and a bar strength parameter . These values place M33 at the boundary between barred and unbarred systems and marginally classify M33 as a barred galaxy. Measuring and interpreting the inner kinematics is therefore especially important for this galaxy in order to find kinematic signatures of the oval bar.
The region along the minor axis where we see anomalous velocities has an extent of about 1.2′ on the sky i.e. of about 0.5 kpc in radius. This is close to the smallest effective bar length estimate. The positive velocities of the gas East of the star cluster on the minor axis, and the negative velocities on the opposite side, at about 8′′ away from the stellar cluster, can be interpreted in term of streaming motion of elongated orbits parallel to the bar. It is likely in fact that streaming motions become more pronounced closer to the center, where light contours are more elongated. The remarkably constant velocities for the emission line gas observed on both sides of the nucleus at PA=22∘ are also consistent with streaming motions along a bar: For a bar oriented close to the minor axis as is the case for M33, streaming motions along the bar add to the circular velocities on the major axis to produce a sharp discrete jump in velocity across the nucleus. This is seen clearly in the galaxy NGC6300 which has a bar close to the minor axis and inclination similar to M33 (Buta etal. 2001, their Figure 21). Major and minor axis velocity peculiarities in the inner are then consistent with having streaming motions along a bar.
Let us now assume that the central flat plateau of the velocity curve along PA=22∘ is mostly due to streaming motion and that the average rotational velocities are lower, somewhere in between the stellar velocities and the CO velocities. For fitting a mass model we take the average velocities traced by optical emission lines along the northern and southern side of the major axis between 0.2 and 0.8 kpc. We consider the rotation curve of Corbelli (2003) at larger radii. In Figure 10 we show with circled symbols the data points in the inner region which we shall use to fit a mass model. Since we don’t require rotational velocities to be high at kpc, we can achieve acceptable fits without putting any relevant mass in the bulge. Best fitting parameters for the stellar disk and for the dark matter halo are similar to those of the model shown in Fig. 10. The additional non axisymmetric mass component in the bar is what causes the streaming motion i.e. the larger velocities observed in the gas (at kpc along the major axis and in the azimuthal averages traced by the molecular component out to 0.8 kpc) with respect to the pure circular rotation (continuous line in Figure 10). The difference between the gas and the stellar rotation curve in this case is compatible with the asymmetric drift hypothesis even though in the presence of a bar, stellar and gas orbits might be different.
Using this rotation curve and the epicyclic approximation we can then locate the inner/outer Lindblad resonances, (hereafter ILR/OLR) and the corotation radius, if a bar pattern speed can be inferred. The positive radial gradient of the rotation curve shown in Figure 10 implies that there is no ILR or that this is close to the cluster location, at very small radii. In Figure 12 we show the angular frequency corresponding to the rotation curve of Figure 10. After computing the epicyclic frequency we draw the curves needed to locate the inner and outer Lindblad resonances. If the bar in M33 ends at its own corotation (0.6-1.5 kpc) then the bar pattern speed is 10 km s-1 (shaded region in Figure 12). The intersection between the curve and the bar pattern speed defines the ILR (OLR). The requirement of a bar ending at the IRL would imply instead a very low bar pattern speed, of order 1-2 km s-1. The absence of an ILR (possibly occurring at very small radii), or a low bar pattern speed, confirm the weakness of the M33 bar. The likely situation is that the bar of M33 is at its dawn, and still in the process of aligning the orbits in a preferential direction. Our finding is linked to the argument of Binney Tremaine (1987) about the growth of weak bars: namely, that when a weak bar instability arises in a disk, most of the orbits are aligned parallel to the bar, streaming motion are large in the direction perpendicular to the bar and there is no ILR.
Evidence for weak bars or triaxial structures has been found for two other late-type spirals recently: NGC 628 (Fathi et al. 2007) and NGC 2976 (Spekkens & Sellwood 2007). They show that late-type spirals may not be the simple dynamical systems we once might have thought them to be. In the case of M33, streaming motions are difficult to quantify given the small amplitude of the observed velocities and the small size of the region where these motions take place. Even though a weak bar can likely drive non-circular motion and cause the non zero velocities along minor axis and the flat velocity profile along the major axis of M33, our impression is that it cannot account for all peculiar velocities observed in other directions. Any more detailed model for a non axisymmetric flow pattern requires a full 2-D velocity map of the central region.
5. Summary and discussion
In this paper we have presented and analyzed optical observations of gas and stellar radial velocities in the innermost 0.5 kpc region of M33. We summarize below the main results and their implication for the mass distribution in the central region of this nearby galaxy.
-
(i)
The radial velocity of the bright nuclear cluster places it close to the systemic velocity of this galaxy. We see only a small offset in the dynamical center as determined from the required symmetry in emission line radial velocities across the central steep velocity gradient observed along PA=22∘ (major axis of the large scale disk). The lack of a dominant gravitational entity in the center of this galaxy implies that the exact dynamical center cannot be yet defined.
-
(ii)
Gas radial velocities indicate a relatively flat and symmetric curve along PA=22∘ between 4′′ and 2′ radial distances from the nuclear cluster. Some local displacements around the mean value of 22 km s-1 are visible. No other direction, between all those observed, presents evidence for a very steep central gradient and for a flat and symmetric velocity distribution such as observed along PA=22∘ (about a 45 km s-1 jump over a few pc). For each slit crossing the nuclear cluster the maximum observed radial velocity however is of order 20-30 km s-1 (as along PA=22∘) but it can occur as far as 1.5′ from the nuclear cluster. Particular relevant are the non zero velocities observed for the gas along the minor axis within projected radial distances of . Given the large scale orientation of the M33 disk these cannot be explained in terms of a gas inflow pattern.
-
(iii)
The stellar velocities show smaller radial gradients than the gas, even though the overall pattern along each direction agrees with that of the gas. We have discussed the differences between the gas and stellar velocities in terms of asymmetric drift correction. We estimate that the asymmetric drift correction cannot explain the difference between a flat gas rotation curve and a rising stellar rotation curve for an axisymmetric potential. Moreover we have not found a mass distribution compatible with a flat rotation curve inside 0.5 kpc region and with the large scale rotation curve.
-
(vi)
We have discussed the likely possibility that the flat gas velocity curve observed along PA=22∘ and the non zero velocities observed in the orthogonal direction are connected with streaming motion due to a weak bar. This bar has been postulated previously from photometric measures but here we have presented the first dynamical evidence consistent with this. With M33 included, it now seems all major Local Group galaxies (including the Large Magellanic Cloud) are barred!
The presence of a weak bar and the uncertainties in the amplitude of the streaming motion close to the center of this galaxy limit our ability to constrain the density profile of the dark matter halo in the center and any related cosmological issues. The other limit comes from what Figure 10 shows, namely that the likely baryonic mass components in the central region of M33 are never so small as to leave dark matter as the main ingredient of the gravitational potential. The presence of relevant baryonic components with their related uncertainties limits the ability to constraint the shape of dark matter density distribution. If a galaxy like M33 were 5-10 times further away, the non-circular motions we have found might have gone unnoticed. In this sense, M33 provides a sobering reminder that even a nearby disk-dominated system still does not provide a unique answer to this cosmological issue.
References
- Abraham et al. (1999) Abraham, R. G., Merrifield, M. R., Ellis, R. S., Tanvir, N. R., & Brinchmann, J. MNRAS, 308, 569
- Barton et al. (2000) Barton, E. J., Kannappan, S. J., Kurtz, M. J., & Geller, M. J. 2000, PASP, 112, 367
- Block et al. (2004) Block, D. L., Freeman, K. C., Jarrett, T. H., Puerari, I., Worthey, G., Combes, F., & Groess, R. 2004, A&A, 425, L37
- Boker et al. (2002) Boker, T., Laine, S., van der Marel, R. P., Rix, H. W., Ho, L. C., & Shields, J. C. 2002, AJ, 123, 1329
- Bothun (1992) Bothun, G. D. 1992, AJ, 103, 104
- Buta (2001) Buta, R., Ryder, S. D., Madsen, G. J., Wesson, K., Crocker, D. A., & Combes, F. 2001, AJ, 121, 225
- Colin & Athanassoula (1981) Colin, J., & Athanassoula, E. 1981, A&A, 97, 63
- Corbelli & Salucci (2000) Corbelli, E., & Salucci, P. 2000, MNRAS, 311, 441
- Corbelli (2003) Corbelli, E. 2003, MNRAS, 342, 199
- Crockett et al. (2006) Crockett, N. R., Garnett, D. R., Massey, P., & Jacoby, G. 2006, ApJ, 637, 741
- Deul & van der Hulst (1987) Deul, E. R., & van der Hulst, J. M. 1987, A&AS, 67, 509
- Elmegreen et al. (1992) Elmegreen, B. G., Elmegreen, D. M., & Montenegro, L. 1992, ApJS, 79, 37
- Fathi et al., (2007) Fathi, K., Beckman, J. E., Zurita, A., Relano, M., Knapen, J. H., Daigle, O., Hernandez, O., & Carignan, C. 2007, A&A, in press (astro-ph/0703018)
- Ferrarese et al. (2006) Ferrarese, L., et al., 2006, ApJ, 644, L21
- Freedman et al. (2001) Freedman, W. L., Wilson, C. D., & Madore, B. F. 1991, ApJ, 372, 455
- Gordon et al. (1999) Gordon, K. D., Hanson, M. M., Clayton, G. C., Rieke, G. H., & Misselt, K. A. 1999, ApJ, 519, 165
- Gebhardt et al. (2001) Gebhardt, K., et al., 2001, AJ, 122, 2469
- Heyer et al. (2004) Heyer, M. H., Corbelli, E., Schneider, S. E., & Young, J. S. 2004, ApJ, 602, 723
- Kormendy & McClure (1993) Kormendy, J., & McClure, R. D. 1993, AJ, 105, 1793
- Kurtz & Mink (1998) Kurtz, M. J. and Mink, D. J. 1998, PASP, 110, 934
- Lauer et al. (1998) Lauer, T. R., Faber, S. M., Ajhar, E. A., & Grillmair, C. J. 1998, AJ, 116, 2263
- Magrini et al. (2007) Magrini, L., Corbelli, E., & Galli, D. 2007 A&A, submitted
- Merrit et al. (2001) Merritt, D., Ferrarese, L., & Joseph, C. L. 2001, Science, 293, 111
- Miller & Smith (1992) Miller, R. H., & Smith, B. F. 1992, ApJ, 393, 508
- Milosavljevic (2004) Milosavljevic, M. 2004, ApJ, 605, L13
- Minniti et al. (1993) Minniti, D., Olszewski, E. W., & Rieke, M. 1993, ApJ, 410, L79
- Navarro et al. (1997) Navarro, J. F., Frenk, C. S. F., & White, S. D. M. 1997, ApJ, 490, 493
- Newton (1980) Newton, K. 1980, MNRAS, 160, 689
- Portegies-Zwart et al. (2003) Portegies Zwart, S. F., McMillan, S. L. W., & Gerhard, O. 2003, ApJ, 593, 352
- Regan & Vogel (1994) Regan M. W., & Vogel S. N., 1994, ApJ, 434, 536
- Rubin & Ford (1980) Rubin, V. C. & Ford, W. K. 1985, Carnegie Inst. Washington Ann. Rept., No. 85, p. 66
- Spekkens & Sellwood (2007) Spekkens, K., & Sellwood, J.A. 2007, ApJ, in press (astro-ph/0703688)
- Thilker et al. (2005) Thilker, D. A. et al. 2005, ApJ, 619, 67
- Tonry & Davis (1979) Tonry, J. L. & Davis, M. 1979, AJ, 43, 393
- van der Marel et al. (2006) van der Marel, R. P., Rossa, J., Walcher, C. J., Boeker, T. Ho, L. C., Rix, H.-W., & Shields, J. C, 2007, to appear in the Proceedings of IAU Symposium 241 ”Stellar Populations as Building Blocks of Galaxies”, A. Vazdekis and R. Peletier., eds. (astro-ph/0702433)
- Wilson & Scoville (1989) Wilson C. D., & Scoville, N. 1989, ApJ347, 743
- Wilson & Scoville (1990) Wilson, C. D., Scoville, N. 1990, 363, 435