Cha: abnormal IMF or dynamical evolution ?
Abstract
Context. Chamaeleontis is a unique young ( Myr) association with 18 systems concentrated in a radius of arcmin, i.e. 1pc at the cluster distance of 97pc. No other members have been found up to 1.5 degrees from the cluster centre. The cluster mass function is consistent with the IMF of other rich young open clusters in the higher mass range but shows a clear deficit of low mass stars and brown dwarfs with no objects below .
Aims. The aim of this paper is to test whether this peculiar mass function could result from dynamical evolution despite the young age of the cluster.
Methods. We performed N-body numerical calculations starting with a log-normal IMF and different initial conditions in terms of number of systems and cluster radius using the code NBODY3. We simulated the cluster dynamical evolution over 10 Myr and compared the results to the observations.
Results. We found that it is possible to reproduce Cha when starting with a very compact configuration (with and pc) which suggests that the IMF of the association might not be abnormal. The high initial density might also explain the deficit of wide binaries that is observed in the cluster.
Key Words.:
Stars : low-mass, brown dwarfs - Stars : mass function - Open clusters and associations : individual : Eta-Chamaeleontis1 Introduction
The recently-discovered Chamaeleontis stellar cluster (Mamajek et al. 1999) is remarkable in several respects. It is a compact (extent pc) and sparse group of 18 pre-main sequence (PMS) systems, and it is one of the nearest clusters to the Sun with an Hipparcos distance pc. The stellar members present a high degree of coevality with an age of Myr (Lawson & Feigelson 2001, Luhman & Steeghs 2004, Lyo et al. 2004a) and were probably born near the Lower Centaurus Crux subgroup of the Sco-Cen OB association (Mamajek et al. 2000, Jilinski et al. 2005). Despite the youth of the cluster there is no evidence for extinction due to remnant molecular material, and the proximity of the cluster ensures that foreground reddening is negligible (Lyo et al. 2004a). Because of these characterictics, the Cha cluster is an ideal target to study the properties of “older” T-Tauri stars, such as circumstellar disk evolution (Bouwman et al. 2006) and binarity (Lyo et al. 2004b, Brandeker et al. 2006), and to search for its brown dwarf population.
Several photometric surveys have been performed during the last few years with the aim of obtaining a complete census of cluster members beyond the original X-ray-selected population. To date, 18 systems have been discovered with a mass range of to (Mamajek et al. 1999, Lawson et al. 2002, Lyo et al. 2004b, Song et al. 2004). Lyo et al. (2004b) found that the cluster mass function is consistent with the IMF of rich young open clusters and field stars in this mass domain. By extrapolating the mass distribution of the Trapezium cluster (Muench et al. 2002) to lower masses, they predicted additional low mass stars with and about 15 brown dwarfs should accompany the documented stellar population. However, Luhman (2004) examined the region within a radius of surrounding Cha using 2MASS and DENIS photometric data and found no new members within the mass range . Lyo et al. (2006) performed a deeper survey of the central core region down to and found no new low mass members either. Whether this clear deficit of very low mass stars and brown dwarfs in the cluster mass function results from an abnormal IMF or is due to dynamical evolution is not completely clear yet. Although Cha is young and sparse, there is some hint that dynamical evolution has already occurred. In particular, the radial distribution of the cluster members indicates that significant mass segregation is present with more than 50% of the mass residing in the inner 6 arcmin or 0.17 pc (Lyo et al. 2004b). This is the sparsest stellar cluster for which mass segregation has been seen. Moreover, the maximum stellar mass – cluster mass relation proposed by Weidner & Kroupa (2006) yields a mass of for the embedded cluster at the origin of Cha. The actual cluster mass is , which suggests that a significant fraction of the primordial stellar members has already been lost, probably as a consequence of gas expulsion.
Binarity studies indicate that the 18 stellar systems of Cha include five confirmed (RECX 1, RECX 7, RECX 9, RECX 12, and RS Cha which may be a triple) and three probable (ECHA J0836.2-7908, ECHA J0838.9-7916, and Cha) binaries; see Table 2 of Lyo et al. (2004b). This yields a multiple fraction of % which is times higher than that of solar-type field stars, although it is of the same order as observed in other young, nearby associations such as Taurus or TW Hydrae. Speckle observations (Köhler & Petr-Gotzens 2002) and adaptive optics imaging (Brandeker et al. 2006) resolved only two binaries, RECX 1 and RECX 9. In both cases the projected separation is ” which corresponds to about 20 AU at a distance of 97 pc, and the other binaries are not spatially resolved. RECX 7 is a dual-lined spectroscopic binary (Lyo et al. 2003) and RS Cha AB is an eclipsing system (Andersen 1991, Mamajek et al. 2000). No companion with projected separation larger than 20 AU has been found around the 18 cluster members. Brandeker et al. (2006) computed a companion probability based on their contrast sensitivity limit and found an upper limit of about 18% for wide ( AU) binaries in Cha. This contrasts to the 58% in the TW Hydrae association that is of similar age. Bouwman et al. (2006) presents the most recent summary of binary properties for the cluster.
These properties – the deficit of very low mass objects, mass segregation, and the lack of wide binaries – are rather unusual considering the youth and sparsity of the Cha cluster. Whether they were imprinted during the formation phase as a result of different initial conditions, or whether they are due to dynamical evolution is an open issue.
The aim of this paper is to test this second possibility. We try to reproduce the observed Cha properties using N-body numerical simulations of the cluster dynamical evolution, starting with standard initial conditions. In the next section, we explain the model we used for the calculations. The results and analysis are presented in Section 3, and the conclusion is given in Section 4.
2 Numerical simulations
2.1 IMF
There is growing evidence that the IMF is independent of initial conditions, from the stellar domain down to the substellar regime (e.g. Kroupa 2001, Chabrier 2003, Moraux et al. 2007). It would therefore be rather surprising to find such a different initial mass spectrum for Cha with no members with masses below . Following the log-normal IMF from Chabrier (2003)
where and , we estimate the number of systems necessary to reproduce the four objects with a mass between 1 and observed in the cluster111The stars/systems with are Cha, the RS Cha binary, HD 75505, and at least one of the three K-stars, RECX 1, 7 and 11. In the absence of dynamical masses for any of the K-type stars, their adopted masses are somewhat model-dependent.. We found that about 50 systems with masses between 0.01 and are mandatory. We started a first set of numerical calculations with and different values of initial cluster radius . Then we fixed around the values that give the best results in reproducing the observations and we performed a second set of simulations with to test the effect of the initial number of systems on the results.
2.2 Initial cluster radius
Recently, Adams et al. (2006) found a correlation between the number of stars in a star forming region and the core radius using a compilation of data on embedded clusters from Lada & Lada (2003) and Carpenter (2000). Clusters identified by Spitzer using infrared-excess sources also follow this relationship (Allen et al. 2006). This corresponds to an average surface density of cluster members that is nearly constant and gives pc for stars.
In the calculations, the cluster size is defined by the virial radius
where is the total mass of the cluster, and is the total energy of the system. To maximize the density, and thus dynamical interactions, between cluster members, we first adopted the value pc as an initial condition. As Cha appears to be already evolved dynamically despite its youth – all the low mass objects with have already been lost – we also started our calculations with more compact configurations down to pc. We chose , 0.1, 0.05, 0.03, 0.01 and 0.005 pc.
2.3 Initial density distribution
Significant mass segregation is already present in Cha with more than 50% of the stellar mass residing in the inner 0.17 pc (Lyo et al. 2004b). Similarly, studies of young rich stellar clusters (e.g. in the ONC; Hillenbrand & Hartmann 1998) have shown that the most massive stars are concentrated in the central core of the cluster. Bonnell & Davies (1998) have suggested that mass segregation may reflect the initial condition of the cluster, and is not a consequence of dynamical interactions. To test this hypothesis, we started some of our simulations with primordial mass segregation, and some without.
In all cases, we initially select stellar positions so as to follow a Plummer model
with (Aarseth et al. 1974). To add primordial mass segregation, we simply rejected stars with that were assigned to and repeated the random drawing for this cluster member. The velocities are scaled so as to ensure global virial equilibrium, although we note that in the mass segregated case the initial conditions do not correspond to a solution of the steady state collisionless Boltzmann equation. We note that rapid collisional evolution of this small N system renders the question of whether the initial conditions are in precise equilibrium of little importance.
2.4 Initial speeds
Initially the cluster is assumed to be in virial equilibrium, which is characterized by the ratio of kinetic energy to potential energy . The velocity distribution is everywhere isotropic, and the generating function corresponding to a Plummer model is given by Aarseth et al. (1974).
2.5 Gas
Although the details of gas removal are not fully understood, observations indicate that clusters older than 5 Myr are rarely associated with molecular gas. This is the case of Cha. Mamajek et al. (2000) suggested that the superbubble formed by Sco-Cen OB winds and supernova remnants terminated star formation in the cluster and dispersed its natal molecular gas. This could have occured as recently as only a few Myr ago.
The gas is usually represented as an external potential in cluster evolution models, and is removed a few Myr after the star formation process has begun on a timescale of the order of a crossing time or less (e.g. Geyer & Burkert 2001; Kroupa et al. 2001; Kroupa & Bouvier 2003; Bastian & Goodwin 2006). At the end of the gas expulsion, the cluster is out of virial equilibrium and the subsequent evolution is a relaxation of the cluster as it attempts to return to virial equilibrium. This phase is found to last for about 20 initial crossing times (Geyer & Burkert 2001; Bastian & Goodwin 2006) but we expect it to be short ( Myr) in the case of Cha. In order to reproduce the observations, the initial configuration should be very compact, which suggests that will be very small initially.
In this study, we consider that the gas has already been removed and that the cluster has returned to virial equilibrium when we start our calculations. This means we start the models when Cha is already a few Myr old. The dynamical evolution of the cluster is then purely due to two-body interactions and that is simulated by our N-body numerical calculations. Therefore, the models do not have to run for 10 Myr (the maximum estimated age of Cha) but can be as short as a few Myr.
2.6 Binaries
No binaries are present in our calculations, even though there are eight known or probable binary systems in the Cha cluster. In order to be able to compare the observations to the simulations, the masses of the binary components are combined to make a single star. The simulations thus contain the correct mass in stars but omit interactions due to single-binary and binary-binary scattering. In a forthcoming paper, we shall include an input binary population and undertake a detailed comparison with observations of the binary systems in Cha.
| 50 | 30 | 40 | 60 | 70 | |||||||||||||||
|---|---|---|---|---|---|---|---|---|---|---|---|---|---|---|---|---|---|---|---|
| (pc) | 0.3 | 0.1 | 0.05 | 0.03 | 0.01 | 0.005 | 0.01 | 0.005 | 0.01 | 0.005 | 0.01 | 0.05 | 0.01 | 0.05 | |||||
| primordial | |||||||||||||||||||
| mass segregation | - | - | - | - | - | x | - | - | x | - | - | x | - | - | x | - | - | x | - |
2.7 Calculations
For each set of initial conditions summarized in Table 1, we made 100 realisations running an adapted version of the code NBODY3 written by Aarseth (1999). It is a direct, high precision N-body integrator that uses the sophisticated Kustaanheimo-Stiefel (1965) two-body regularization to treat close encounters. There is no softening parameter. In total, 1900 simulations have been performed.
The stellar system containing initially sources in the mass range is placed in the Galactic potential which defines a tidal radius
where and are the Oort’s constants, and is the cluster mass. When the distance of an object to the cluster centre is larger than , it is considered to have escaped from the cluster and it is removed from the calculation. Each calculation proceeds until the number of bound systems falls below 14 or until the age becomes larger than 10 Myr. The masses, positions and velocities of the systems which remain bound to the cluster are output every Myr. There are about 100 outputs per simulation on average, i.e. about 190000 output files were produced in total.
3 Results and analysis
The aim of the N-body simulations is to find initial conditions which are able to reproduce the actual state of the Cha cluster, when starting with a number of stellar systems imposed by a log-normal IMF. Each output at each time step is analysed and compared to the observations and several criteria have to be fulfilled before it is considered to be a good match.
3.1 Number of systems
First, we look at the number of bound systems located within 1 pc of the cluster centre in each output. If the number is larger than 22 or smaller than 14, we do not consider the result as acceptable.
We used this simple criterion alone for the first set of simulations starting with to estimate the initial cluster radius and the initial density required to lose the majority of the cluster members through dynamical interactions in less than 10 Myr. With pc, the cluster is too diffuse and the two-body encounters are not effective enough to eject members. Even after 10 Myr (the maximum duration of the simulations), more than half the systems () remained inside a radius of 1 pc for all of the realisations (see Fig. 1).


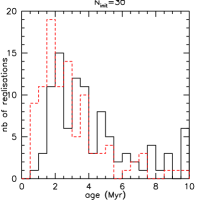
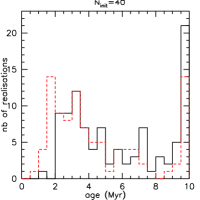
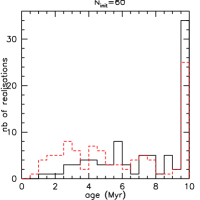
The situation improves when we start the calculations with a more compact configuration. As expected, more objects are found outside 1pc and the cluster population spreads out more quickly. With and pc initially, 21 realisations out of 100 end up with but none of them reach in less than 10 Myr. For pc and 0.005 pc however, most of the calculations are stopped because they get to the final state with before 10 Myr. We can see from Figure 2 that the more compact the configuration, the more quickly is attained. Bearing in mind that Cha has an age of Myr and that the cluster lost its gas component probably after a few Myr (corresponding to the time at which our N-body calculations start), the most favorable age at the end of our simulations to reproduce Cha should roughly be between 4 and 8 Myr. The results from Figure 2 suggest that the best initial cluster radius is between 0.01 and 0.005 pc. We thus eliminated all the other values for as initial conditions and we retained and 0.01 pc to run the second set of simulations with , 40, 50, 60 or 70 in order to find the best value of capable of matching the observed cluster characteristics.
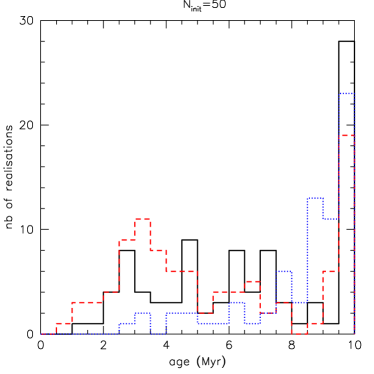
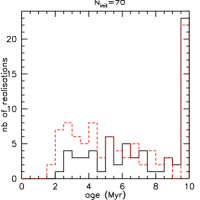
By applying the same test on the results of these simulations, we found that most of them reach before 10 Myr apart from and pc where only 66 calculations fulfill this criterion (see Table 2). This is due to the fact that there are more objects in the cluster and that it takes longer to remove most of them from the centre. This indicates that initial conditions with are not favorable to reproduce Cha. Then we looked at the age distribution of the calculations which ended with (Figure 3). We found that most clusters starting with lost their members very quickly. There is a broad peak around Myr in the distribution, which is probably too young to reproduce Cha. This suggests that simulations starting with are less likely to match the observations. However, all of the other initial conditions with , 50 or 60 and or 0.005 pc seem to be a good match to the observed properties according to the first criterion based solely on the number of objects left inside a radius of 1 pc.
| 30 | 40 | 50 | 60 | 70 | |
|---|---|---|---|---|---|
| pc | 97 | 99 | 94 | 87 | 66 |
| pc | 98 | 98 | 97 | 94 | 90 |
3.2 Number of stars with
When starting with a compact configuration ( pc), the two-body interactions are strong enough to eject a large number of objects in a few Myr so that less than 22 stars remain inside a radius of 1 pc from the cluster centre. However, we do not want this to be the case for the most massive stars as four objects with a mass between 1 and are observed in the cluster. Therefore the second criterion we used is to check that at least 3 stars more massive than 1.5 are included in , i.e. .
This second test allows us to eliminate more than half of the calculations that fulfill the first criterion, but does not really help us to define the best initial conditions as the trend is the same for all of them. In particular, the proportion of realisations which pass this test for a given is similar for or 0.01 pc (see Table 3).
| 30 | 40 | 50 | 60 | 70 | |
|---|---|---|---|---|---|
| pc | 33 | 51 | 44 | 45 | 39 |
| pc | 36 | 46 | 47 | 43 | 43 |
3.3 Number of remaining brown dwarfs
The third criterion is the comparison between the lower mass function resulting from the simulations and the observations. No brown dwarf or very low mass (VLM) star with has been found within 1.5 degrees of the cluster centre (Luhman 2004) and this has to be reproduced by the simulations. Therefore, we require that , the number of objects with inside 1.5 degrees, is 0 or 1 to consider a result as acceptable.
This is a very stringent constraint. We saw in Section 3.1 that it is not too hard to eject a large number of cluster members from the centre when starting with a very compact configuration. Almost all the realisations with or 0.005 pc end up with . It is already more difficult to keep the most massive stars in the core – only half of the realisations passed this test – but it is even harder to get all the very low mass objects far away from the cluster centre in less than 10 Myr. Table 4 gives the number of realisations which fulfill criteria 1 and 3 alone ( and ) and all of criteria 1,2 and 3 (, and ). We can see that the number drops down, around 10 or even less for some initial conditions, even if we relax the second test on . This suggests in particular that pc is not favorable to reproduce Cha, apart perhaps for .
| 30 | 40 | 50 | 60 | 70 | ||||||
|---|---|---|---|---|---|---|---|---|---|---|
| pc | 10 | 2 | 8 | 8 | 6 | 0 | 1 | 0 | 2 | 1 |
| pc | ||||||||||
| + mass seg. | 2 | 0 | 5 | 5 | 3 | 2 | 4 | 0 | 5 | 2 |
| pc | 12 | 12 | 12 | 10 | 4 | 2 | 10 | 8 | 11 | 2 |
The reason why it is so difficult to fulfill the three criteria at the same time is that the loss rate becomes roughly the same for all stars, independently of their mass, when the initial configuration is very compact. In order to keep the massive stars in the centre, the dynamical interactions should not be too strong to kick them out but then, even if some brown dwarfs escaped the cluster core, several still remain. In less than 10 Myr, the mass segregation favoring the evaporation of the lower mass objects does not really have time to occur. Simulations starting with a large number of systems like 60 or 70 have a larger number of brown dwarfs initially and it is very difficult to move them away in less than 10 Myr. Starting with pc instead of 0.01 pc helps to some extent as the configuration does not get too compact and the massive star are not removed from the core (which is the case for and pc).
In order to reproduce the mass distribution of Cha, one needs to lose more brown dwarfs and VLM stars than higher mass stars. We can therefore wonder if primordial mass segregation would help as it could yield such a preferential escape rate. However, this does not seem to be the case: the number of good realisations with pc does not really get larger with primordial mass segregation than without (see Table 4). In some cases ( and 40) it even gets smaller. This suggests that primordial mass segregation is not required to reproduce Cha. In order to check this result, we performed a last test on our simulations concerning the radial distribution of the cluster members.
3.4 Radial distribution
We searched the ROSAT All-Sky Survey (RASS) for cluster members with projected separations of up to 5 degrees. For 10 Myr-old stars T Tauri stars at pc, the RASS is sensitive to mid-K to early-M stars, i.e. to near-solar mass stars. To be candidate members, RASS-selected objects should show high levels of lithium indicative of young solar-type stars, photometry in agreement with the placement of known cluster members in colour-magnitude diagrams, and three-dimensional space motions consistent with ejection from the cluster in the past Myr, at a velocity less than km/s. Only rarely is this set of quantities complete and available with precision, e.g. optical photometry derived from plate scans is poor and radial velocities are usually absent. Proper motions are available from the UCAC2 catalogue, while a high-resolution spectroscopic survey of RASS sources across the Chamaeleon region was performed by Covino et al. (1997) which included a few known Cha stars. Within proper motion vectors mas/yr of the cluster’s proper motion of mas/yr (Mamajek et al. 1999), we found only a few additional RASS stars that might meet these criteria for membership. Stars ejected from the Cha with a velocity higher than 10 mas/yr, corresponding to 5 km/s at the distance of the cluster, will therefore not be sampled but our simulations show that they are rare. High velocity objects are ejected in the early stage of the cluster evolution and are already at a much larger distance than 5 degrees from the cluster center. While noting that these surveys are imprecise and/or incomplete, this outcome indicates there is not a large number of undiscovered solar-mass members within 5 degrees of the cluster core.
All of the cluster members are instead concentrated within 1 pc from the cluster centre and only a few additional solar type stars, if any, can be located within 5 degrees. Therefore we require that the number of stars with located between 1 and 8.75 pc ( degrees for a distance of 100 pc) from the cluster centre is less than 2. This constitutes our last criterion to check the ability of the simulations to reproduce the observations.
When performing this test on the realisations that already fulfill the three previous criteria, the number of remaining good results becomes very small for all the initial conditions (see Table 5). Again we find that starting with primordial mass segregation can help in some cases but it is not necessary. A few percent of the simulations starting with pc can always reproduce Cha independently of which suggests that this corresponds to the best initial condition for the cluster radius. Similarly, is the most favorable initial number of systems, as we obtain good results for both and 0.01 pc. An example of a good realisation resulting from a calculation started with and is shown in Figure 4.
| 30 | 40 | 50 | 60 | 70 | |
|---|---|---|---|---|---|
| pc | 0 | 2 | 0 | 0 | 0 |
| pc | |||||
| + mass seg. | 0 | 2 | 1 | 2 | 0 |
| pc | 4 | 5 | 2 | 2 | 1 |
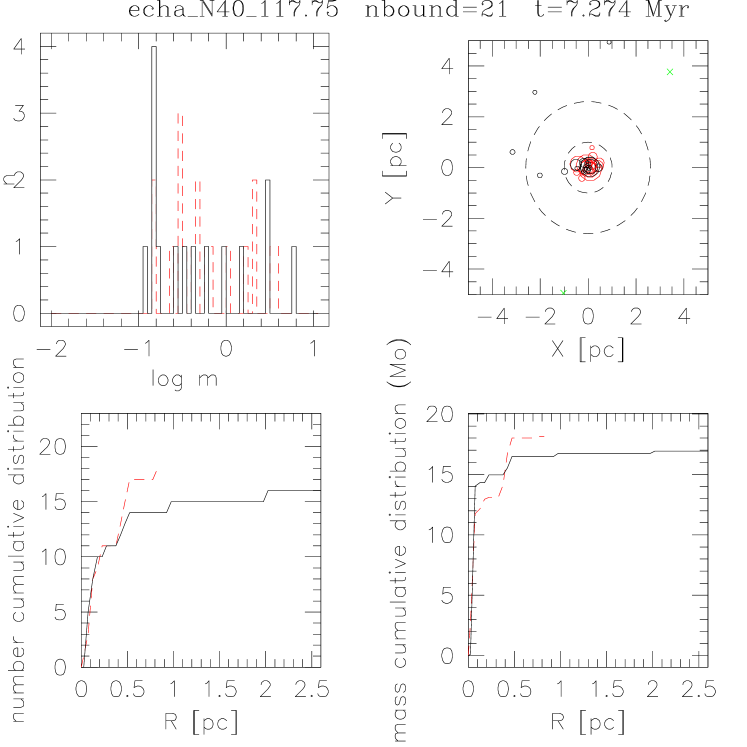
It is important to note, that even if only a few percent of the realisations fulfill all the above criteria, they remain valid across several time steps, i.e. the time for which we have a good match with the observations last for more than 1 Myr, typically at an age between 4 and 10 Myr. For example, in the realisation from which Fig. 4 is drawn, the simulated cluster remains in agreement with the observations between 3.5 and 10 Myr. The fact that such a dynamical state is not transient indicates that the calculations can mimic an observational state and that our simulations can effectively reproduce Cha. The difference between the age given by the simulation and the cluster age would then correspond to the time at which the gas was lost.
4 Conclusion and discussion
4.1 Summary of results
To summarize, the criteria we used to consider that a result is consistent with the observations are the following:
-
•
the number of objects within 1 pc of the cluster centre is at some point at Myr,
-
•
it includes at least 3 stars more massive than ,
-
•
there is no more than one brown dwarf or VLM star with within 1.5 degrees,
-
•
and less than 2 stars with are located between 1 and 8.75 pc (corresponding to 5 degrees at a distance of 100 pc).
We tested initial conditions with pc down to 0.005 pc and , 40, 50, 60 and 70 distributed according to a log-normal IMF. None of the simulations starting with pc give good results, except if pc and . For the calculations with pc however, there are always a few realisations that match the observations whatever the value of .
We thus found that it is effectively possible to reproduce Cha, which suggests in particular that the deficit of brown dwarfs and very low mass stars observed in the present day cluster mass function may not be due to a peculiar IMF but to dynamical evolution.
4.2 Compactness of the core
The most favorable initial condition in reproducing Cha is and pc, which corresponds to an initial central density of stars/pc3. In the example shown Fig.4, the total cluster mass at the beginning of the calculation is . This corresponds to an initial crossing time of 0.003 Myr which confirms a posteriori our assumption that the relaxation phase after the gas expulsion is very short ( Myr). According to the maximum stellar mass – cluster mass relation discussed by Weidner & Kroupa (2006), the mass of the embedded cluster at the origin of Cha was of the order of . This suggests that of the stars had been lost when the simulation starts and that the initial density may have been even higher than the value we obtain. Further calculations including the treatment of gas disruption (as well as an input binary population) will be done in a forthcoming paper to investigate this effect.
Nevertheless, a density of stars/pc3 is extraordinarily high and potentially makes Cha a unique region where star formation would have occurred in a very compact configuration. It is 5 orders of magnitude larger than the initial density taken by Kroupa & Bouvier (2003) to simulate the aggregates in Taurus and orders of magnitude larger than that used for the ONC and Pleiades models (Kroupa et al. 2001). In the simulations of massive star cluster formation performed by Bonnell et al. (2003), the stellar density attains a maximum of to stars/pc3 but this occurs only locally. At the cluster’s scale the density is typically stars/pc3, 3 orders of magnitude smaller than what we have. Observationally, such a high density has never been found in any embedded cluster but this may be due to a resolution effect. An initial radius pc corresponds to a half mass radius of 0.0035 pc or 7.4” on the sky assuming a cluster distance of 97 pc. At the distances to the youngest large-scale regions of star formation such as the Carina nebula at kpc, such a cluster would not be spatially resolved (or only marginally) by radio and IR observations and would instead be seen as a bright single source. High angular resolution observations (e.g. with ALMA) are needed to know if such clusters exist.
4.3 Binarity
For the large majority of systems, the smallest nearest-neighbour distance is obtained at and is around pc, which corresponds to AU. This is consistent with the typical ejection velocities of a few km/s (Fig. 5) and suggests that binaries cannot have separations larger than a factor of a few times less than this distance. Kroupa & Burkert (2001) performed N-body calculations of extremely compact clusters, with a central density similar to what we find for Cha. They start with a binary proportion and a uniform logarithmic period distribution in the range , with in days. This corresponds to a separation interval AU for an equal mass binary of a total mass . For an initial density stars/pc3, the binary proportion in this period range falls down to very quickly, in a timescale of the order of a crossing time. This is consistent with the results from Brandeker et al. (2006) who found an upper limit of 18% of wide binaries at projected separations AU, and also with the apparent absence of circumbinary disks in Spitzer IRS spectra of Cha (Bouwman et al. 2006).
4.4 Where are the escapers ?
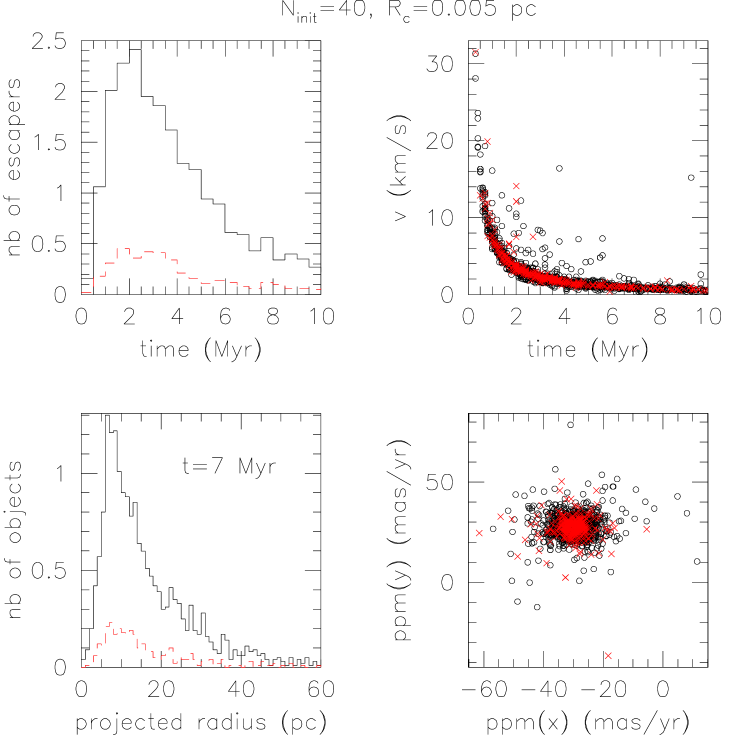
The objects that reach twice the tidal radius, i.e. to 8 pc depending on the simulations, escape the cluster and are removed from the calculations. But it is still possible to follow their evolution afterwards because we know their position, velocity and the time at which they escape. We simply assume that their movement is linear. The velocity of the escapers is decreasing with time as the density gets smaller and the interactions are softer. We find that it goes roughly with time and that it is independent of the object mass, i.e. the ratio of VLM objects to normal stars is roughly constant with radius and is consistent with the input IMF. All the systems that are ejected in the early phase (the first Myr) have a velocity of km/s or more which means that they are now more than 60 pc (or 30 degrees) away, given the age and distance of Cha. Most of the objects are ejected between 1 and 4 Myr with a velocity in the range km/s. If we assume that the simulations run for 7 Myr to reproduce the cluster as in the example shown in Fig. 4, they will be at a distance of at least 9 pc. The systems that are ejected later have a smaller velocity and remain closer to the cluster centre as there is less time to spread them away. Statistically, for all the simulations starting with and pc, we find a larger number of systems around pc in projected distance (or degrees for a cluster distance of 97 pc) whatever the time is (see Figure 5). The surface density is so small ( objects/pc2) that it would be quite difficult to observe this population photometrically. However proper motion surveys might be able to select for ejected cluster members as their projected velocities should be distributed around the cluster motion of () mas/yr, which is quite high. Recently Cruz et al. (2007) discovered a population of young ( Myr) brown dwarfs in the field. A few of them could come from Cha and would have been ejected early with a high velocity ( km/s).
Acknowledgements.
The authors wish to thank S. Aarseth for allowing us access to his N-body codes. WAL acknowledges support from UNSW@ADFA SRG and FRG grants, and visitor programmes at LAOG and IoA. We are also grateful for assistance from the Australian Research Council-sponsored Australia-France Cooperation Fund in Astronomy (AFCOP).References
- Aarseth (1999) Aarseth, S. J. 1999, PASP, 111, 1333
- Aarseth et al. (1974) Aarseth, S. J., Hénon, M., & Wielen, R. 1974, A&A, 37, 183
- Adams et al. (2006) Adams, F. C., Proszkow, E. M., Fatuzzo, M., & Myers, P. C. 2006, ApJ, 641, 504
- Allen et al. (2007) Allen, L., et al. 2007, Protostars and Planets V, 361
- (5) Andersen, J. 1991, A&ARv, 3, 91
- Bastian & Goodwin (2006) Bastian, N., & Goodwin, S. P. 2006, MNRAS, 369, L13
- Bonnell & Davies (1998) Bonnell, I. A., & Davies, M. B. 1998, MNRAS, 295, 691
- (8) Bonnell, I. A., Bate, M. R., & Vine, S. G. 2003, MNRAS, 343, 413
- Bouwman et al. (2006) Bouwman, J., Lawson, W. A., Dominik, C., Feigelson, E. D., Henning, Th., Tielens, A. G. G. M., & Waters, L. B. F. M. 2006, ApJ, 653L, 57
- Brandeker et al. (2006) Brandeker, A., Jayawardhana, R., Khavari, P., Haisch, K. E., Jr, & Mardones, D. 2006, ApJ, 652, 1572
- Chabrier (2003) Chabrier, G. 2003, PASP, 115, 763
- Carpenter (2000) Carpenter, J. M. 2000, AJ, 120, 3139
- Covino et al. (1997) Covino, E., Alcala, J. M., Allain, S., Bouvier, J., Terranegra, L., & Krautter, J. 1997, A&A, 328, 187
- (14) Cruz, K. L., Kirkpatrick, D. J., Burgasser, A. J., Looper, D., Mohanty, S., Prato, L., Faherty, J., Solomon, A. 2007, ASP Conference Series, astro-ph/0702034
- (15) Geyer, M. P., & Burkert, A. 2001, MNRAS, 323, 988
- Hillenbrand & Hartmann (1998) Hillenbrand, L. A., & Hartmann, L. W. 1998, ApJ, 492, 540
- Jilinski et al. (2005) Jilinski, E., Ortega, V. G., & de la Reza, R. 2005, ApJ, 619, 945
- (18) Köhler, R., & Petr-Gotzens, M. G. 2002, AJ, 124, 2899
- Kroupa (2001) Kroupa, P. 2001, MNRAS, 322, 231
- (20) Kroupa, P., & Burkert, A. 2001, ApJ, 555, 945
- Kroupa & Bouvier (2003) Kroupa, P., & Bouvier, J. 2003, MNRAS, 346, 343
- Kroupa et al. (2001) Kroupa, P., Aarseth, S., & Hurley, J. 2001, MNRAS, 321, 699
- (23) Kustaanheimo, P., & Stiefel, E. 1965, J. Reine Angew. Math., 218, 204
- Lada & Lada (2003) Lada, C. J., & Lada, E. A. 2003, ARA&A, 41, 57
- Lawson & Feigelson (2001) Lawson, W., & Feigelson, E. D. 2001, ASP Conf. Ser. 243: From Darkness to Light: Origin and Evolution of Young Stellar Clusters, 243, 591
- Lawson et al. (2002) Lawson, W. A., Crause, L. A., Mamajek, E. E., & Feigelson, E. D. 2002, MNRAS, 329, L29
- Luhman (2004) Luhman, K. L. 2004, ApJ, 616, 1033
- Luhman & Steeghs (2004) Luhman, K. L., & Steeghs, D. 2004, ApJ, 609, 917
- Lyo et al. (2003) Lyo, A.-R., Lawson, W. A., Mamajek, E. E., Feigelson, E. D., Sung, E.-C., Crause, L. A. 2003, MNRAS, 338, 616
- Lyo et al. (2004a) Lyo, A.-R., Lawson, W. A., & Bessell, M. S. 2004a, MNRAS, 355, 363
- Lyo et al. (2004b) Lyo, A.-R., Lawson, W. A., Feigelson, E. D., & Crause, L. A. 2004b, MNRAS, 347, 246
- Lyo et al. (2006) Lyo, A.-R., Song, I., Lawson, W. A., Bessell, M. S., & Zuckerman, B. 2006, MNRAS, 368, 1451
- Mamajek et al. (1999) Mamajek, E. E., Lawson, W. A., & Feigelson, E. D. 1999, ApJ, 516, L77
- Mamajek et al. (2000) Mamajek, E. E., Lawson, W. A., & Feigelson, E. D. 2000, ApJ, 544, 356
- Moraux et al. (2007) Moraux, E., Bouvier, J., Stauffer, J. R., Barrado y Navascuès D., Cuillandre J.C. 2007, A&A, submitted
- Muench et al. (2002) Muench, A. A., Lada, E. A., Lada, C. J., & Alves, J. 2002, ApJ, 573, 366
- Song et al. (2004) Song, I., Zuckerman, B., & Bessell, M. S. 2004, ApJ, 600, 1016
- (38) Weidner, C., & Kroupa, P. 2006, MNRAS, 365, 1333