EAS Longitudinal Development and the Knee111Talk given at 30th ICRC (2007), Merida, Mexico
Yuri V. Stenkin
Institute for Nuclear research of Russian Academy of Sciences
60th October anniv. prospect,
7a, Moscow 117312, Russia
e-mail: stenkin@sci.lebedev.ru
Abstract
It is shown that Extensive Air Shower (EAS) longitudinal development has a critical point where an equilibrium between the main hadronic component and the secondary electromagnetic one exhibits a brake. This results in a change of slope in quasi-power law function . The latter leads to a knee in the EAS size spectrum at primary energy of about 100 TeV/nucleon. Many “strange” experimental results can be successfully explained in the frames of current approach.
1 Introduction
In 1958 there was claimed [1] the existence of the “knee” in primary cosmic ray spectrum and its possible explanation by an existence of Galactic and Extragalactic cosmic rays. It should be noted that in the cited paper there was no any doubt that visible break in EAS size spectrum could be connected with any other reason but with primary spectrum steepening. At those times the recalculation from EAS size to primary energy was very simple. People merely used a constant coefficient for recalculation from EAS size at maximum to primary energy. Other ground level experiments later confirmed the “knee” existence in EAS size spectrum while direct measurements of primary cosmic ray nuclei spectra at satellites and balloons made up to energy 1 PeV do not confirm deviation from a pure power law at energies above 10 TeV. All experimental data confirming the “knee” existence are originated from indirect measurements using the EAS technique. Some physicists tried to explain the visible knee by a dramatic change in parameters of particle interactions [2, 3, 4]. Absolutely new approach to this problem has been proposed in 2003 and details of the approach can be found elsewhere [5]. It has been also shown [6, 7] that a lot of experiments contradict the hypothesis of the “knee” in primary spectrum and its astrophysical origin.
2 The EAS method
An advantage of the EAS method is a possibility to work up to the highest energy. But, the indirect measurements have to be recalculated to primary spectrum. This is a very complicated and model dependent problem. If the primary spectrum follows a power law function of a type: I and a secondary component Nx also follows a power law: N, then IN, where . If a break in a power law of experimental data distribution exists , then a change in any of the two indices ( or ) may be responsible for this.
Suppose the primary spectrum index changes at a point E0=Eknee from to +. Then, one could expect a predictable break in the index for each component: =. Typical values for are the following: e1.1-1.25 for electron component and h0.8 - 0.9 for hadronic and muonic components. If =0.5, then expected values are: e0.44 for electrons and h0.6 for hadrons and muons. But this contradicts observations (see [6] and references there) where the knee in muonic and in hadronic components is equal to only h0.1-0.2.
The problem of primary spectrum recovering from observable EAS parameters is additionally complicated due to uncertainties in primaries mass composition. It is very difficult to define primary particle mass using traditional EAS method. Only hybrid arrays such as Tibet AS or Chacaltaya array could more or less adequate solve this problem using emulsion chambers for primary mass separation. This problem is connected very tightly with the ”knee” problem. If one accepts a priori a hypothesis of the charge- or mass-dependent knee in primary spectrum then he accepts also a priori the change of mass composition. If experimental data are processed under this hypothesis then both the knee and chemical composition change will be “shown” by these data after such processing.
3 The knee in PeV region: what is responsible for it?
The question put above could be split in two parts: 1. Is the knee origin astrophysical or methodical (or any)? 2. Does it caused by proton or iron primaries? I’ll try here to answer the second part question. As it has been shown in our previous works [5] there should be observed a break in EAS size spectrum at primary energy of 100 TeV/nucleon at sea level. The origin of the “knee” is a break of equilibrium (see [8]) between hadronic and electromagnetic components at a point where the number of cascading hadrons becomes close to 1. This point is critical one for EAS development because the number of particle is discreet value and less than 1 is only 0. Therefore, below this point the cascade development follows pure electromagnetic scenario and all EAS parameters change dramatically. Due to spread of primary masses from A=1 to A=56 there should be observed 2 “knees”: “proton knee” at 100 TeV and “iron knee” at 5 PeV. That means the visible knee in PeV region is connected with iron primary. The knee positions in shower size are equal to and consequently. These values are more or less constant in the current approach and depend weakly on the altitude. But, the corresponding primary energies are sure different. Recent results of Tibet AS [9] on proton and helium spectra are not understandable in the frames of commonly used astrophysical knee hypothesis. But, it becomes absolutely clear in the frames of current approach. Actually, this hybrid experiment uses different sub-arrays for different purposes: emulsion chambers are used for core location and primary mass selection, while the EAS size is measured by the traditional EAS array. As we noted above, the “proton knee” position for Tibet altitude should be also close to 100 TeV. Therefore, the EAS size spectrum to the right of this point (their threshold is equal to 200 TeV) should be steep. To demonstrate this we performed Monte Carlo simulations with CORSIKA codes.
4 Results of simulations
The latest version of CORSIKA program[10] were used for calculations(v.6.501). Standard HDPM as well as VENUS and DPMJet
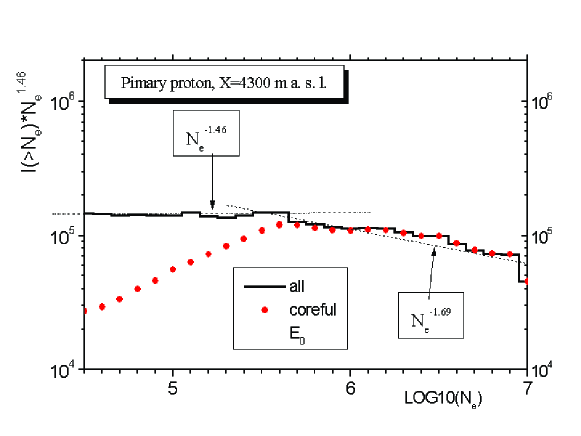
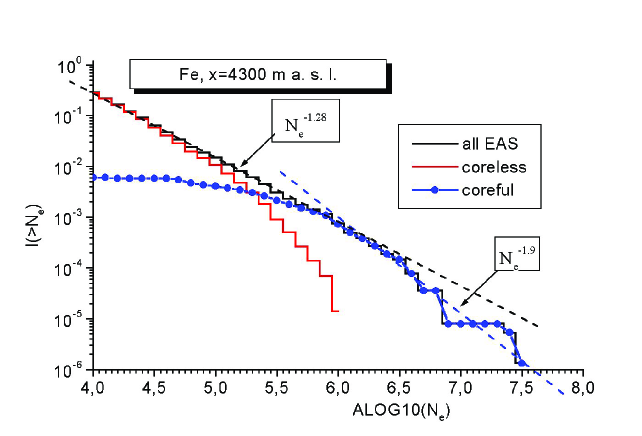
models were used for high-energy hadron interactions and no significant difference were seen. Simulations were performed for proton and iron primary nuclei with the pure power law energy spectrum having the slope for altitudes from 100 m to 4.3 Km a. s. l. The number of all electromagnetic particles ( and ) summarized inside radius 1000 m were assigned to . Note that such a definition is close but not equal to the usually obtained by experimenters from the NKG-function. As one can see from Fig.1, the distributions at altitude 4.3 Km have clear visible kinks at for protons and for iron. It is seen that the break of slopes coincides with the appearance of coreful showers and disappearance of coreless EAS’, the curves for those are also shown. This graph shows that EAS size spectrum slope becomes steeper at (corresponding ). Above 200 TeV the slope is steep enough to explain the Tibet AS data: if one takes then primary spectrum slope . This is very close to the value obtained by Tibet AS. In other words, the spectrum slope measured by the Tibet AS experiment being recalculated to primary index taking current approach into account, is very close to . Therefore, this result is in agreement with direct spectrum measurements.
A visible kink for iron primaries coincides with the “knee” position as one can see in fig. 1 lower panel. In this point our conclusion is the same as in [9]. Similar shape of the distributions can be obtained for any other altitudes, but at different primary energies. The effect depends also on the radius of integration (on the array dimensions): the smaller radius, the bigger is effect. Corresponding curves for muons and hadrons have no visible ”knees” [5].
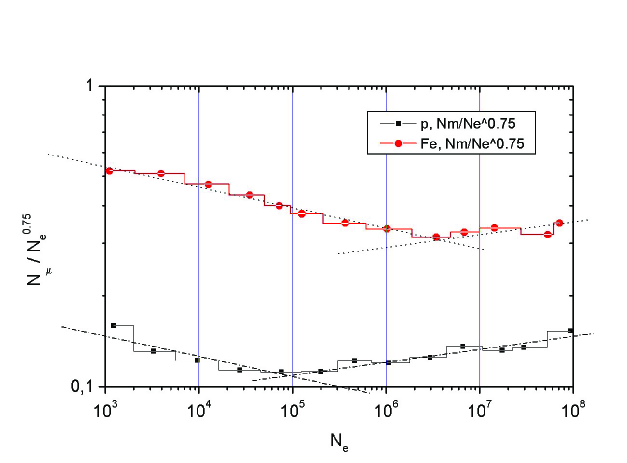
Due to different behavior of different components as a function of primary energy, the correlation plot between different EAS components also exhibits the ”knee” as one can see in Fig.2. We plot these distributions divided by to emphasize the slope change and we made the calculations for another altitude to show that the effect exists at any altitude. And again the “knees” are visible. Only its positions are little bit different for another altitude. Similar curves obtained experimentally are usually interpreted as an evidence of the fact that primary mass composition becomes heavier while here, we obtained it for constant mass composition and for pure power law spectra. This is an example how experimental data could be erroneously understood and interpreted if one supposes a priori the knee existence.
5 Summary
EAS size spectrum has ”a knee” at any altitude even for
pure power law spectrum of primary cosmic ray.
The index of all-particle primary cosmic ray
energy spectrum does not likely change significantly in a range of 0.110 PeV.
The “knee” observed experimentally in electromagnetic
EAS component is caused by EAS structure change at energy
where the number of cascading
hadrons becomes equal to zero. Below this energy, EAS’s at sea
level are mostly coreless while above this
threshold EAS’s are mostly coreful.
Primary particle mass composition ”change” measured by
the EAS method using ratio is probably methodical
one, while the composition of primaries at the top of atmosphere
could be constant.
The steep spectra of protons and -particles
measured by Tibet AS Group confirm our hypothesis that EAS size
spectra must be steep above the threshold of 100 TeV /
nucleon, while the primary spectrum does not change a slope.
We coincide with Tibet AS in the conclusion that the
“knee” in PeV-region is connected with iron nuclei.
Acknowledgements
I’d like to thank once again the Developers of CORSIKA program for very useful instrument for EAS study.
The work was supported in part by RFBR grants Nos 05-02-17395 and 07-02-00964, by the Scientific School Support grant NSh-4580.2006.2 and by the RAS Basic Research Program ”Neutrino Physics”.
References
- [1] Khristiansen, G.B. and Kulikov, G.V., Sov. J. JETP, 35 (1958)
- [2] Nikolsky, S.I. Nucl. Phys. B (Proc. Suppl.) 39A, (1995), 105.
- [3] Kazanas, D. and Nikolaidis, A.Proc. of ICRC2001, Hamburg (2001), 1760.
- [4] Petrukhin, A.A. Proc of ICRC2001, Hamburg, (2001), 1768.
- [5] Stenkin, Yu.V. Mod. Phys. Lett. A, (2003), 18, 1225; Proc. of 28 ICRC, Tsukuba, p. 267; Yadernaya Fizika, (2007), in press
- [6] Stenkin, Yu.V. Nucl. Phys. B (Proc. Suppl.), (2006), 151, 65.
- [7] Stenkin, Yu.V.. Proc. of 29th ICRC, Pune, (2005), v. 6, p. 261.
- [8] Zatsepin, G.T. Dokl. Akad. Nauk SSSR, v.67, No 6, (1949),993.
- [9] Amenomori, M. et al. Proc. of 29th ICRC, Pune, (2005), v. 6, 177.
- [10] Heck, D. et al. FZKA report 6019, Forshungzentrum Karsruhe (1998).