E-mail: kolik@lebedev.ru, Fax: +7 495 1326644
Pacs: 32.70.Cs, 32.10.Fn, 32.80.Pj
Blue laser cooling transitions in Tm I
Abstract
We have studied possible candidates for laser cooling transitions in 169Tm in the spectral region 410 – 420 nm. By means of saturation absorption spectroscopy we have measured the hyperfine structure and rates of two nearly closed cycling transitions from the ground state to upper states at nm and at 420.4 nm and evaluated the life times of the excited levels as 15.9(8) ns and 48(6) ns respectively. Decay rates from these levels to neighboring opposite-parity levels are evaluated by means of Hartree-Fock calculations. We conclude, that the strong transition at nm has an optical leak rate of less then and can be used for efficient laser cooling of 169Tm from a thermal atomic beam. The hyperfine structure of two other even-parity levels which can be excited from the ground state at 409.5 nm and 418.9 nm is also measured by the same technique. In addition we give a calculated value of s-1 for the rate of magnetic-dipole transition at 1.14 m between the fine structure levels of the ground state which can be considered as a candidate for applications in atomic clocks.
1 Introduction
During the last decade, significant progress has been achieved in laser cooling of lanthanides (rare-earth elements). Laser-cooled lanthanides are effectively used in such fundamental fields as the study of cold collisions Santos , Bose-Einstein condensation Takasu , ultra-precise atomic clocks Taichenachev and also open new perspectives for implementation in nano-technology Hill and quantum information Monroe . In contrast to recently demonstrated method of buffer gas cooling and trapping of lanthanides in a magnetic dipole trap Hancox , laser-cooled atoms are easily manipulated by the help of light fields Katori and can be studied in a nearly perturbation-free regime.
Compared to atoms from the alkali and the alkali-earth groups, spectra of lanthanides are significantly richer due to the presence of the 4f shell electrons. Ytterbium with its closed 4f14 shell possesses the simplest level structure and has been successfully laser cooled at the wavelength of 398.9 nm (see e.g. Maruyama ). In 2006 cooling of atomic erbium was reported McClelland at the wavelength of 401 nm. Both these strong cooling transitions are not completely closed and their upper levels also decay to the neighboring opposite-parity levels thus taking a part of population out from the cooling cycle (optical leaks). In the case of erbium (4f126s2), evaluation of a leak rate is a complex task due to a rich level structure. Still, it has been shown experimentally, that it is possible to cool and to trap up to erbium atoms in a magneto-optical trap (MOT) even without a repumper laser.
In this paper, we analyze the possibility to cool atomic thulium which resides between Er and Yb in the periodic table. Since there is only one unfilled electron in the 4f shell (the ground state of Tm has a configuration of ), its electronic structure is more complex than that of Yb, but still is one of the simplest among lanthanides. Thulium has only one stable isotope 169Tm with a nuclear spin number of which results in a simple doublet hyperfine splitting of each electronic level. The monoisotopic structure should increase a MOT loading rate, while the non-degenerate Zeeman structure of the ground level enables sub-Doppler cooling schemes.
The ground state of 169Tm consists of two fine structure levels with total electronic momentum numbers of and which are separated by Hz (the corresponding transition wavelength is m). The excited ground-state level with is metastable and one can expect its life time to be on the order of a few fractions of a second Ban . Due to the shielding by the outer closed 6s2 shell Hancox ; Aleksandrov , it is expected that interrogation of these forbidden transitions even in dense laser-cooled atomic clouds will allow one to build precise optical atomic references possessing a high short-term stability.
In this paper we describe our experimental study of two candidates for cooling transitions from the ground state to the excited states at nm and at 420.4 nm (Section II). The hyperfine structure (HFS) of these levels are accurately determined from the experiment. Simultaneously we have for the first time determined the HFS of two other excited levels which are within reach of our laser system. From the analysis of saturation absorption spectra we have experimentally determined lifetimes of the excited levels and compared them with existing data Wickliffe . With the relativistic Hartree-Fock code of Cowan Cowan , optical leak rates are quantitative evaluated. Results of this analysis are presented in Section III. In Section IV we discuss realistic laser cooling schemes for thulium. In the last Section we analyze the magnetic dipole transition at 1.14 m with the help of the Cowan code and also with the flexible atomic code (FAC) of Feng FAC .
2 Saturation absorption spectroscopy
To efficiently laser cool an atomic sample one has to choose a strong closed cycling transition which can be excited by a powerful laser source. In the case of thulium, we restrict our consideration to transitions from the ground state level to the excited levels of the opposite parity with . Such a choice allows the use of cycling transitions between the hyperfine components of the lower and upper levels . In this case, electric dipole transitions from upper levels to other fine and hyperfine sublevels of the ground state will be forbidden by the selection rules.
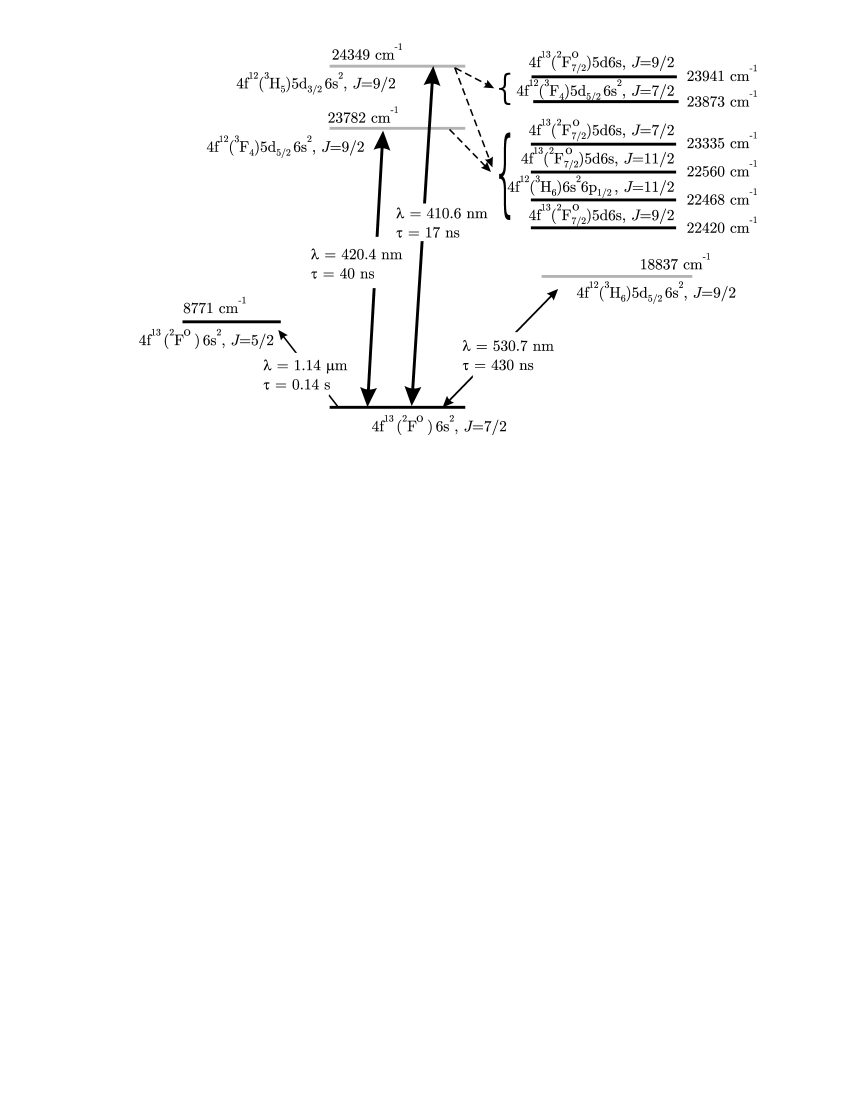
Among excited levels in Tm one can select three candidates favorable for laser cooling NISTdatabase : (), () and (), which are schematically presented in Fig. 1. The green transition at nm can be excited by the second harmonic of a laser on gadolinium scandium gallium garnet activated by neodymium (Nd:GSGG) Zharikov . The transition is completely closed in the electric-dipole approximation which removes the problem of optical leaks. Unfortunately, the low rate of prevents using this transition for efficient loading a MOT from a thermal beam (an atom with initial velocity of 200 m/s can be decelerated at a distance not shorter then 3 m). Nevertheless it can be used after cooling an atomic sample at other strong transition. For example, such a blue and green MOT sequence is implemented for cooling ytterbium to sub-mK temperatures Maruyama .
Other transitions at 420.4 nm and 410.6 nm can be excited by the second harmonic of a titanium:sapphire (Ti:Sa) laser, the second harmonic of an infrared diode laser or directly by a nitride diode laser (see e.g. Hult ). According to Wickliffe these transitions have rates of and respectively which should be sufficient to decelerate hot atoms at a distance of a few tens of centimeters. The transitions are not completely closed. The upper levels are coupled to neighboring opposite-parity levels as shown in Fig.1. To choose the best candidate for cooling transition it would be desirable to evaluate optical leak rates.
The hyperfine structure of excited levels in thulium is measured by different methods and the following references summarize most of the available data Childs ; Leeuwen ; Pfeufer ; Kroeger ; Basar . The level with the energy has been previously studied by the optogalvanic spectroscopy in the hollow cathode discharge Kroeger and its HFS frequency has been determined. We use saturation absorption spectroscopy in counter-propagating beams of the same frequency to measure the HFS of the levels which can be excited from the ground state in the wavelength region 410 – 420 nm. The experimental setup is presented in Fig. 2.
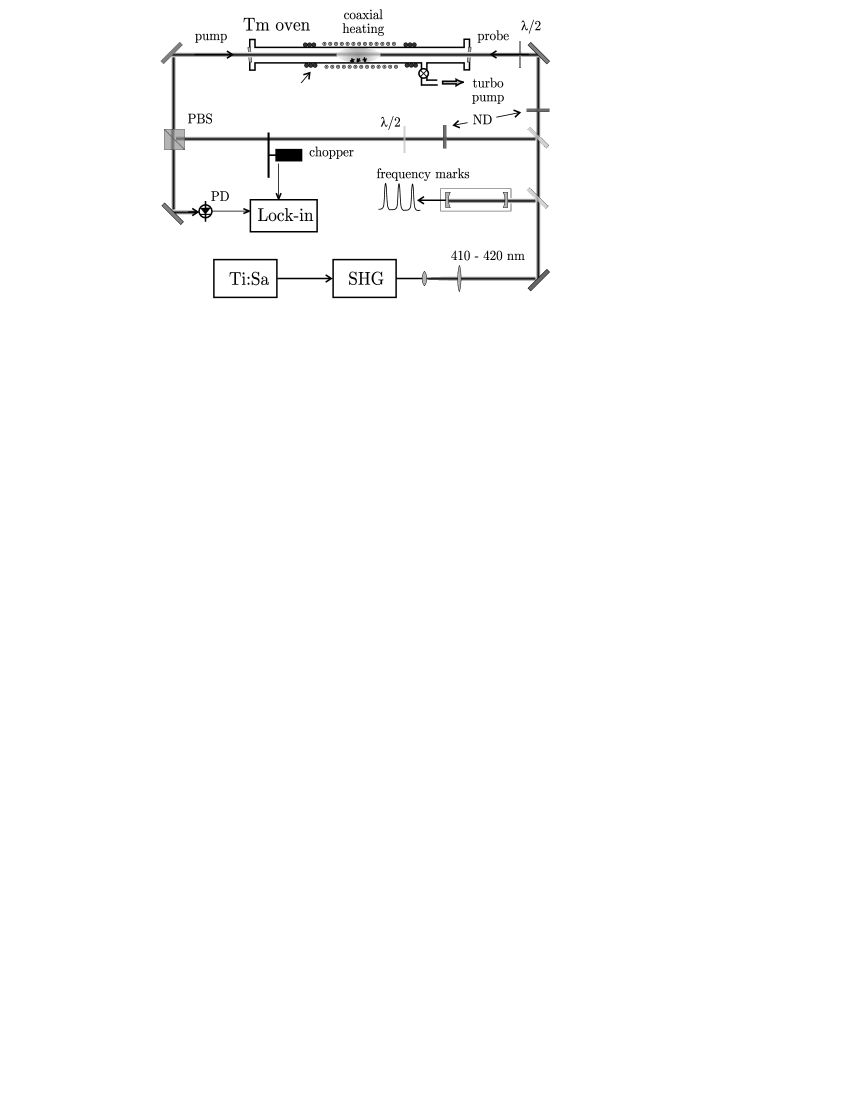
Radiation of a Ti:Sa laser (MBR-110, Coherent Inc.) is frequency doubled in a lithium triobate crystal (LBO) placed in an external cavity (MBD-200, Coherent Inc.). The laser system produces up to 150 mW of radiation in the spectral region 400 – 430 nm. The spectral line width of the Ti:Sa laser is specified as 100 kHz which is achieved by locking the laser to a stable high-finesse Fabry-Perot cavity. We tune the laser to the atomic transition with the help of a home-made wavemeter. The astigmatic blue laser beam is expanded to about (at level) and is split into saturation and probe beams. The beams are carefully aligned in the counter-propagating configuration with the angle between them less than . The probe beam is modulated by a wheel chopper at 850 Hz, and the signal from the probe beam is recorded using the lock-in technique by a computer. The beams have orthogonal linear polarizations (linlin) and are separated on a polarization beam splitter. Intensities of the beams can be varied by absorptive neutral density filters. They are measured by a calibrated power meter at the cell entrance. The laser frequency detuning is controlled by a stable confocal interferometer with a free spectral range of 75 MHz. Frequency marks are recorded simultaneously with absorption spectra.
Thulium vapor is produced in a stainless steel oven of 20 mm in diameter. The central part can be heated by a coaxial cable to 1100 K. Current flowing through the central heating wire of the cable returns back through its outer shielding which significantly cancels out an induced magnetic field. External coils in Helmholtz configuration allow compensation of the laboratory magnetic field to less then 1 G. The melting point of thulium is 1818 K, but a vapor pressure of 10-3 mbar can be reached already at about 1000 K. To prevent heating of the whole cell, its central part is surrounded by water cooling coils. The cell is pumped out by 20 l/s turbo-molecular pump. Thulium chunks of a few hundred milligrams are placed in the central part of the oven. After heating to 1000 K, we observe the absorption of 50% in the center of the Doppler-broadened line at 410.6 nm. The pipe can stably operate in this regime for days.
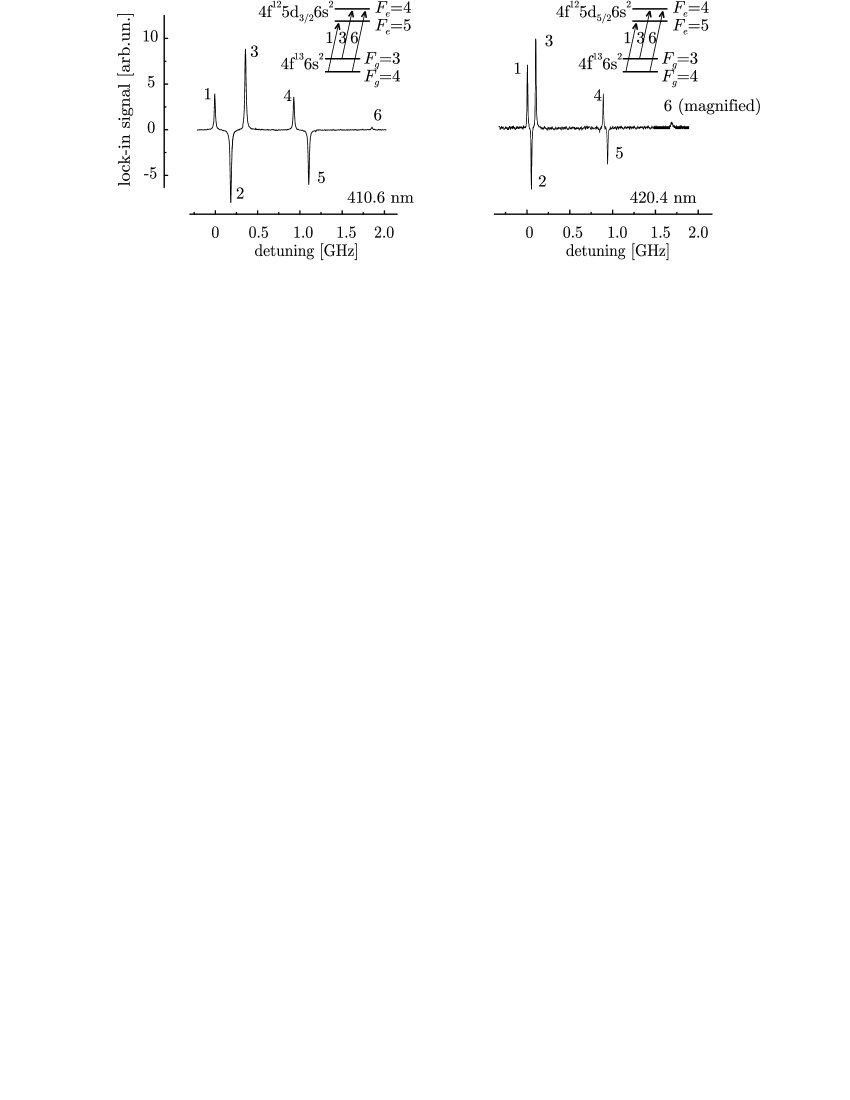
Figure 3 presents saturation absorption spectra for the transitions at 410.6 nm and 420.4 nm. Besides saturation absorption lines formed by atoms with zero velocity projection on the beam axis, we observe cross-over resonances of different signs. Identification of hyperfine spectra is presented in the insets of Fig. 2. The accurate result of MHz for the HFS of the ground state measured by Childs et al. Childs is used to calibrate the the free spectral range of the Fabry-Perot cavity. Here we will use negative frequencies for the HFS if the Fermi energy is negative.
To determine the hyperfine structure frequency of the excited levels we fit the recorded spectra by a multi-peak Lorentzian function and use the frequency ruler of the Fabry-Perot cavity. Uncertainty of the measurement is the sum of the statistical uncertainty of 0.5 MHz and the systematic contribution of 0.5 MHz. The latter mainly results from the asymmetry of trasmission peaks of the Fabry-Perot cavity and is evaluated by measuring positions of the cross-over resonances. No dependence of the HFS frequencies on light intensity is observed. Results of the measurement are presented in table 1.
It is interesting to note that the hyperfine splitting of upper and lower levels of both candidates for cooling transitions are similar and differ for only a few tens of natural line widths. It can result in the situation, that a laser tuned to the red wing of the the cooling transition 1 (Fig. 3) will simultaneously transfer population from via the transition 3. Due to the relatively small detuning, the process will have a higher probability than the non-resonance population transfer to the level via one. Laser cooling without repumping has been successfully demonstrated in erbium McClelland .
| Energy, | Level | HFS splitting, | Reference | |
|---|---|---|---|---|
| cm-1 | MHz | |||
| 0 | Childs | |||
| 23 781.698 | 9/2 | this work | ||
| 23 873.207 | 7/2 | this work | ||
| 24 348.692 | 9/2 | Kroeger | ||
| this work | ||||
| 24 418.018 | 5/2 | this work |
The cooling transition rate is a crucial parameter which defines the maximal achievable deceleration of atom as well as the Doppler cooling limit McClelland1 . We use the setup shown in Fig. 2 to measure the natural line width of candidates for cooling transitions at 410.6 nm and 420.4 nm (see insets in Fig.3). Being excited at these nearly closed cycling transitions, thulium behaves as a two-level system which allows us to neglect optical pumping and coherent effects Letokhov .
We performed a set of measurements varying saturation and probe power densities. The power of 1 mW approximately corresponds to the on-axis power density of about 3 mW/cm2. Results are presented in Fig. 4, where the measured line width is plotted against the excitation power . Again, each recorded spectrum has been fitted by a multi-peak Lorentzian function with independent fit parameters for each peak. In the case of a weak probe beam, the line width is given by the following expression Pappas ; Ohshima
| (1) |
where is the natural line width and is an excitation power density. The saturation power density is defined as . In the general case the expression is more complex Letokhov , but the relation remains valid.
We fit the data presented in Fig. 4 by the function (1), where and are taken as fit parameters. Due to uncertainty in the power density measurement and inhomogeneous intensity profile we have to use the second fit parameter for . Line widths extrapolated to zero intensity are MHz for the transition at 410.6 nm and MHz for the corresponding hyperfine transition at 420.4 nm. The inhomogeneous radial intensity distribution should modify the fit function in a complex way. But substitution of the fit function (1) by a linear regression or by a function changes extrapolated values for less than 0.2 MHz. We use this value as an uncertainty resulting from our unprecise knowledge of the fit function. Derivation of true saturation intensity and from the second fit parameter is hindered by the complex radial intensity distribution in the laser beams.
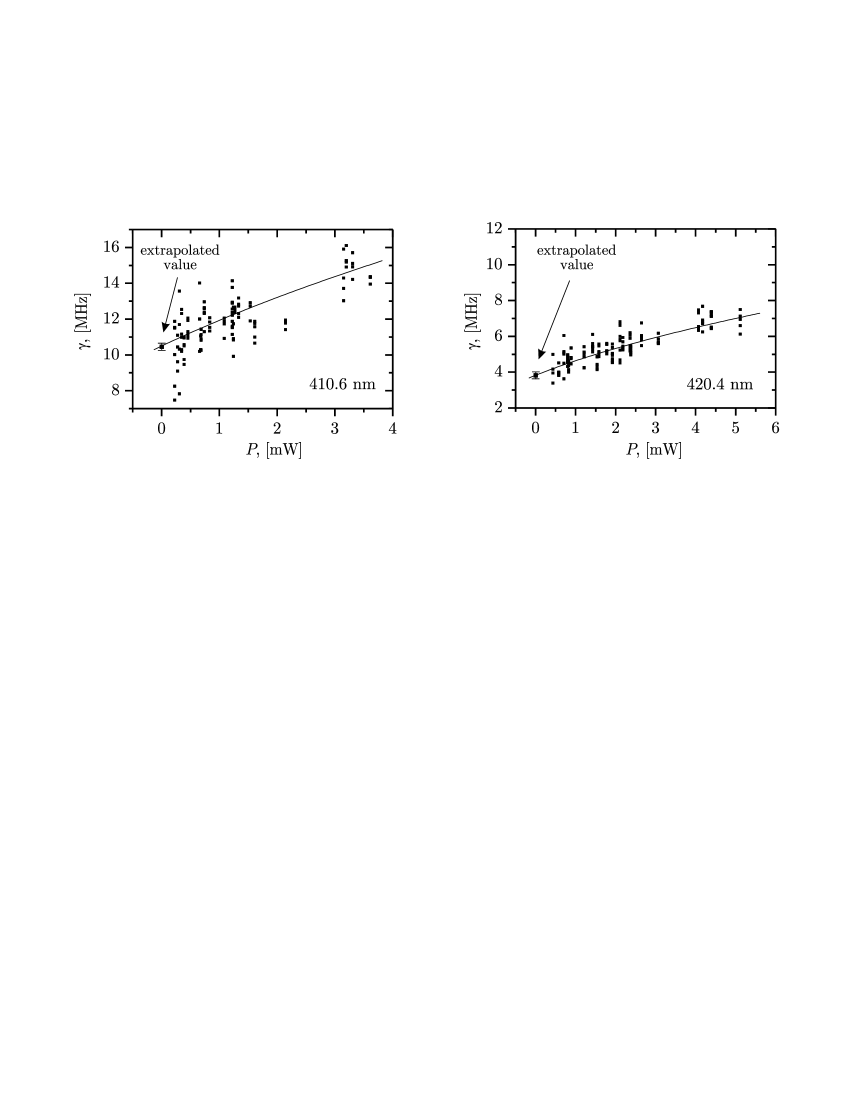
To evaluate the natural line widths of the transitions we correct the obtained results for systematic broadenings. The main contribution results from the laser line width which we evaluate as 0.2(2)MHz according to the manufacturers specification (we doubled the line width of the Ti:Sa laser assuming that the main noise contribution results from slow long-term correlated acoustic vibrations Rytov ). The next important broadening mechanism is the time-of-flight broadening which we evaluate as 0.1(1) MHz. The geometrical broadening resulting from the finite angle between the beams and pressure shift can be conservatively estimated as 10(10) kHz and 50(50) kHz respectively. The Zeeman splitting of -components in a residual magnetic field is small due to very similar magnetic -factors of the lower and the upper levels. The splitting of -components is about 1.5 MHz/G. For magnetic fields lower than 1 G the Zeeman splittings is relatively small () and can be considered similar to inhomogeneous spectral line broadening. The following expression for the resulting line profile is valid which is similar to the case of Voigt function, when the contribution of the Doppler width is much less than of the Lorentzian one. Thus the Zeeman broadening of the transitions can be evaluated as 0.1(2) MHz. Taking all these contributions into account we finally get the natural line width of MHz for the transition at 410.6 nm and 3.3(4) MHz for the transition at 420.4 nm. Our results are in a good agreement with transition rates given in Wickliffe ; NISTdatabase and are summarized in the next Section in table 2.
3 Optical leaks
The candidates for cooling transitions at nm and nm are not perfectly closed. The excited levels and can decay via electric dipole transitions to 6 and 4 neighboring opposite-parity levels respectively as shown in Fig. 1. A crucial parameter for a cooling transition is a branching ratio
| (2) |
where is the decay rate to the ground state and ( for the 420.4 nm transition or for 410.6 nm one) are decay rates via other dipole transitions. In the expression (2) only the decay rate to the ground state can be taken from Wickliffe ; NISTdatabase while all other values remain unknown.
We evaluated the decay rates using the relativistic Hartree-Fock code of Cowan Cowan . The excited states have mixed electronic configurations (see NISTdatabase ), and we took into account a few leading configurations for each level. Since it is difficult to achieve correct energies for all levels simultaneously, we performed two sets of calculations. In the fist set, the experimental energy of level ( cm-1) was taken as a reference for calculations after which the required decay rates were calculated. Similar evaluations where made for the level ( cm-1). Results of calculations are summarized in table 2.
| , | , | , | , | , | , | (this work), | ||
| cm-1 | cm-1 | cm-1 | cm-1 | s-1 | s-1 | s-1 | ||
| 0.000 | 0.000 | 3.5 | 24.341 | 24.349 | 4.5 | 2.13 | 6.36(30) | |
| 22.166 | 22.420 | 4.5 | 24.341 | 24.349 | 4.5 | 4.44 | ||
| 22.243 | 22.468 | 5.5 | 24.341 | 24.349 | 4.5 | 1.75 | ||
| 22.417 | 22.560 | 5.5 | 24.341 | 24.349 | 4.5 | 1.82 | ||
| 22.905 | 23.335 | 3.5 | 24.341 | 24.349 | 4.5 | 1.38 | ||
| 23.622 | 23.941 | 4.5 | 24.341 | 24.349 | 4.5 | 1.54 | ||
| 23.893 | 23.873 | 3.5 | 24.341 | 24.349 | 4.5 | 2.95 | ||
| 0.000 | 0.000 | 3.5 | 23.797 | 23.782 | 4.5 | 2.27 | 2.43(12) | |
| 22.166 | 22.420 | 4.5 | 23.797 | 23.782 | 4.5 | 1.88 | ||
| 22.243 | 22.468 | 5.5 | 23.797 | 23.782 | 4.5 | 1.81 | ||
| 22.417 | 22.560 | 5.5 | 23.797 | 23.782 | 4.5 | 8.64 | ||
| 22.905 | 23.335 | 3.5 | 23.797 | 23.782 | 4.5 | 1.13 |
Calculated energies are in a good agreement with experimental data. Comparing calculated rates of strong transitions to the ground state with ones from Wickliffe ; NISTdatabase we observe a significant discrepancy for the transition at 410.6 nm (the first row in table 2). We will take it as a scale for the accuracy of our evaluation. Note, that the transition demonstrates the exceptionally high rate of about s-1.
Using the results of table 2 we evaluate the branching ratios according to equation (2):
| (3) | |||
| (4) |
where the uncertainties are evaluated according to the discrepancy between calculated and experimental values. To get these values we take experimental rates for , while other rates are taken from calculations. The given uncertainty is a realistic estimation for the accuracy of our calculations. It would be necessary to mention that not all of the atoms which have decayed from the excited odd levels to the neighboring even levels are taken away from a laser cooling cycle. Part of them can return back to the ground state by cascade transitions while another part sticks in metastable levels. Calculations of cascaded transitions are a complex task, and it is reasonable to use the approach given in the paper McClelland , where these excited levels are considered as a “reservoir” slowly feeding the ground state. We use evaluations (3), (4) as upper limits for the optical leak rates.
4 Cooling transition
We have analyzed the possibility to cool atomic thulium from the thermal beam at a temperature of 1100 K using blue resonance light in a Zeeman cooler. Because of the relatively low transition rate and the significant rate of optical leaks, the transition at 420.4 nm looks unfavorable for laser cooling. Indeed, to completely decelerate a thulium atom with the initial velocity of 200 m/s it is necessary to have about 35 000 scattering events. For the transition at 420.4 nm 97% of atoms will be lost during deceleration if we take (4). On the other hand, transition at 410.6 nm is more suitable for cooling: for the worst case estimation only 50% of the atoms will be lost. We have numerically modelled the Zeeman slower of 40 cm long Barrett and derived, that about 7% of initial number of atoms from the thermal beam can be decelerated to velocities of 20 m/s with all optical leaks (table 2) taken into account. We expect that using the transition at 410.6 nm one can cool and trap in a MOT up to thulium atoms with a loading rate of about 1 s for realistic oven and MOT parameters. The repumping field, if necessary, can be produced from the cooling field using an acousto-optical modulator operating at about 360 MHz (see table 1).
The Doppler limit of this transition (here is the Boltzman constant) corresponds to 230 K which is too high for successive loading in an optical dipole trap or for making experiments in a ballistic flight. Further cooling can be achieved by e.g. Sisyphus cooling or switching to a green MOT at 530.7 nm with K.
5 Clock transition
As indicated in the Introduction, the transition between the fine-structure levels of the ground state at 1.14 m can be considered as a candidate for a clock transition due to its low sensitivity to collisions and low differential polarizability of the two stayes. In the work of Aleksandrov et al. Aleksandrov this transition has been observed in the absorption spectrum of thulium vapors using a high-resolution spectrometer. Even after adding up to 50 bar of helium to a thulium cell, the authors could not detect any spectral broadening of this transition. They have concluded, that the pressure broadening is less then 20 MHz/bar which is 500 times less then typical broadening of resonance s – p or f – d transitions (10 GHz/bar).
Using the Cowan code we have evaluated the transition rate at m. The magnetic-dipole transition has a rate of while the electric quadrupole transition rate is negligible. The same evaluation has been done with the help of the Flexinle Atomic Code of Gu Ming Feng FAC which results in . The results agree with each other and we give the final estimation of for this transition rate which corresponds to the spectral line width of 1.1(3) Hz and the transition -factor of . Detection of the narrow unperturbed resonance in a cold atomic cloud produced in MOT should increase the signal to noise ratio and stability of a frequency reference Katori . The transition can be excited by a frequency stabilized ytterbium fiber laser (see e.g. Kurkov and references therein) or, probably, by a stabilized chomium:forsterite laser (Cr:Mg2SiO4) Sennaroglu .
6 Conclusions
In this work we have analyzed the possibility to cool atomic thulium using strong blue transitions in the spectral range 410 – 420 nm. The hyperfine structure of two candidates for cooling transitions at 410.6 nm and 420.4 nm and of two other transitions at 409.5 nm and 418.9 nm is determined by means of saturation absorption spectroscopy. From analysis of the spectral line widths we derived the corresponding transition rates with an accuracy better then 10%. We have evaluated the role of optical leaks by calculation of decay rates from the excited levels () and () using the code of Cowan Cowan .
We conclude, that the transition at 410.6 nm can be used for effective laser cooling of thulium from a hot atomic beam. Evaluations show, that deceleration of atomic beam in a 40-cm Zeeman slower will allow one to decelerate about 5% of atoms from the thermal distribution and to trap up to atoms in a magneto-optical trap. Further cooling can be achieved in a green MOT operating at nm.
We have evaluated the rate of the electric-dipole forbidden transition at 1.14 m between the fine structure levels of the ground state . A calculated rate of the magnetic-dipole transition is which corresponds to the quality factor of . This shielded transition can be considered as one of the candidates for applications in optical atomic clocks.
Acknowledgments
The work is partly supported by the Alexander von Humboldt Foundation, Russian Science Support Foundation and RFBR Grants #05-02-16801, #08-02-00667, #05-02-00443.
References
- (1) L. Santos, G.V. Shlyapnikov, P. Zoller, and M. Lewenstein: Phys. Rev. Lett. 85, 1791 (2000)
- (2) Y. Takasu, K. Maki, K. Komori, T. Takano, K. Honda, M. Kumakura, T. Yabuzaki, Y. Takahashi: Phys. Rev. Lett. 91, 040404 (2003)
- (3) Z.W. Barber, C.W. Hoyt, C.W. Oates, L. Hollberg, A.V. Taichenachev, and V.I. Yudin: Phys. Rev. Lett. 96, 083002 (2006)
- (4) S.B. Hill and J.J. McClelland: Appl. Phys. Lett. 82, 3128 (2003)
- (5) C. Monroe: Nature 416, 238 (2002)
- (6) C.I. Hancox, S.C. Doret, M.T. Hummon, L. Luo, J.M. Doyle: Nature 431, 281 (2004)
- (7) H. Katori, M. Takamoto, V.G. Pal’chikov, and V.D. Ovsjannikov: Phys. Rev. Lett. 91, 173005 (2003)
- (8) R. Maruyama, R.H. Wynar, M.V. Romalis, A. Andalkar, M.D. Swallows, C.E. Pearson, and E.N. Forston: Phys. Rev. A 68, 011403(R) (2003)
- (9) J.J. McClelland and J.L. Hanssen: Phys. Rev. Lett. 96, 143005 (2006)
- (10) H.Y. Ban, M. Jacka, J.L. Hanssen, J. Reader, and J.J. McClelland: Optics Express 13, 3185 (2005)
- (11) E.B. Aleksandrov, V.N. Kotylev, V.N. Kulyasov, and K.P. Vasilevskii: Opt. Spektrosk. 54, 3 (1983).
- (12) M.E. Wickliffe and J.E. Lawler: J. Opt. Soc. Am. B 14, 737 (1997)
- (13) R.D. Cowan: The theory of atomic structure and spectra, (University of California Press, Berkeley, CA, 1981), and Cowan programs RCN, RCN2, and RCG
- (14) Gu Ming Feng: ATOMIC PROCESSES IN PLASMAS: 14th APS Topical Conference on Atomic Processes in Plasmas. AIP Conference Proceedings 730, 127 (2004)
- (15) http://www.physics.nist.gov/PhysRefData/ASD/index.html
- (16) Y.V. Zarikov et. al.: Kvantovaya Elektronika 11, 1565 (1984)
- (17) J. Hult, I.S. Burns, C.F. Kaminski: Applied Optics 44, 3675 (2005)
- (18) W.J. Childs, H. Crosswhite, L.S. Goodman, and V. Pfeufer: J. Opt. Soc. Am. B 1, 22 (1984)
- (19) K.A.H. van Leeuwen, E.R. Eliel and W. Hogervorst: Physics Letters 78A, 54 (1980)
- (20) V. Pfeufer: Z. Phys. D – it Atoms, Molecules and Clusters 4, 351 (1987)
- (21) S. Kröger, L. Tanriver, H.-D. Kronfeldt, G. Guthöhrlein, H.-O. Behrens: Z. Phys. D 41, 181 (1997)
- (22) G. Başar, G. Başar, İ.K. Öztürk, F.G. Acar, and S. Kröger: Physica Scripta 71, 159 (2005)
- (23) J.J. McClelland: Phys. Rev. A 73, 064502 (2006)
- (24) V.S. Letochov and V.P. Chebotaev: Nonlinear Laser Spectroscopy, edited by D.L. McAdam (Springer, Berlin, 1977), Vol. 4
- (25) P.G. Pappas, M.M. Burns, D.D. Hinshelwood, and M.S. Fels: Phys.Rev. A 21, 1955 (1980)
- (26) S.I. Ohshima, Y. Nakadan, and Y. Koga: IEEE Journal of Quantum Electronics 23, 473 (1987)
- (27) S.M. Rytov, Yu.A. Kravtsov, V.I. Tatarski: Principles of statistical radiophysics Vol. 2, p. 59, (Springer, Berlin Heidelberg 1988).
- (28) T.E. Barrett, S.W. Dapore-Schwartz, M.D. Ray, and G.P. Lafyatis: Phys. Rev. Lett. 67, 3483 (1991)
- (29) A.S. Kurkov, V.M. Paramonov, and O.I. Medvedkov: Laser Phys. Lett. 3, 503 (2006)
- (30) A. Sennaroglu: Applied Optics 41, 4356 (2002)