VLT spectroscopy of blue supergiants in IC 16131
Abstract
We present multi-object spectroscopy of young, massive stars in the Local Group galaxy IC 1613. We provide the spectral classification and a detailed spectral catalog for 54 OBA stars in this galaxy. The majority of the photometrically selected sample is composed of B- and A-type supergiants. The remaining stars include early O-type dwarfs and the only Wolf-Rayet star known in this galaxy. Among the early B stars we have serendipitously uncovered 6 Be stars, the largest spectroscopically confirmed sample of this class of objects beyond the Magellanic Clouds. We measure chemical abundances for 9 early-B supergiants, and find a mean oxygen abundance of 12 + log(O/H) = 7.90 0.08. This value is consistent with the result we obtain for two H ii regions in which we detect the temperature-sensitive [O iii]4363 auroral line.
Subject headings:
galaxies: abundances — galaxies: stellar content — galaxies: individual (IC 1613) — stars: early-type1. Introduction
IC 1613 is a Local Group dwarf irregular galaxy, member of the M31 subgroup (McConnachie & Irwin 2006), located at a distance of kpc (Pietrzyński et al. 2006). Its low metal content has been derived both from the photometry of the intermediate-age population of stars ([Fe/H] : Cole et al. 1999, Rizzi et al. 2007) and from H ii region spectra [12 + log(O/H) 7.70: Kingsburgh & Barlow 1995, Lee et al. 2003].
The evolved stellar populations of IC 1613 have been examined in detail from Hubble Space Telescope imaging programs. The star formation rate in an outlying field 1.6 kpc in projection from the galactic center was shown by Skillman et al. (2003) to have peaked between 3 and 6 Gyr ago, and during the last Gyr it has been supressed if compared to the central field studied by Cole et al. (1999). The ongoing star formation activity is concentrated in an off-center region, 1 kpc to the north-east of the geometrical center of IC 1613, in correspondence of the peak of the H i distribution (Lake & Skillman 1989) and of the largest concentration of H ii region complexes (Hodge et al. 1990), giant ionized shells (Meaburn et al. 1988), young stars (Hodge et al. 1991) and OB associations (Hodge 1978; Borissova et al. 2004).
The young stellar content of IC 1613 has been investigated by Sandage & Katem (1976), Freedman (1988) and Georgiev et al. (1999), among others. More recently, Valdez-Gutiérrez et al. (2001) and Lozinskaya et al. (2003) have examined the interplay between young stars and the kinematics of the neutral and ionized gas, and the effects of stellar winds and supernova explosions on the structure and energy balance of the ISM. The presence of numerous OB associations appears to provide sufficient mechanical energy to explain the observed expansion of most of the superbubbles within the standard framework of Weaver et al. (1977). However, Silich et al. (2006) find that the multiple winds and supernovae model is not consistent with the observed mass and dimensions of the largest, kpc-size H i supershell. The incomplete characterization of the massive stellar population, in particular with regard to the spectral types of the OB stars that ionize the gas and that blow their stellar winds into the interstellar medium, are major limitations for these studies on the links between young stars and gas in this galaxy.
Previous spectroscopic work on the stellar content of IC 1613 has focused on the search for Wolf-Rayet (W-R) stars and other emission-line objects (Lequeux et al. 1987, Azzopardi et al. 1988, Armandroff & Massey 1991). The high-excitation WO3 star in the H ii region S3 (Sandage 1971), in particular, has received a great deal of attention since its discovery (D’Odorico & Rosa 1982, Davidson & Kinman 1982, Garnett et al. 1991, Kingsburgh & Barlow 1995), and remains the only confirmed W-R star in this galaxy. In addition to the early work by Humphreys (1980), who obtained spectra of 7 of the brightest BA and M supergiants with the Kitt Peak 4m telescope, the spectroscopy of a dozen stars in the NE quadrant of IC 1613 obtained with the Special Astrophysical Observatory 6m telescope has been published by Lozinskaya et al. (2002). However, the quality of these spectra is only adequate for a preliminary spectral classification.
In this paper we present 3-5 Å resolution spectra of 54 OBA stars in IC 1613 brighter than , obtained with the European Southern Observatory (ESO) Very Large Telescope (VLT) in the context of the Araucaria Project (Gieren et al. 2005). This work follows similar spectroscopic work recently carried out by our group on blue supergiants in the galaxies NGC 300 (Bresolin et al. 2002), WLM (Bresolin et al. 2006) and NGC 3109 (Evans et al. 2007). One main motivation for this paper is to present a catalog of spectra and a classification of spectral types for the observed targets. This will be useful for future spectroscopic investigations of the blue supergiants in IC 1613 at higher spectral resolution. Moreover, we carry out the first determination of the chemical abundances of blue supergiants in this galaxy, by fitting model spectra to the data obtained for 9 early B-type stars. The paper is organized as follows: in §2 we describe the observations and the data reduction, and in §3 we present the spectral catalog. In §4 and §5 we discuss the chemical abundances measured in B-type stars and H ii regions, respectively. We conclude with a summary in §6.
2. Observations
| R. A. | Decl. | |||||||||
|---|---|---|---|---|---|---|---|---|---|---|
| Slit Number | (J2000.0) | (J2000.0) | Spectral Type | K/(H + H) | (Å) | S/N | (km s-1) | CommentsaaSK numbers from Sandage & Katem (1976). The presence of nebular lines contaminating the stellar spectra is noted with hii. | ||
| (1) | (2) | (3) | (4) | (5) | (6) | (7) | (8) | (9) | (10) | (11) |
| Field A | ||||||||||
| 1 | 1 04 48.89 | 2 05 59.5 | 18.81 | 0.17 | A0 II | 0.27 | 5.4 | 74 | SK E33 | |
| 2 | 1 04 50.26 | 2 06 29.2 | 19.48 | 0.38 | A5 II | 0.81 | 6.8 | 54 | SK E42 | |
| 3 | 1 04 52.87 | 2 05 50.1 | 18.55 | 0.44 | A7-F0 Ib | 0.95 | 5.4 | 77 | SK F33 | |
| 4 | 1 04 53.84 | 2 06 01.9 | 19.05 | 0.08 | B9 II | 0.14 | 4.7 | 68 | SK 23a | |
| 4b | 1 04 54.29 | 2 06 03.1 | 18.98 | 0.08 | B5 Ib | 0.20 | 3.1 | 52 | SK 23A | |
| 5 | 1 04 54.41 | 2 08 13.7 | 18.61 | 0.11 | B3 Ib | 0.13 | 2.6 | 87 | ||
| 6 | 1 04 56.17 | 2 07 06.1 | 18.66 | 0.19 | A3 II | 0.59 | 6.4 | 81 | ||
| 7 | 1 04 57.92 | 2 05 49.9 | 18.41 | 0.11 | B2 Iab | 0.13 | 2.2 | 96 | ||
| 8 | 1 04 59.06 | 2 09 17.0 | 16.38 | 0.10 | A2 Ia | 0.44 | 0.41 | 235 | hii SK A43 | |
| 9 | 1 04 59.94 | 2 10 38.6 | 19.19 | 0.16 | B5 Iab | 0.17 | 2.6 | 72 | hii SK 22c | |
| 10 | 1 05 00.87 | 2 10 43.0 | 17.46 | 0.15 | B1 Ia | 0.20 | 1.4 | 159 | hii SK 22A | |
| 11 | 1 05 03.39 | 2 09 47.2 | 18.08 | 0.07 | B9 Ia | 0.30 | 1.7 | 110 | hii | |
| 12 | 1 05 04.99 | 2 08 35.4 | 18.78 | 0.14 | B1.5 Iab | 0.17 | 2.1 | 89 | hii SK C52 | |
| 13 | 1 05 06.21 | 2 10 44.8 | 19.02 | 0.24 | O3-O4 V((f)) | 0.23 | 2.2 | 82 | hii SK 22b | |
| 14 | 1 05 07.51 | 2 11 32.4 | 19.85 | 0.13 | Be | in em. | 52 | |||
| 15 | 1 05 08.74 | 2 10 01.1 | 19.35 | 0.24 | O9.5 III | 0.32 | 1.7 | 74 | hii | |
| 16 | 1 05 10.10 | 2 12 31.3 | 18.90 | 0.18 | early B Ib | 2.9 | 86 | |||
| 17 | 1 05 11.13 | 2 12 25.0 | 19.33 | 0.21 | Be | in em. | 65 | |||
| 18 | 1 05 13.50 | 2 09 05.3 | 19.23 | 0.18 | B1 Iab | 0.17 | 2.3 | 70 | hii | |
| 19 | 1 05 15.05 | 2 10 45.0 | 20.19 | 0.14 | Be | 0.73 | in em. | 43 | ||
| Field B | ||||||||||
| 1 | 1 04 59.44 | 2 10 23.2 | 19.57 | 0.04 | B9 II | 0.23 | 6.3 | 60 | hii SK A19 | |
| 2 | 1 05 03.03 | 2 10 06.1 | 19.68 | 0.27 | O5-O6 V | 0.34 | 1.2 | 66 | hii S17bbH ii regions from Sandage (1971). | |
| 3 | 1 05 06.34 | 2 09 32.9 | 17.81 | 0.14 | B0 Ia | 0.12 | 1.4 | 154 | hii SK B42 | |
| 4 | 1 04 59.52 | 2 09 17.6 | 18.27 | 0.20 | B1.5 Ia | 0.19 | 1.8 | 114 | hii SK A42 | |
| 5 | 1 04 57.98 | 2 09 01.2 | 19.61 | 0.03 | Be | in em. | 57 | hii SK 32b | ||
| 6 | 1 05 02.16 | 2 08 36.5 | 18.82 | 0.05 | B1 Ia | 0.19 | 1.5 | 92 | hii SK 38a | |
| 7 | 1 05 01.95 | 2 08 06.5 | 18.99 | 0.29 | O9 I | 0.14 | 2.2 | 87 | hii SK 38b | |
| 8 | 1 04 48.63 | 2 07 43.3 | 19.50 | 0.01 | B8 Ib | 0.10 | 3.6 | 63 | SK D31 | |
| 9 | 1 04 56.38 | 2 07 17.8 | 19.72 | 0.18 | A3 II | 0.57 | 7.7 | 53 | ||
| 10 | 1 04 49.93 | 2 07 04.7 | 18.94 | 0.01 | B8 Iab | 0.10 | 3.3 | 84 | SK E46 | |
| 11 | 1 04 43.82 | 2 06 46.1 | 18.68 | 0.16 | O9.5 I | 0.23 | 2.2 | 93 | hii SK L | |
| 12 | 1 05 01.72 | 2 06 20.7 | 19.03 | 0.13 | Be | in em. | 80 | SK J46 | ||
| 13 | 1 05 05.70 | 2 05 49.6 | 18.56 | 0.10 | B5 Iab | 0.15 | 2.2 | 98 | SK PeM | |
| 14 | 1 04 56.69 | 2 05 36.0 | 19.32 | 0.23 | B0 Iab | 0.08 | 2.2 | 74 | SK H33 | |
| 15 | 1 04 58.28 | 2 05 10.5 | 18.52 | 0.14 | A0 II | 0.31 | 5.6 | 98 | hii SK H34 | |
| 16 | 1 04 57.64 | 2 04 45.2 | 18.80 | 0.14 | B1.5 Iab | 0.18 | 2.3 | 91 | hii SK H8 | |
| 17 | 1 05 01.62 | 2 04 21.1 | 19.90 | 0.13 | WO3 | in em. | 47 | hii DR1ccW-R star discovered by D’Odorico & Rosa (1982). S3bbH ii regions from Sandage (1971). | ||
| 18 | 1 04 50.11 | 2 03 51.0 | 19.78 | 0.09 | B9 II | 0.11 | 5.5 | 51 | ||
| 19 | 1 04 51.52 | 2 03 44.8 | 19.94 | 0.01 | Be | 0.37 | in em. | 47 | ||
| Field C | ||||||||||
| 1 | 1 04 31.75 | 2 12 11.1 | 18.11 | 0.11 | A2 II | 0.34 | 6.1 | 72 | ||
| 2 | 1 04 28.07 | 2 10 24.0 | 19.58 | 0.17 | A3 II | 0.61 | 7.0 | 35 | ||
| 3 | 1 04 29.35 | 2 10 37.0 | 19.76 | 0.26 | A3 II | 0.71 | 7.5 | 31 | ||
| 4 | 1 04 29.87 | 2 09 51.5 | 20.14 | 0.08 | B8 II | 0.15 | 4.7 | 28 | ||
| 5 | 1 04 36.22 | 2 11 27.7 | 18.18 | 0.52 | A V | 0.81 | 3.2 | 57 | ||
| 6 | 1 04 32.45 | 2 09 33.1 | 18.83 | 0.07 | B1 Ia | 0.22 | 1.5 | 57 | hii | |
| 7 | 1 04 37.09 | 2 10 04.0 | 19.04 | 0.24 | B1 Ia | 0.20 | 1.9 | 48 | ||
| 8 | 1 04 27.84 | 2 07 09.2 | 19.90 | 0.18 | A3 II | 0.62 | 7.8 | 30 | ||
| 9 | 1 04 38.63 | 2 09 44.4 | 19.02 | 0.27 | O8 III((f)) | 0.18 | 2.0 | 52 | ||
| 10 | 1 04 43.35 | 2 10 23.4 | 18.82 | 0.23 | B1.5 Ib | 0.21 | 2.7 | 56 | ||
| 12 | 1 04 46.71 | 2 09 59.4 | 16.39 | 0.66 | G2 | 1.03 | 2.3 | 130 | ||
| 13 | 1 04 48.98 | 2 10 24.8 | 19.80 | 0.14 | early A II | 8.2 | 32 | |||
| 14 | 1 04 50.05 | 2 09 51.8 | 19.13 | 0.16 | B2 Ib | 2.5 | 47 | |||
| 15 | 1 04 43.99 | 2 07 33.0 | 15.69 | 0.91 | G8 | 1.00 | 2.1 | 156 | SK D51 | |
| 16 | 1 04 47.17 | 2 07 54.2 | 18.54 | 0.39 | A5 Ib | 0.82 | 5.9 | 55 | hii SK D22 | |
| 17 | 1 04 53.76 | 2 09 17.1 | 19.27 | 0.11 | early A II | 7.1 | 43 | |||
| 18 | 1 04 48.88 | 2 07 13.8 | 19.59 | 0.02 | B5 II | 0.09 | 3.7 | 37 | SK D28 | |
| 19 | 1 04 54.61 | 2 08 31.1 | 18.89 | 0.22 | composite | 0.26 | 1.7 | 55 | ||
Note. — Units of right ascension are hours, minutes, and seconds, and units of declination are degrees, arcminutes, and arcseconds.
Blue supergiant candidates were selected from photometry measured on images obtained with the Warsaw 1.3m telescope at Las Campanas as part of the OGLE-II collaboration by Udalski et al. (2001). The spectroscopy was carried out at the VLT UT4 (Yepun), equipped with the Focal Reducer and Low Dispersion Spectrograph 2 (FORS2), on the nights of October 26 and 27, 2003. Seeing conditions were variable between 08 and 13.

| Center (J2000.0) | Exposure | ||||
|---|---|---|---|---|---|
| Field | R. A. | Decl. | Grism | Date | Time (s) |
| A | 01 05 01.6 | 02 09 02 | 600B | 10-26-2003 | 32400 |
| 1200R | 10-26-2003 | 32700 | |||
| B | 01 04 57.1 | 02 07 08 | 600B | 10-27-2003 | 32700 |
| 1200R | 10-27-2003 | 32700 | |||
| C | 01 04 38.9 | 02 09 07 | 600B | 10-26-2003 | 21800, 1700 |
| 1200R | 10-27-2003 | 21200, 11800 | |||
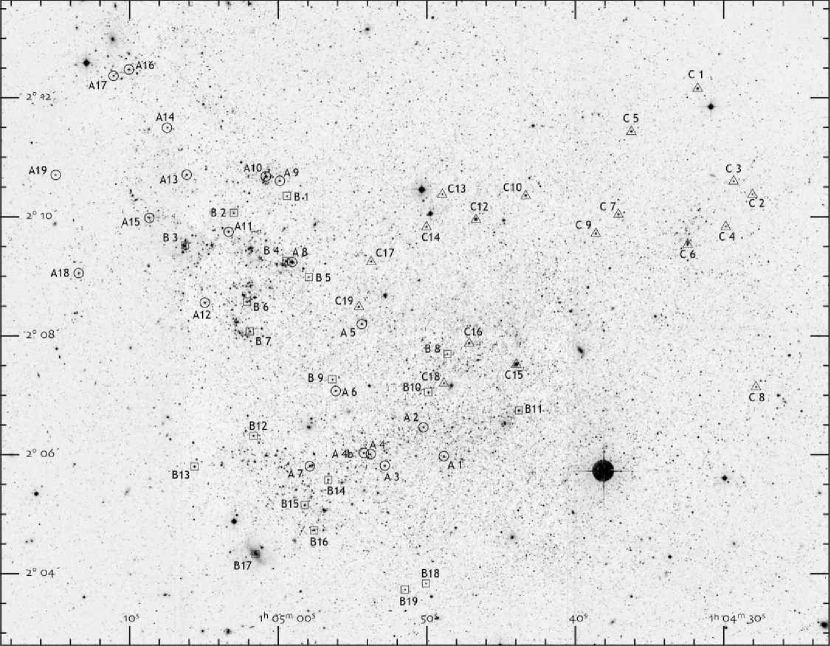
We acquired spectra in three 68 68 FORS2 fields in the movable slitlets (MOS) mode (19 slitlets per field, each 1 arcsec wide and extending 21 arcsec in the spatial direction). We included as many of the brightest blue stars (, ) found in the three fields of IC 1613 as possible. A handful of redder or fainter stars were also observed, in order to fill up the MOS setup. A finding chart is shown in Fig. 1, while target coordinates, photometric measurements and other derived parameters are presented in Table 1. Fig. 2 shows the location of the spectroscopic targets in the color-magnitude diagram. Throughout this paper we adopt the convention of appending the slit number (1 to 19) to the field identification (A, B or C) to label our spectroscopic targets. Our field A is centered on the NE quadrant of IC 1613, where the majority of the young stars and H ii regions are located. Field B covers most of the central bar-like structure that runs from the SE to the NW, while field C extends to the west of these two main structures. Two stars were included in the 4th slitlet of field A, and are labeled as A4 and A4b. Star C11 was too close to the slitlet edge to provide a meaningful extraction, and therefore it does not appear in Table 1.
The spectroscopy was carried out using two different grisms: the 600B to cover the blue wavelengths (in particular the 3600-5000 Å range, which is critical for the spectral classification) at 5 Å resolution, and the 1200R to cover the region around the H line at 3 Å resolution. The integration times varied among the different fields and setups, and are summarized in Table 2. As field C contained our lowest-priority targets, the exposure times were shorter than in the remaining two fields. The airmass of IC 1613 was also larger during the spectroscopy of field C, exceeding a value of 1.6. For fields A and B the airmass varied between 1.1 and 1.5.
We have used standard long-slit spectroscopy tasks within iraf111iraf is distributed by the National Optical Astronomy Observatories, which are operated by the Association of Universities for Research in Astronomy, Inc., under cooperative agreement with the National Science Foundation. for bias and flat-field corrections, wavelength calibration and extraction of the spectra. Cosmic rays were removed with the l.a.cosmic routines by van Dokkum (2001). The mean signal-to-noise ratio (S/N) of the resulting averaged, normalized spectra is reported in column 9 of Table 1. The heliocentric radial velocities measured from the spectral lines (column 10) are in all cases but 3 in good agreement with the h i systemic velocity of km s-1 (Lu et al. 1993). Excluding stars C12 and C15 (2 foreground G stars) and C5 (presumably a Galactic halo A star), we obtain a mean radial velocity of km s-1. With an uncertainty of 10 km s-1 on the radial velocities, and a maximum rotational velocity of 20 km s-1 from H i observations (Lake & Skillman 1989, Hoffman et al. 1996), we are finding no hints of galactic rotation from our stellar data.
Cross identification with the bright star catalog of Sandage & Katem (1976) is given in column 11 of Table 1. We also indicate the presence of spatially extended nebular emission superposed on the stellar spectra. In some cases this contamination strongly affects the stellar lines, in particular those of the Balmer series.
3. Spectral catalog


The philosophy behind the classification of extragalactic early-type stars has been discussed at length in our previous works on WLM (Bresolin et al. 2006) and NGC 3109 (Evans et al. 2007). We recall here that for B stars we follow Lennon (1997), and for A supergiants we adopt the criteria from Evans & Howarth (2003) and Evans et al. (2004). The classification of O stars is based upon Walborn (1971), Walborn & Fitzpatrick (1990) and Walborn et al. (2000). Luminosity classes for B and A stars are determined from the equivalent width of H (), following the criteria by Azzopardi (1987).
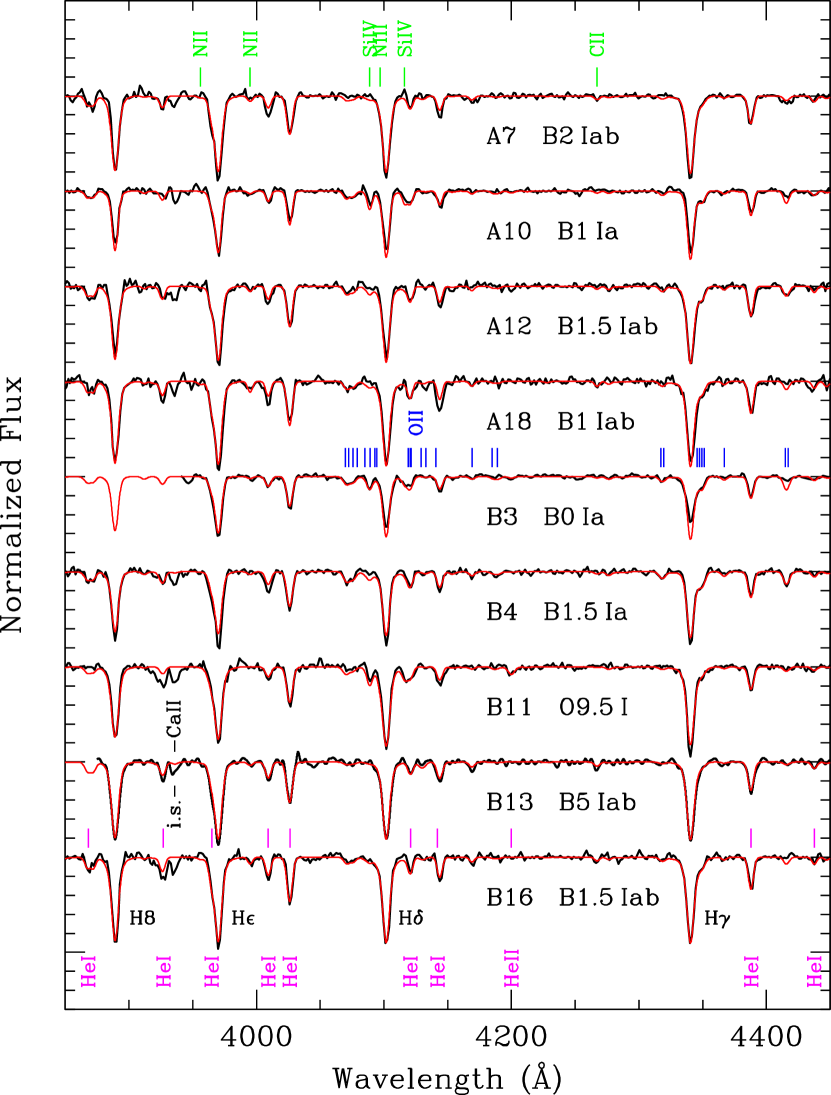
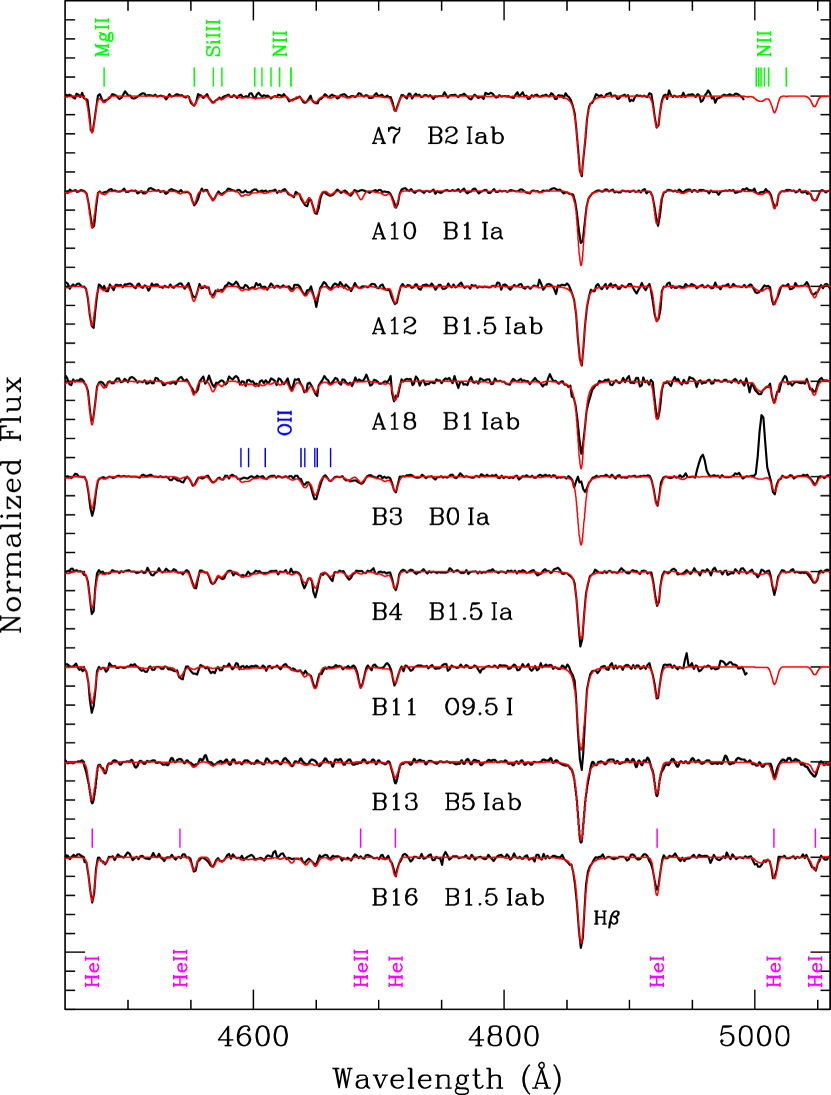
The spectral classification of the 57 stars included in this work are given in column 6 of Table 1, together with the Ca ii K/(Ca ii H + H) ratio used for classifying A stars (column 7) and (column 8). The blue region (3750 Å to 5000 Å) of the normalized stellar spectra is shown in Fig. 3–8, in order of decreasing temperature (spectral type O to G). Emission-line stars are shown in Fig. 9 and 10. In these figures we identify the main H, He and metal lines that are used in the classification procedure.
3.1. Comments on selected stars
We provide here brief comments on some peculiar or outstanding stars presented in Table 1 and shown in Figures 3-10. Absolute magnitudes are derived from a distance modulus (mM)0 = and E(BV) = (Pietrzyński et al. 2006).
A8 (A2 Ia).—This is the visually brightest star in IC 1613 at . Sandage & Katem (1976) suggested that this star (their A43) is a foreground field star, but its radial velocity was found to agree with the systemic velocity by Humphreys (1980), who assigned a A0 Ia spectral type. The H (not shown) and H lines are in emission, with P Cygni profiles. The other non-Be stars with strong wind emission in H are the B1 supergiants B6 and C6.
A10 (B1 Ia).—Star 22A in the list of Sandage & Katem (1976), it was found by these authors to be the brightest blue star in IC 1613 (). Humphreys (1980) classified this star as B2-B3 I. We assign the earlier B1 type, from the detection of Si iv4089, 4116 (the latter line blended with He i4121), and the lack of He ii lines.
A13 (O3-O4 V((f))).—The earliest star in our sample shows no evidence of He i in its spectrum, except perhaps a weak He i4471 line. Since nebular lines (e.g. [O iii]5007) are present in our spectrum, this lack of He i lines could be due to line in-filling. The strong He ii4686 absorption and the weak n iii4634-4640-4642 emission lines lead to the ((f)) classification. A weak n iv4058 in emission is detected. The absolute magnitude of this star, , is consistent with the dwarf classification (Conti 1988).
B2 (O5-O6 V).—This O star displays He i lines in its spectrum, with He ii4200 He i4026 (the two lines are of equal strength at class O6). Its value of He i4471He ii4542 corresponds to an O5.5 type (Conti 1988). This star is the likely ionizing source of the surrounding H ii region S17 (Sandage 1971), whose chemical abundance is derived in Section 5. The contamination by the nebular lines is causing in-filling of the He i lines, therefore the spectral type can be somewhat later than O5-O6. From the H luminosity of S17 published by Hodge et al. (1990), log L(H) = 36.96 erg s-1, we derive the number of Lyman continuum ionizing photons log Q(H0) = 48.82. This corresponds to the ionizing flux output of an O6.5 V star (Martins et al. 2005).
B3 (B0 Ia).—The third brightest blue supergiant () is star B42 in the list by Sandage & Katem (1976). Our B0 classification derives from the presence of He ii4542, 4686 in its spectrum, with He ii4542 Si iii4553 (the two lines are of equal strength at O9.7). The stellar spectrum is heavily contaminated by nebular lines (see, for example, the filled-in H line and [O iii]5007 in emission). Humphreys (1980) obtained a spectrum of this star, and assigned a B0 classification based on two-color photometry. This is the only star we have in common with Lozinskaya et al. (2002), who classified it (their star I.1) as an O supergiant.
B17 (WO3).—The Wolf-Rayet features in the bright star embedded in the H ii region S3 were studied for the first time by D’Odorico & Rosa (1982, hence the name DR1) and Davidson & Kinman (1982). Spectra of this star have been discussed, among others, by Armandroff & Massey (1991), who classified it as WC4-5, Garnett et al. (1991, WO4) and Kingsburgh & Barlow (1995, WO3), whose classification we adopt. The spectrum (Fig. 10) is characterized by high-excitation nebular lines (including He ii4542, 4686, 5412) superposed on broad stellar lines from C iv, O v and O vi.
C5 (A V).—This star has a highly discrepant radial velocity, km s-1, and its spectrum is characterized by narrow Balmer lines and very weak metal lines, with the exception of Ca ii K. A halo dwarf A-type star or a lower-gravity, evolutionarily more evolved field horizontal branch star would both match these properties. Disentangling these two possibilities from linewidth measurements, even at higher resolution, is unfeasible for the coolest () A stars222We follow the terminology of Wilhelm et al. (1999b) and other works dealing with halo stars by including in the A-type class stars as cool as = 6000, i.e. what would be traditionally called F-type stars. (Arnold & Gilmore 1992). However, UBV photometry can be used to constrain and surface gravity, and we note that in the vs. color-color diagram shown by Wilhelm et al. (1999b) in their extensive study of A-type stars in the halo star C5 would fall in the A V domain. We adopted and (A. Herrero, private communication), and a Galactic reddening towards IC 1613 (Schlegel et al. 1998). We have used the model grid by Wilhelm et al. (1999a) to obtain approximate values of the stellar parameters from the UBV colors and the equivalent width of the Ca ii K line. Our results, = 6750 , = 4.0, and [Fe/H] = , confirm that C5 is a dwarf star. From an absolute magnitude , corresponding to the star’s color (Schmidt-Kaler 1982), we derive a distance of 8.1 kpc. We note that the Ca ii K/(Ca ii H + H) criterion provides an A5 classification.
Be stars—The group of 6 stars in Fig. 9 displays similar characteristics, with Balmer lines, as well as several Fe ii lines, in emission. While H and H are in emission for all stars, H progresses from a filled-in profile to an emission line as EW(H) increases. The strength of the Fe ii emission appears to be correlated with that of the H lines. The He i5876 is seen in emission in all stars. The simultaneous presence of H, He and iron emission lines in B stars is consistent with the Group I Be classification of Jaschek et al. (1980). The definition of the B sub-class is made highly uncertain by the broadening of the lines (due to high rotational velocities) and the superposition of the Fe ii4549-4556, 4583 emission lines, originating in the surrounding shells, on top of the photospheric Si ii4553, 4568, 4575 lines. However, Be stars belonging to Group I are mostly of early-B type (B0-B3), and we detect a broad feature corresponding to the CNO blend at Å, found in early-B stars. We also detect He ii4686 in a few cases (e.g. A19, A17), pointing to an earlier, Oe star classification (Conti & Leep 1974). Absolute visual magnitudes range between (B12) and (A19). These values are comparable to those found for the brightest Be stars in the SMC (Martayan et al. 2007). The large number of Be stars found in our study tends to confirm the trend of increasing frequency of Be stars with decreasing metallicity (Maeder et al. 1999; Wisniewski & Bjorkman 2006).
G stars—Both C12 (type G2) and C15 (type G8, not shown in the spectral catalog) have a radial velocity which is discrepant with respect to the systemic velocity of IC 1613, as well as a bright apparent magnitude ( = 16.39 and 15.69, respectively), indicating that they are foreground Milky Way stars. The classification is based on the strength of the G-band and Fe i4325 relative to H (Evans et al. 2004). The photometric parameters for these stars violate the criteria we use to select blue supergiants in external galaxies. These objects were included in the spectroscopic sample in order to fill otherwise unused slitlets of our MOS setup.
4. Stellar abundances: B supergiants
For the 9 early-B supergiants with the highest signal-to-noise ratio we have derived stellar parameters and metal abundances by comparing our observations with model spectra obtained with the fastwind code (Santolaya-Rey et al. 1997, Puls et al. 2005). Our procedure has been explained in detail by Urbaneja et al. (2003, 2005), and has been recently used for the analysis of B supergiants in WLM (Bresolin et al. 2006) and NGC 3109 (Evans et al. 2007). As already mentioned in these papers, our best-fit models are those that provide the overall best match to the ensemble of metal lines present in the spectra, while some of the individual lines might be still not well reproduced. At the low abundances encountered in the dwarf irregular galaxies that we have so far analyzed [12 + log(O/H) 8.0], the low spectral resolution and the limited signal-to-noise ratio that are available to us conspire to increase the uncertainty in the metallicity measurements, which for a single chemical element in a given star is on the order of 0.2-0.25 dex. However, combining the information obtained from several stars, we can still obtain a meaningful picture of the content of the most abundant elements, in particular oxygen, in galaxies at relatively large distances, and verify, within the above-mentioned limits of precision, the presence of chemical inhomogeneities and the agreement with chemical abundances obtained with alternative means, in particular from the emission lines of H ii regions (Bresolin et al. 2006).
| Properties | A7 | A10 | A12 | A18 | B3 | B4 | B11 | B13 | B16 |
|---|---|---|---|---|---|---|---|---|---|
| Spectral type | B2 Iab | B1 Ia | B1.5 Iab | B1 Iab | B0 Ia | B1.5 Ia | O9.5 Iab | B5 Iab | B1.5 Iab |
| (K)aaError: K. | 19500 | 25000 | 23000 | 21000 | 24500 | 22500 | 30000 | 17000 | 21000 |
| log (cgs)bbError: . | 2.55 | 2.70 | 2.75 | 2.70 | 2.65 | 2.60 | 3.20 | 2.30 | 2.75 |
| B.C. | |||||||||
| Mbol | |||||||||
| log | |||||||||
| 0.04 | 0.08 | 0.11 | 0.00 | 0.06 | 0.04 | 0.09 | 0.03 | 0.10 | |
| (km s-1) | 10 | 15 | 12 | 15 | 12 | 15 | 15 | 10 | 15 |
| 0.08 | 0.08 | 0.10 | 0.08 | 0.08 | 0.10 | 0.08 | 0.10 | 0.08 | |
| ccAdopting (Asplund et al. 2004). (dex) |
Note. — Abundances are expressed as .
The modeling with fastwind provides us with effective temperatures () from the helium (late-O stars) and silicon (early-B stars) ionization equilibria, while fits to the Balmer line profiles are used to determine surface gravities (). Among the additional parameters that are estimated by the fitting procedure are the microturbulent velocity, (using a combination of He i and the Si ii/iii/iv lines) and the abundances of various metals. The main abundance diagnostics used in this work are C ii6578–6583; N ii3995, 5050, 5100; oii4072–4076, 4317–4319, 4414-4416; Mg ii4481; Si iii4553–4575. One or more of these features are not always available with sufficient S/N to provide strong contraints on the chemical abundance. However, the large number of additional faint metal lines and line blends that are present in the optical range, especially originated by oxygen atoms, is used to determine the metal content even when individual lines cannot be resolved in our spectra. For the He abundance we rely on He i4026, 4388, 4471, 4921, 5015, 5048 and 6678 (the other lines have uncertain broadening data). The reddening for each star has been derived from a comparison of the observed VI and JK magnitudes (the latter extracted from the near-IR photometry by Pietrzyński et al. 2006) with the spectral energy distribution of the best-fitting fastwind models, and adopting the Cardelli et al. (1989) extinction law with . We obtain rather low values for , with a mean value of , similar to the result of obtained independently in our Cepheid study (Pietrzyński et al. 2006).
Our results are summarized in Table 3, where the chemical abundances of C, N, O, Mg and Si are expressed with the notation . The distance-dependent parameters assume a distance to IC 1613 of 721 kpc (Pietrzyński et al. 2006). Our estimated errors are 1000 K in , 0.1 dex in , and vary between 0.17 dex and 0.25 dex in metal abundances. Spectroscopic masses are lower limits, due to the fact that at the FORS spectral resolution we cannot determine corrections to the gravities that account for the stellar rotational velocities. The sensitivity of the derived chemical abundances to the different stellar parameters for stars of similar and from similar data as ours have been presented in detail by Urbaneja et al. (2005) and Evans et al. (2007), and will not be repeated here. In Fig. 11 and 12 we plot the adopted final models on top of the observed spectra for the 9 B-type supergiants we have analyzed. Fig. 13 presents a comparison between the spectrum of the B2 Iab star A7 in the 4300-4700 Å wavelength range and fastwind models calculated at the adopted metallicity (for oxygen: , dotted line in the center), and at 0.2 dex higher (top) and lower (bottom) metal abundances. This example is a typical case: while overall the strength of the observed spectral features agree with the adopted model, some features (e.g. [O ii]4415-4417 for this star) are better reproduced with the 0.2 dex higher abundance, while others (e.g. [O ii]4317-4319 in this example) would suggest a slightly lower abundance.
The mean oxygen abundance of the stars in Table 3 is 12 + log(O/H) = 7.90 0.08. In Section 5 we obtain from two H ii regions an average nebular abundance 12 + log(O/H) = 7.73 0.03. In view of the errors, we regard the slight discrepancy as not significant. The median oxygen abundance of the B supergiants of 7.9 compares to very similar values of 7.9 obtained in WLM (Bresolin et al. 2006) and of 7.8 in NGC 3109 (Evans et al. 2007).
Regarding the additional chemical elements, in several cases we could only obtain upper limits to their abundances, except for silicon. Nitrogen abundances could be measured for 6 stars. They are considerably higher than the H ii region values of 12 + log(N/H) = 6.5–6.7 (Lee et al. 2003, Kingsburgh & Barlow 1995), by up to 0.7 dex. Nitrogen enrichments of comparable size are found in samples of B supergiants in, for example, the SMC (Trundle et al. 2004). Excluding upper limits, the mean abundances (by number of particles) of the remaining elements relative to oxygen, log(C/O) = , log(Si/O) = and log(Mg/O) = , are also comparable to the SMC B supergiant values (Dufton et al. 2005).
5. Nebular abundances
Several of our stellar spectra show contamination by nebular lines, as summarized in the last column of Table 1. This offers us the possibility of comparing H ii region chemical abundances with the metallicities derived for the supergiant stars. In order to determine accurate nebular abundances, the knowledge of the electron temperature of the gas, , is necessary, since the emissivities of the forbidden lines used for nebular abundance work strongly depend on it. At low metallicity the auroral-to-nebular line ratio [O iii] 4363/(4959+5007) can be used for such purpose. However, the H ii regions in IC 1613 are of low surface brightness, making it difficult to detect the faint 4363 auroral line. Abundance measurements based on this line have been carried out in the H ii region S3 (Sandage 1971) by several authors, thanks to the high degree of excitation of this nebula, ionized by the hot WO3 star described previously, that makes the [O iii] lines very strong. In their early work Davidson & Kinman (1982) obtained an oxygen abundance 12 + log(O/H) = 7.87, while more modern measurements by Kingsburgh & Barlow (1995) and Lee et al. (2003) are in the range 12 + log(O/H) = 7.62–7.70. Work on additional H ii regions has derived chemical abundances from bright-line methods and comparisons of the line flux ratios to photoionization model results, without a direct measurement of the electron temperature. In particular, the chemical abundance for the supernova remnant S8 has been studied by D’Odorico & Dopita (1983, 12 + log(O/H) = 7.60) and Peimbert et al. (1988, 12 + log(O/H) = 7.83). Lee et al. (2003) determined 12 + log(O/H) = 7.90 for region #13 (Hodge et al. 1990) from the R23 method. A N/O ratio enhanced relative to other low-luminosity dwarf irregular galaxies, in the range N/O = 0.07–0.12, is found in the papers cited.
| (Å) | Ion | S3 | S17 |
|---|---|---|---|
| 3727 | [O ii] | 93 5 | 299 15 |
| 3869 | [Ne iii] | 55 3 | 10.9 0.9 |
| 3889 | H i + He I | 18.6 0.9 | 20.4 1.2 |
| 3969 | H i + [Ne iii] | 34 2 | 22.7 1.4 |
| 4026 | He i | 1.8 0.3 | |
| 4072 | [S ii] | 1.2 0.4 | |
| 4101 | H i | 27 1 | 26 1 |
| 4340 | H i | 50 2 | 49 2 |
| 4363 | [O iii] | 15.1 0.6 | 3.9 0.4 |
| 4471 | He i | 3.6 0.2 | 3.2 0.4 |
| 4686 | He ii | 24.1 0.9 | |
| 4711 | [Ar iv] | 3.5 0.2 | |
| 4740 | [Ar iv] | 2.7 0.2 | |
| 4861 | H i | 100 4 | 100 4 |
| 4922 | He i | 1.04 0.32 | |
| 4959 | [O iii] | 183 7 | 73 3 |
| 5007 | [O iii] | 521 20 | 221 9 |
| 5412 | He ii | 2.4 0.2 | |
| 5876 | He i | 7.1 0.4 | 11.4 0.7 |
Note. — Fluxes are normalized to H = 100.
| S3 | S17 | |
|---|---|---|
| (O iii) | 18300 400 | 14500 700 |
| (O ii) | 14900 50 | 13600 400 |
| O+/H+ | ||
| O++/H+ | ||
| He+/H+ | 0.057 0.004 | 0.092 0.007 |
| He++/H+ | 0.022 0.001 | |
| ICF(O) | 1.24 | 1 |
| 12 + log(O/H) | 7.63 0.02 | 7.78 0.05 |
| 12 + log(O/H)caaOxygen abundance corrected for the ionization correction factor ICF(O). | 7.72 0.02 | 7.78 0.05 |
| He/H | 0.079 0.005 | 0.092 0.007 |
Two stars in our sample are associated with H ii regions in which we have detected [O iii]4363: B17 (H ii region S3) and B2 (H ii region S17). For the spectral extraction of these two H ii regions we have avoided the stars, thus producing nebular spectra that are unaffected by strong stellar continua (Fig. 14). As already known since the early studies of the WO3 star DR1 and its associated nebula (D’Odorico & Rosa 1982; Davidson & Kinman 1982), the high-excitation spectrum of S3 contains the rare He ii4686 line. In our spectrum we have also detected the fainter He ii 4542 and 5412 lines.
The emission line intensities, measured after flux-calibration of the spectra, and normalized to I(H) = 100, are presented in Table 4. The Balmer decrement, measured by the H/H and H/H line ratios, is consistent with a negligible amount of extinction for both H ii regions. We have derived the electron temperature for the O++-emitting zone, (O iii), from the [O iii] 4363/(4959+5007) ratio and assuming the low-density regime (Ne = 100 cm-3), using the nebular package in iraf. Our value for S3, = 18300 400 K, compares well with = 17910 K given by Lee et al. (2003), and is slightly higher than = 17100 500 K reported by Kingsburgh & Barlow (1995). The temperature of the O+-emitting zones, (O ii), has been derived from (O iii) and the relations published by Izotov et al. (2006). The oxygen ionic abundances, O+/H+ (obtained from [O ii]3727/H) and O++/H+ (from [O iii]5007/H), together with additional parameters, are summarized in Table 5.
For the H ii region S17 the total oxygen abundance is given as the sum O+/H+ + O++/H+, and we obtain 12 + log(O/H) = 7.78 0.05. For the high excitation region S3 we need to account for the contribution of O3+, which is not observed in the optical range. To estimate an ionization correction factor (ICF) we have followed Kingsburgh & Barlow (1994): ICF(O) = (1 + He++/He+)2/3 = 1.24. With this correction, the oxygen abundance of S3 becomes 12 + log(O/H) = 7.72 0.02. This value agrees with the result by Kingsburgh & Barlow (1995, 12 + log(O/H) = 7.70). Lee et al. (2003) obtained 12 + log(O/H) = 7.62 0.05, but they did not apply any correction to account for the presence of O3+. Our uncorrected value is 12 + log(O/H) = 7.63 0.02.
To summarize, besides the well-studied H ii region S3, ionized by the WO3 star DR1, with this study we have found a second H ii region in IC 1613 in which we have a direct measurement of the electron temperature. The oxygen abundances of two H ii regions agree quite well, with an average 12 + log(O/H) = 7.73 0.04. We also note the good agreement found between nebular and stellar helium abundances: the mean from the B supergiants is He/H = 0.087 0.010, while the weighted mean from the H ii regions is He/H = 0.083 0.009,
6. Summary
In this paper we have presented multi-object spectroscopy of young, massive stars that we have obtained in the Local Group galaxy IC 1613. We have provided the spectral classification and a detailed spectral catalog for 54 OBA stars in this galaxy. The majority of the photometrically selected sample is composed of B- and A-type supergiants. The remaining stars include early O-type dwarfs and the only Wolf-Rayet star known in this galaxy. Among the early B stars we have uncovered 6 Be stars, which constitute the largest spectroscopically confirmed sample of this class of objects beyond the Magellanic Clouds. The radial velocities of all these stars is consistent with the systemic velocity. Only three stars have clearly discrepant velocities, and are identified as foreground objects belonging to the Milky Way. Of these, 2 G-type stars clearly violate the criterion used for the selection of blue supergiants. The third one, an A star in the Galactic halo, has very weak metal lines, and would have been flagged as peculiar even in the absence of a discrepant radial velocity information.
Using model atmospheres calculated with fastwind we have measured chemical abundances for 9 early-B supergiants, and have found a mean oxygen abundance of 12 + log(O/H) = 7.90 0.08. This value is comparable with the result we obtain for two H ii regions in which we detect the temperature-sensitive [O iii]4363 auroral line, 12 + log(O/H) = 7.73 0.04. The agreement extends to the helium abundance. The abundance patterns we find for the remaining chemical elements is similar to those measured in B supergiants in the slightly more metal-rich SMC. The stellar oxygen abundance is very close to the values we have found from similar data in the other dwarf galaxies whose blue supergiants have been studied so far as part of the Araucaria project, WLM and NGC 3109.
References
- Armandroff & Massey (1991) Armandroff, T. E. & Massey, P. 1991, AJ, 102, 927
- Arnold & Gilmore (1992) Arnold, R. & Gilmore, G. 1992, MNRAS, 257, 225
- Asplund et al. (2004) Asplund, M., Grevesse, N., Sauval, A. J., Allende Prieto, C., & Kiselman, D. 2004, A&A, 417, 751
- Azzopardi (1987) Azzopardi, M. 1987, A&AS, 69, 421
- Azzopardi et al. (1988) Azzopardi, M., Lequeux, J., & Maeder, A. 1988, A&A, 189, 34
- Borissova et al. (2004) Borissova, J., Kurtev, R., Georgiev, L., & Rosado, M. 2004, A&A, 413, 889
- Bresolin et al. (2002) Bresolin, F., Gieren, W., Kudritzki, R.-P., Pietrzyński, G., & Przybilla, N. 2002, ApJ, 567, 277
- Bresolin et al. (2006) Bresolin, F., Pietrzyński, G., Urbaneja, M. A., Gieren, W., Kudritzki, R.-P., & Venn, K. A. 2006, ApJ, 648, 1007
- Cardelli et al. (1989) Cardelli, J. A., Clayton, G. C., & Mathis, J. S. 1989, ApJ, 345, 245
- Cole et al. (1999) Cole, A. A., Tolstoy, E., Gallagher, III, J. S., Hoessel, J. G., Mould, J. R., Holtzman, J. A., Saha, A., Ballester, G. E., Burrows, C. J., Clarke, J. T., Crisp, D., Griffiths, R. E., Grillmair, C. J., Hester, J. J., Krist, J. E., Meadows, V., Scowen, P. A., Stapelfeldt, K. R., Trauger, J. T., Watson, A. M., & Westphal, J. R. 1999, AJ, 118, 1657
- Conti (1988) Conti, P. S. 1988, in O stars and Wolf-Rayet stars, ed. P.S. Conti & A.B. Underhill, NASA SP-497
- Conti & Leep (1974) Conti, P. S. & Leep, E. M. 1974, ApJ, 193, 113
- Davidson & Kinman (1982) Davidson, K. & Kinman, T. D. 1982, PASP, 94, 634
- D’Odorico & Dopita (1983) D’Odorico, S. & Dopita, M. 1983, in IAU Symp. 101: Supernova Remnants and their X-ray Emission, ed. J. Danziger & P. Gorenstein, 517–524
- D’Odorico & Rosa (1982) D’Odorico, S. & Rosa, M. 1982, A&A, 105, 410
- Dufton et al. (2005) Dufton, P. L., Ryans, R. S. I., Trundle, C., Lennon, D. J., Hubeny, I., Lanz, T., & Allende Prieto, C. 2005, A&A, 434, 1125
- Evans et al. (2007) Evans, C. J., Bresolin, F., Urbaneja, M. A., Pietrzyński, G., Gieren, W., & Kudritzki, R.-P. 2007, ApJ, 659, 1198
- Evans & Howarth (2003) Evans, C. J. & Howarth, I. D. 2003, MNRAS, 345, 1223
- Evans et al. (2004) Evans, C. J., Howarth, I. D., Irwin, M. J., Burnley, A. W., & Harries, T. J. 2004, MNRAS, 353, 601
- Freedman (1988) Freedman, W. L. 1988, AJ, 96, 1248
- Garnett et al. (1991) Garnett, D. R., Kennicutt, Jr., R. C., Chu, Y.-H., & Skillman, E. D. 1991, ApJ, 373, 458
- Georgiev et al. (1999) Georgiev, L., Borissova, J., Rosado, M., Kurtev, R., Ivanov, G., & Koenigsberger, G. 1999, A&AS, 134, 21
- Gieren et al. (2005) Gieren, W., Pietrzynski, G., Bresolin, F., Kudritzki, R.-P., Minniti, D., Urbaneja, M., Soszynski, I., Storm, J., Fouque, P., Bono, G., Walker, A., & Garcia, J. 2005, The Messenger, 121, 23
- Hodge et al. (1990) Hodge, P., Lee, M. G., & Gurwell, M. 1990, PASP, 102, 1245
- Hodge (1978) Hodge, P. W. 1978, ApJS, 37, 145
- Hodge et al. (1991) Hodge, P. W., Smith, T. R., Eskridge, P. B., MacGillivray, H. T., & Beard, S. M. 1991, ApJ, 369, 372
- Hoffman et al. (1996) Hoffman, G. L., Salpeter, E. E., Farhat, B., Roos, T., Williams, H., & Helou, G. 1996, ApJS, 105, 269
- Humphreys (1980) Humphreys, R. M. 1980, ApJ, 238, 65
- Izotov et al. (2006) Izotov, Y. I., Stasińska, G., Meynet, G., Guseva, N. G., & Thuan, T. X. 2006, A&A, 448, 955
- Jaschek et al. (1980) Jaschek, M., Jaschek, C., Hubert-Delplace, A.-M., & Hubert, H. 1980, A&AS, 42, 103
- Kingsburgh & Barlow (1994) Kingsburgh, R. L. & Barlow, M. J. 1994, MNRAS, 271, 257
- Kingsburgh & Barlow (1995) —. 1995, A&A, 295, 171
- Lake & Skillman (1989) Lake, G. & Skillman, E. D. 1989, AJ, 98, 1274
- Lee et al. (2003) Lee, H., Grebel, E. K., & Hodge, P. W. 2003, A&A, 401, 141
- Lennon (1997) Lennon, D. J. 1997, A&A, 317, 871
- Lequeux et al. (1987) Lequeux, J., Meyssonnier, N., & Azzopardi, M. 1987, A&AS, 67, 169
- Lozinskaya et al. (2002) Lozinskaya, T. A., Arkhipova, V. P., Moiseev, A. V., & Afanas’Ev, V. L. 2002, Astronomy Reports, 46, 16
- Lozinskaya et al. (2003) Lozinskaya, T. A., Moiseev, A. V., & Podorvanyuk, N. Y. 2003, Astronomy Letters, 29, 77
- Lu et al. (1993) Lu, N. Y., Hoffman, G. L., Groff, T., Roos, T., & Lamphier, C. 1993, ApJS, 88, 383
- Maeder et al. (1999) Maeder, A., Grebel, E. K., & Mermilliod, J.-C. 1999, A&A, 346, 459
- Martayan et al. (2007) Martayan, C., Frémat, Y., Hubert, A.-M., Floquet, M., Zorec, J., & Neiner, C. 2007, A&A, 462, 683
- Martins et al. (2005) Martins, F., Schaerer, D., & Hillier, D. J. 2005, A&A, 436, 1049
- McConnachie & Irwin (2006) McConnachie, A. W. & Irwin, M. J. 2006, MNRAS, 365, 902
- Meaburn et al. (1988) Meaburn, J., Clayton, C. A., & Whitehead, M. J. 1988, MNRAS, 235, 479
- Peimbert et al. (1988) Peimbert, M., Bohigas, J., & Torres-Peimbert, S. 1988, Revista Mexicana de Astronomia y Astrofisica, 16, 45
- Pietrzyński et al. (2006) Pietrzyński, G., Gieren, W., Soszyński, I., Bresolin, F., Kudritzki, R.-P., Dall’Ora, M., Storm, J., & Bono, G. 2006, ApJ, 642, 216
- Puls et al. (2005) Puls, J., Urbaneja, M. A., Venero, R., Repolust, T., Springmann, U., Jokuthy, A., & Mokiem, M. R. 2005, A&A, 435, 669
- Rizzi et al. (2007) Rizzi, L., Tully, R. B., Makarov, D., Makarova, L., Dolphin, A. E., Sakai, S., & Shaya, E. J. 2007, ArXiv Astrophysics e-prints
- Sandage (1971) Sandage, A. 1971, ApJ, 166, 13
- Sandage & Katem (1976) Sandage, A. & Katem, B. 1976, AJ, 81, 743
- Santolaya-Rey et al. (1997) Santolaya-Rey, A. E., Puls, J., & Herrero, A. 1997, A&A, 323, 488
- Schlegel et al. (1998) Schlegel, D. J., Finkbeiner, D. P., & Davis, M. 1998, ApJ, 500, 525
- Schmidt-Kaler (1982) Schmidt-Kaler, T. 1982, Landolt-Börnstein: Numerical Data and Functional Relationships in Science and Technology, Vol. VI (K. Schaifers and H.H. Voigt (Springer-Verlag, Berlin))
- Silich et al. (2006) Silich, S., Lozinskaya, T., Moiseev, A., Podorvanuk, N., Rosado, M., Borissova, J., & Valdez-Gutierrez, M. 2006, A&A, 448, 123
- Skillman et al. (2003) Skillman, E. D., Tolstoy, E., Cole, A. A., Dolphin, A. E., Saha, A., Gallagher, J. S., Dohm-Palmer, R. C., & Mateo, M. 2003, ApJ, 596, 253
- Trundle et al. (2004) Trundle, C., Lennon, D. J., Puls, J., & Dufton, P. L. 2004, A&A, 417, 217
- Udalski et al. (2001) Udalski, A., Wyrzykowski, L., Pietrzynski, G., Szewczyk, O., Szymanski, M., Kubiak, M., Soszynski, I., & Zebrun, K. 2001, Acta Astronomica, 51, 221
- Urbaneja et al. (2003) Urbaneja, M. A., Herrero, A., Bresolin, F., Kudritzki, R.-P., Gieren, W., & Puls, J. 2003, ApJ, 584, L73
- Urbaneja et al. (2005) Urbaneja, M. A., Herrero, A., Bresolin, F., Kudritzki, R.-P., Gieren, W., Puls, J., Przybilla, N., Najarro, F., & Pietrzyński, G. 2005, ApJ, 622, 862
- Valdez-Gutiérrez et al. (2001) Valdez-Gutiérrez, M., Rosado, M., Georgiev, L., Borissova, J., & Kurtev, R. 2001, A&A, 366, 35
- van Dokkum (2001) van Dokkum, P. G. 2001, PASP, 113, 1420
- Walborn (1971) Walborn, N. R. 1971, ApJS, 23, 257
- Walborn & Fitzpatrick (1990) Walborn, N. R. & Fitzpatrick, E. L. 1990, PASP, 102, 379
- Walborn et al. (2000) Walborn, N. R., Lennon, D. J., Heap, S. R., Lindler, D. J., Smith, L. J., Evans, C. J., & Parker, J. W. 2000, PASP, 112, 1243
- Weaver et al. (1977) Weaver, R., McCray, R., Castor, J., Shapiro, P., & Moore, R. 1977, ApJ, 218, 377
- Wilhelm et al. (1999a) Wilhelm, R., Beers, T. C., & Gray, R. O. 1999a, AJ, 117, 2308
- Wilhelm et al. (1999b) Wilhelm, R., Beers, T. C., Sommer-Larsen, J., Pier, J. R., Layden, A. C., Flynn, C., Rossi, S., & Christensen, P. R. 1999b, AJ, 117, 2329
- Wisniewski & Bjorkman (2006) Wisniewski, J. P. & Bjorkman, K. S. 2006, ApJ, 652, 458