The Distances to Open Clusters from Main-Sequence Fitting. IV.
Galactic Cepheids, the LMC, and the Local Distance Scale
Abstract
We derive the basic properties of seven Galactic open clusters containing Cepheids and construct their period-luminosity (P-L) relations. For our cluster main-sequence fitting we extend previous Hyades-based empirical color-temperature corrections to hotter stars using the Pleiades as a template. We use data to test the reddening law and include metallicity effects to perform a more comprehensive study for our clusters than prior efforts. The ratio of total to selective extinction that we derive is consistent with expectations. Assuming the LMC P-L slopes, we find for 10-day period Cepheids, which is generally fainter than those in previous studies. Our results are consistent with recent HST and Hipparcos parallax studies when using the Wesenheit magnitudes . Uncertainties in reddening and metallicity are the major remaining sources of error in the -band P-L relation, but a higher precision could be obtained with deeper optical and near-infrared cluster photometry. We derive distances to NGC 4258, the LMC, and M33 of , , and , respectively, with an additional systematic error of mag in the P-L relations. The distance to NGC 4258 is in good agreement with the geometric distance derived from water masers , our value for M33 is less consistent with the distance from an eclipsing binary [], and our LMC distance is moderately shorter than the adopted distance in the HST Key Project, which formally implies an increase in the Hubble constant of .
Subject headings:
Cepheids — distance scale — galaxies: individual (M33, NGC 4258) — Magellanic Clouds — open clusters and associations: general — stars: distances1. Introduction
The Cepheid period-luminosity (P-L) relation has played a key role in the determination of distances within the Local Group and to nearby galaxies. By extension, it is also crucial for the calibration of secondary distance indicators used to determine the Hubble constant: see, for example, the Hubble Space Telescope (HST) Key Project on the extragalactic distance scale (Freedman et al., 2001, hereafter HST Key Project) and the HST program for the luminosity calibration of Type Ia supernovae (SNe Ia) by means of Cepheids (Sandage et al., 2006). The cosmic distance scale was usually established by defining the P-L relations for Cepheids in the Large Magellanic Cloud (LMC) because of its numerous Cepheids, many of which have been discovered as a result of microlensing campaigns (e.g., Udalski et al., 1999a). Despite decades of effort, however, there have been persistent differences in the inferred LMC distance from different methods (see Benedict et al., 2002a), including ones involving the same basic calibrators such as RR Lyrae or Cepheid variables.
The Galactic P-L relationship, on the other hand, was traditionally established using open clusters and associations containing Cepheids (see Feast & Walker, 1987; Feast, 2003; Sandage & Tammann, 2006). There is also a steadily growing body of parallax work from the Hipparcos mission (Feast & Catchpole, 1997; Madore & Freedman, 1998; Lanoix et al., 1999; Groenewegen & Oudmaijer, 2000; van Leeuwen et al., 2007) and the HST (Benedict et al., 2002b, 2007), as well as distances derived from the Baade-Becker-Wesselink moving atmospheres method (Gieren et al., 1997, 1998, 2005) and interferometric angular diameter measurements (Lane et al., 2000, 2002; Kervella et al., 2004a, b). In the current paper we focus on the Cepheid distance scale as inferred from Galactic open clusters and its applications for the extragalactic distance scale.
There are strengths and weaknesses in all of the methods used to establish the Galactic Cepheid distance scale. The absolute calibration of the P-L relation requires not only accurate distance measurements but also appropriate accounting for the effects of interstellar extinction and reddening because Galactic Cepheids are heavily obscured with an average of order 0.5 mag (Fernie, 1990). Reddening can be inferred more precisely for clusters, while field Cepheids are more numerous. This difficulty can be partially overcome by the usage of the “reddening-free” or Wesenheit index (Freedman et al., 1991), but there are embedded assumptions about the extinction law even in such a system.
We believe that the time is right for a systematic reappraisal of the Cepheid distance scale as inferred from open clusters. Recent parallax work employing the Wesenheit index (Benedict et al., 2007; van Leeuwen et al., 2007) has yielded consistent claims of a somewhat smaller LMC distance modulus ( mag) than the ones adopted by the HST Key Project ( mag) or Sandage et al. program ( mag). In addition, there are now independent geometric tests of distances to other galaxies, which have large numbers of Cepheids. These include massive eclipsing binaries in systems such as M31 (Ribas et al., 2005) and M33 (Bonanos et al., 2006) and astrophysical water masers in NGC 4258 (Herrnstein et al., 1999). As described below, the availability of both more complete data in various photometric passbands and better theoretical templates permits a more comprehensive look at the open cluster Cepheid distance scale, which can in turn be compared with the alternate methods described above. We can also use the open clusters with Cepheids to test our ability to derive precise distances and reddenings to heavily obscured and poorly studied systems. We believe that the net result is a more secure and robust determination of the extragalactic distance scale.
We have been engaged in a long-term effort to create stellar evolution models with the latest input physics and to generate isochrones that are calibrated against photometry in local star clusters with accurate distances. After verifying that the models are in agreement with the physical parameters of binaries and single stars in the Hyades (Pinsonneault et al., 2003, 2004, hereafter Papers I and II, respectively), we developed a procedure for empirically correcting the color-effective temperature () relations to match photometry in the Hyades (Paper II). Isochrones generated in this way accurately reproduce the shapes of the main-sequence (MS) in several colors, allowing the determination of distances to nearby clusters to an accuracy of mag in distance modulus (or in distance) (An et al., 2007, hereafter Paper III).
We extend the Hyades-based empirical corrections on theoretical isochrones using the Pleiades and apply our techniques to a set of Cepheid-bearing open clusters that have good multi-color photometry. Selection of cluster sample and compilation of cluster photometry are presented in § 2. Procedures on the isochrone calibration and MS-fitting method are described in § 3. New cluster distances and extinctions are presented in § 4. In § 5 we construct multi-wavelength Galactic P-L relations and discuss various systematic errors. In § 6 we estimate distances and reddenings for the maser galaxy NGC 4258, the LMC, and M33. We summarize our results in § 7 and discuss the importance of extinction corrections in the Cepheid distance scale.
2. Cluster and Cepheid Data
2.1. Cluster Selection, Metallicity, and Age
| Cluster | Other Nameaa“C” cluster designation from Lyngå (1987). | Cepheid | [M/H]bbAn effective metallicity estimated from [Fe/H] and [/Fe] in Fry & Carney (1997) using the Kim et al. (2002) procedure. | |||||||
|---|---|---|---|---|---|---|---|---|---|---|
| NGC 129 | C0027599 | DL Cas | 0.903 | 10.119 | 8.969 | 7.655 | ||||
| VDB 1ccAlso named CV Mon cluster or anonymous VDB cluster (van den Bergh, 1957). | C0634031 | CV Mon | 0.731 | 11.607 | 10.304 | 8.646 | 7.310 | 6.783 | 6.475 | |
| NGC 5662 | C1431563 | V Cen | 0.740 | 7.694 | 6.820 | 5.805 | 5.006 | 4.623 | 4.462 | |
| Lyngå 6 | C1601517 | TW Nor | 1.033 | 13.672 | 11.667 | 9.287 | 7.403 | 6.686 | 6.225 | |
| NGC 6067 | C1609540 | V340 Nor | 1.053 | 9.526 | 8.370 | 7.168 | 6.192 | 5.724 | 5.515 | |
| NGC 6087 | C1614577 | S Nor | 0.989 | 7.373 | 6.429 | 5.422 | 4.661 | 4.269 | 4.115 | |
| M25 | C1828192 | U Sgr | 0.829 | 7.792 | 6.695 | 5.448 | 4.511 | 4.085 | 3.892 | |
| NGC 7790 | C2355609 | CEa Cas | 0.711 | 12.070 | 10.920 | 9.470ddTaken from Tammann et al. (2003). | ||||
| NGC 7790 | C2355609 | CEb Cas | 0.651 | 12.220 | 11.050 | 9.690ddTaken from Tammann et al. (2003). | ||||
| NGC 7790 | C2355609 | CF Cas | 0.688 | 12.335 | 11.136 | 9.754 |
About 30 open clusters and associations in the Galaxy are known to harbor Cepheid variables (Feast & Walker, 1987; Feast, 1999), but not all of these are useful for MS fitting because many are extremely sparse or poorly studied. We first excluded systems with overtone or double-mode Cepheids and then examined the available photoelectric and/or CCD photometry for each cluster. From visual inspection of color-magnitude diagrams (CMDs) we narrowed down the list to 10 promising candidates for MS fitting. The populous twin clusters Per were excluded from the current analysis because their young age introduces significant uncertainties in the isochrone calibration, and the membership of UY Per in the clusters is also doubtful (see Walker, 1987, and references therein). The eight remaining clusters are listed in Table 1 with their 10 Cepheid variables. We denoted anonymous van den Bergh (C0634+031; van den Bergh, 1957) as VDB 1 for brevity. Most of them are close enough that Two Micron All Sky Survey (2MASS) (Skrutskie et al., 2006) photometry reaches well down the MS.
It is likely that all Cepheids in Table 1 are members of their associated clusters. For the three Cepheids in NGC 7790 there exist no radial velocity or proper-motion measurements, although all of them lie near the optical center of the cluster (Sandage, 1958). V Cen is located about away from the center of NGC 5662, but Baumgardt et al. (2000) derived a high membership probability from Hipparcos proper motions. The rest of the Cepheids are generally considered to be members of their clusters since they are located within the optical radius defined by bright early-type MS stars and red giants. In many cases, membership is also supported by radial velocities (Mermilliod et al., 1987, and references therein) and proper motions (Baumgardt et al., 2000, and references therein). Orsatti et al. (2001) suggested that TW Nor may not be a member of Lyngå 6 from polarization measurements, but we nevertheless included it here.
Previous studies have neglected the effects of cluster metallicity and age on MS fitting (e.g., Feast & Walker, 1987; Hoyle et al., 2003). However, the luminosity of the MS at a fixed color (or ) is sensitive to the metal abundance by (Paper III). In addition, the cluster age changes the mean color of the upper MS by between zero-age MS (ZAMS) and Myr isochrone, which is more appropriate for Cepheid-bearing clusters (see below). This, in turn, could affect the reddening estimates from the upper MS by and an MS-fitting distance by .
We adopted Cepheid metal abundances from the high-resolution spectroscopy of Fry & Carney (1997) and assumed the same metallicities for the clusters. In support of this assumption, Fry & Carney derived metallicities for two dwarfs in M25 that are in agreement with the metallicity of U Sgr. In addition, Fry & Carney measured for two Pleiades dwarfs, which is in good agreement with our adopted value for the Pleiades, .
Fry & Carney also derived -element abundances (Si, Ca, and Ti) for their sample. For the stars in this paper, the average enhancement is . We determined an effective metallicity [M/H] from the measured [Fe/H] and [/Fe] using the Kim et al. (2002) procedure. These abundances are shown in the fourth column of Table 1. The mean metal abundance of our sample is and the standard deviation is dex, indicating an intrinsic spread in metallicity for our clusters. On average, the rescaled [M/H] are larger than [Fe/H] by dex. We computed errors in [M/H] by propagation of errors in [Fe/H] and [/Fe].
The metallicity scale for the Cepheids is probably robust to dex. As part of a larger study, Yong et al. (2006) reanalyzed spectra of 11 Cepheids in Fry & Carney and derived lower [Fe/H] by dex and lower -element enhancement by dex on average. The mean difference in the total metallicity is , in the sense that the new analysis indicates lower values. Independently, Andrievsky et al. (2002) measured abundances of 19 Cepheids in common with Fry & Carney. The average difference between these two studies is dex in [Fe/H], the Andrievsky et al. values being larger. They also showed that the alpha abundance ratio ([Si, Ca, Ti/Fe]) is nearly solar, which results in a small difference in the total metal abundance between Fry & Carney and Andrievsky et al., .
We adopted a single representative age (80 Myr) for all clusters, based on comparing our isochrones (§ 3.1) to the cluster CMDs (§ 2.2), and took its uncertainty as ( Myr). The uncertainty represents both a range of ages among the clusters and the accuracy of the fitting. The average age in the Lyngå Open Clusters Catalog (Lyngå, 1987) is 72 Myr for our sample clusters with a standard deviation of 38 Myr. Previous age estimates based on isochrone fitting are generally within our adopted age range. Mermilliod (1981) found that NGC 7790 and NGC 6067 are about as old as the Pleiades (78 Myr) from models with core overshooting. Meynet et al. (1993) estimated Myr for NGC 5662 and NGC 6087 when the Pleiades is 100 Myr old from core-overshooting models, while the age of NGC 6067 was estimated to be Myr. Cluster ages can also be inferred from the masses of Cepheids. There are several classical Cepheids in binary systems, and these have dynamical masses of about (Böhm-Vitense et al., 1998; Evans & Bolton, 1990; Evans et al., 1997, 1998, 2006) over the period range similar to those of our sample []. For our models, stars of this mass range have an MS lifetime of about Myr.
2.2. Photometry
For the photometry of the Cepheids, we used intensity-mean apparent magnitudes in from Berdnikov et al. (2000), which are on the Cape (Cousins) system as realized by Landolt (1983, 1992). For CEa Cas and CEb Cas, the -band measurements were taken from Tammann et al. (2003). We adopted photometry from Laney & Stobie (1992) on the Carter (1990) system and transformed it to the LCO system using the Persson et al. (2004) transformation equations. We assumed mag zero-point error in the Cepheid photometry and treated this error independently from the cluster photometry (see below). Table 1 lists the Cepheid photometry.
| Reference | ||||
|---|---|---|---|---|
| NGC 129 | ||||
| Arp et al. (1959) | 26 | 26 | ||
| Hoag et al. (1961) | 18 | 18 | ||
| Turner et al. (1992) | 20 | 22 | ||
| Phelps & Janes (1994) | standard | standard | ||
| VDB 1 | ||||
| Arp (1960) | standard | standard | ||
| Turner et al. (1998) | tied to Arp | tied to Arp | ||
| NGC 5662 | ||||
| Moffat & Vogt (1973) | 13 | 28 | ||
| Haug (1978) | standard | 20 | ||
| Clariá et al. (1991) | 19 | standard | ||
| Sagar & Cannon (1997) | 10 | 14 | ||
| Lyngå 6 | ||||
| Madore (1975) | 8 | 9 | ||
| Moffat & Vogt (1975) | 9 | 10 | ||
| van den Bergh & Harris (1976) | 12 | 12 | ||
| Walker (1985) | standard | standard | ||
| NGC 6067 | ||||
| Thackeray et al. (1962) | 15 | 14 | ||
| Walker & Coulson (1985) | standard | standard | ||
| Piatti et al. (1998) | aaComparison for stars with . | 123 | ||
| NGC 6087 | ||||
| Fernie (1961) | 9 | 10 | ||
| Breger (1966) | 18 | 17 | ||
| Turner (1986) | standard | standard | ||
| Sagar & Cannon (1997) | 2 | 2 | ||
| M25 | ||||
| Johnson (1960) | 74 | standard | ||
| Sandage (1960) | 51 | 68 | ||
| Wampler et al. (1961) | standard | 51 | ||
| NGC 7790 | ||||
| Sandage (1958) | 26 | 26 | ||
| Romeo et al. (1989) | 186 | 184 | ||
| Phelps & Janes (1994) | 360 | 337 | ||
| Lee & Lee (1999) | 164 | 157 | ||
| Gupta et al. (2000) | 192 | 187 | ||
| Stetson (2000) | standard | standard | ||
Note. — The mean color and magnitude differences are computed after rejection. Uncertainties are the standard error of the mean. The differences are in the sense of individual values minus those adopted as the local standard. The photometry in Turner et al. (1998) are directly tied to the photometry of Arp (1960).
For the cluster photometry, we compiled photoelectric and CCD data on the Johnson-Cousins system from the literature, as well as from WEBDA (Mermilliod & Paunzen, 2003).111See http://obswww.unige.ch/webda/webda.html. The references for the photometry are shown in Table 2, where we used WEBDA’s cross-identification of optical sources among different references except for a few cases where we found missing entries and misidentifications. For each cluster we picked one or two references to define a local standard in or by weighing factors such as the number of observations, number of stars with photometry, magnitude range in , the photometric calibration procedure, and whether the photometry was generally in agreement with data in other studies. The remaining columns of Table 2 show the mean differences in and with respect to the local standard, and the number of stars in common. The errors shown are standard errors of the mean difference. For VDB 1 we combined the photoelectric photometry by Arp (1960) and CCD photometry by Turner et al. (1998, their Table 2), whose photometry was tied to the former study.
In most cases the differences between one study and another showed no trends with magnitude. In M25, however, the differences in between Johnson (1960) and Sandage (1960) were statistically significant ():
Similarly, in NGC 6087 there were significant trends with magnitude for Fernie (1961) and Breger (1966) with respect to Turner (1986):
We applied these corrections to put them on the same scale as the reference photometry. For NGC 7790 we only used the photometry by Stetson (2000), although we computed the differences with respect to other studies and included these in Table 2. We applied zero-point corrections to individual values if the average difference was significant at the level. After shifting to a common scale, magnitudes and colors in multiple studies were averaged together. The weighted rms differences between the studies in Table 2 are 0.026 mag in and 0.024 mag in . We therefore adopted 0.025 mag as the characteristic size of systematic errors in the photometry.
Useful photometry for MS fitting is limited only to four clusters: VDB 1 (Turner et al., 1998), Lyngå 6 (Walker, 1985), NGC 6067 (Piatti et al., 1998), and NGC 7790 (Romeo et al., 1989; Gupta et al., 2000; Stetson, 2000). As with we adopted the Stetson (2000) photometry for NGC 7790. Compared to Stetson’s data, the photometry in Romeo et al. (1989) is bluer by mag, and the photometry in Gupta et al. (2000) is redder by . Assuming these values as a characteristic size of error, we adopted mag for the photometric zero-point error in .
We combined optical photometry with measurements from the All Sky Data Release of the 2MASS Point Source Catalog (PSC)222See http://www.ipac.caltech.edu/2mass/.. WEBDA provides celestial coordinates for only a small fraction of stars in this study. For the others we identified each source on the images from the Digitized Sky Survey,333The Digitized Sky Surveys were produced at the Space Telescope Science Institute under US Government grant NAG W-2166. The images of these surveys are based on photographic data obtained using the Oschin Schmidt Telescope on Palomar Mountain and the UK Schmidt Telescope. The plates were processed into the present compressed digital form with the permission of these institutions. or we computed the celestial coordinates from the plate position information in WEBDA. The rms difference between the retrieved and the 2MASS coordinates was typically . For NGC 6067 we matched 2MASS sources with optical photometry only for those stars with good positional accuracy. The validation of the 2MASS source matches was confirmed from the resulting tight optical and near-infrared color-color relations. Based on PSC flag parameters, we ignored the infrared data if sources were undetected, blended, or contaminated. Calibration errors in were taken as the uncertainty specified in the explanatory supplement to the 2MASS All Sky Data Release: mag in , mag in , and mag in .444See http://www.ipac.caltech.edu/2mass/releases/allsky/doc/explsup.html.
Most studies do not report individual errors in optical magnitude or color, so we computed the median of and differences from various studies (after shifting to a common scale using the criterion) and assigned this value to represent the random photometric errors for all stars in each cluster. For we assigned 0.02 mag as the random error. Errors for individual stars in Stetson (2000) were adopted without change. The errors were computed as the quadrature sum of errors and the catalog’s “total” photometric uncertainties in .
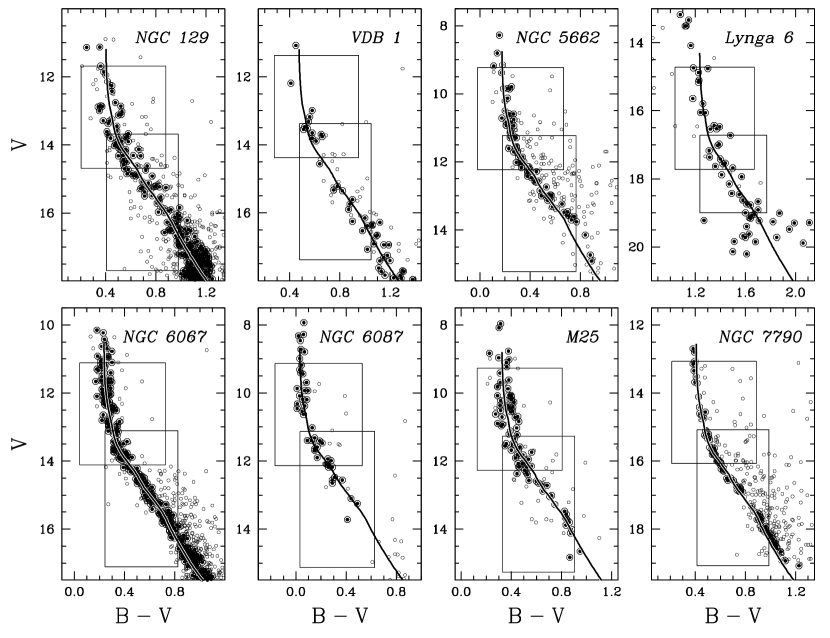
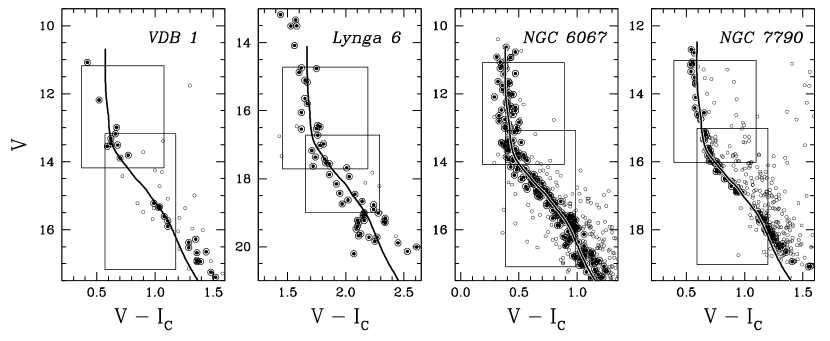
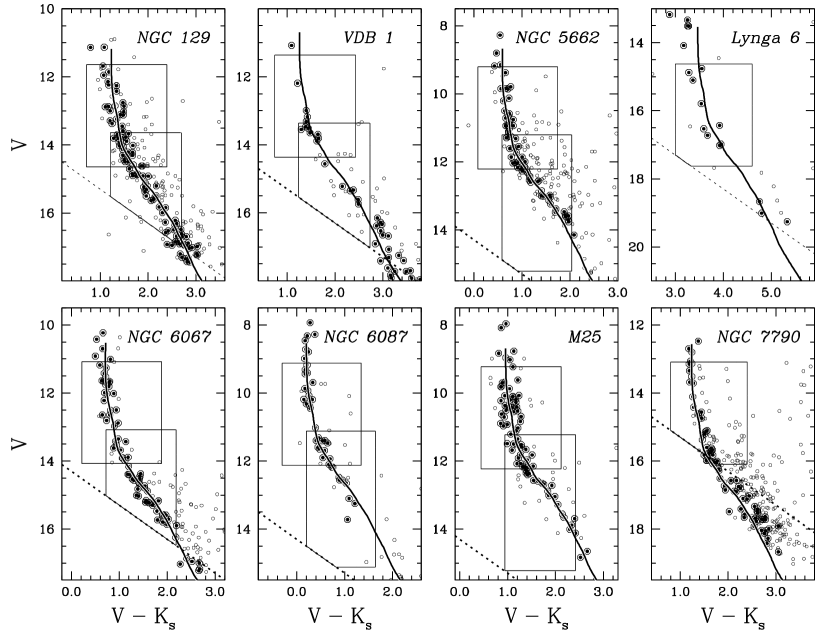
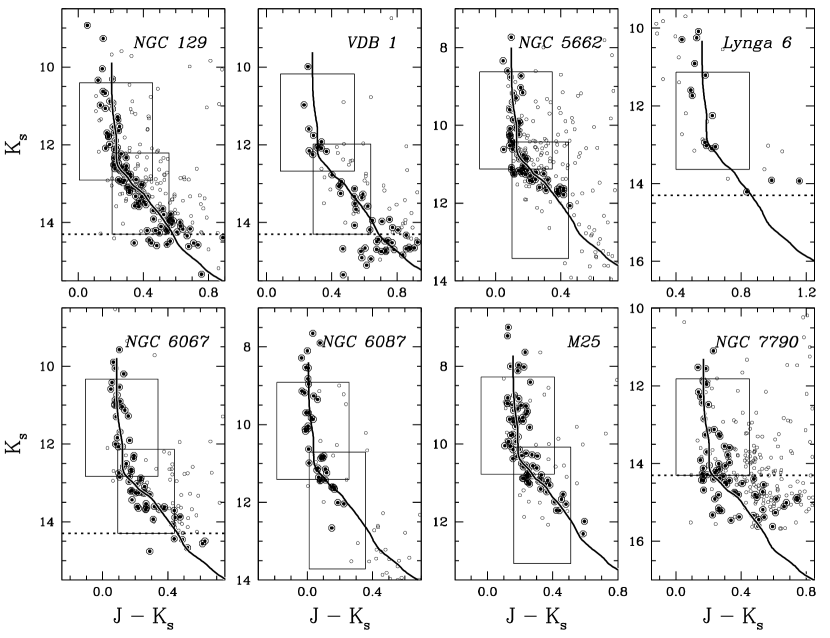
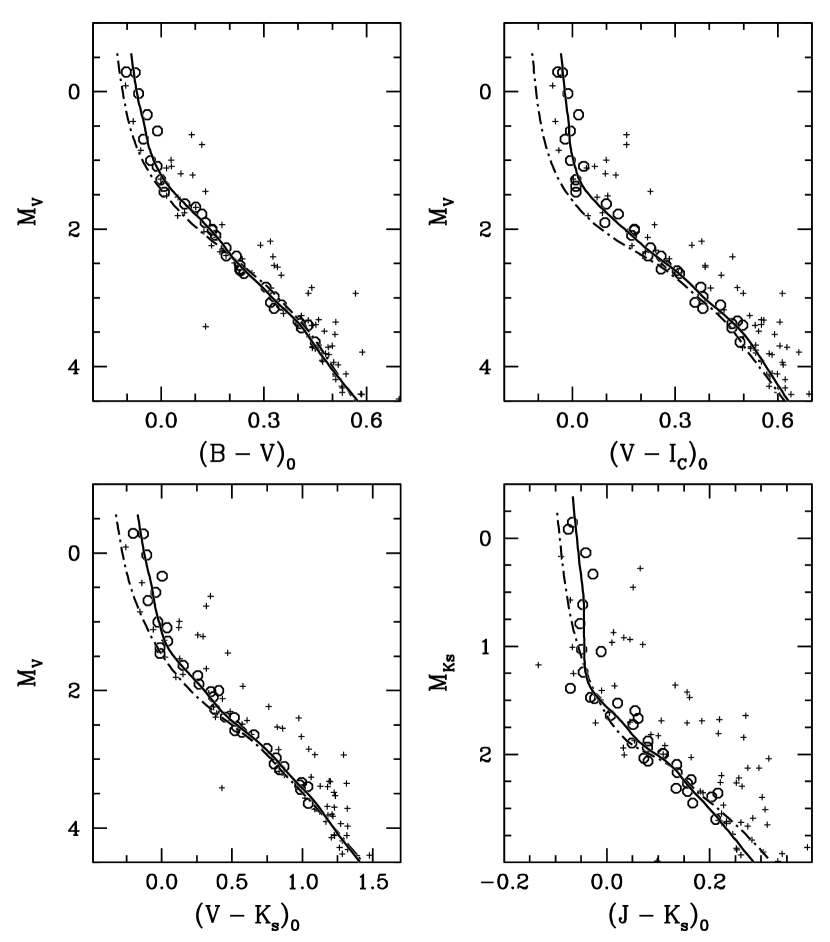
The cluster CMDs in various color combinations are shown in Figures 1 through 4. Stars rejected as being far from the MS are shown as open circles, while those used in the MS fitting are shown as bull’s-eyes. The curved line in each panel is the best-fitting isochrone on each CMD. Details of the MS fitting and outlier rejection are given in the next section. Throughout this paper we denote CMDs by their color and luminosity indices as , , , , and .
3. Main-Sequence Fitting
3.1. Extension of Isochrone Calibration
In our first two papers of this series (Paper I and Paper II), we assessed the accuracy of distances from MS fitting and examined systematic errors in the transformation of theoretical to observational quantities. In Paper I we demonstrated that stellar models from the Yale Rotating Evolutionary Code (Sills et al., 2000) are in agreement with the masses and luminosities of the well-studied Hyades eclipsing binary vB 22 (Torres & Ribas, 2002). These models also satisfy stringent tests from helioseismology and predict solar neutrino fluxes in line with observations (Basu et al., 2000; Bahcall et al., 2001; Bahcall & Pinsonneault, 2004). In Paper II we showed that the models provide a good match to the spectroscopically determined temperatures (Paulson et al., 2003) of individual Hyades members with good parallaxes (de Bruijne et al., 2001). However, we found that any of the widely-used color- relations (e.g., Alonso et al., 1995, 1996; Lejeune et al., 1997, 1998, hereafter LCB) fail to reproduce the observed shapes of the MS in the Hyades, having differences in broadband colors as large as mag. The existence of these systematic errors in the colors, in the presence of agreement between the spectroscopic and theoretical luminosity- scales, led us to argue that the problems lie with the adopted color- relations instead of errors in the theoretical scale. We then adopted the LCB color- relations and computed empirical corrections to the LCB relations to match photometry in the Hyades. In Paper III we showed that isochrones with the empirical color- corrections accurately match the MS shapes of other nearby clusters in three color indices (, , and ), yielding distance estimates with errors as small as 0.04 mag in distance modulus (or 2% in distance).
However, the Hyades-based calibration is of limited use for this study. The calibration is reliable only at because the number of stars in the upper MS of the Hyades is small in this relatively old open cluster (550 Myr from models excluding convective overshoot; Perryman et al., 1998). On the other hand, photometry of our sample clusters is quite sparse or absent in this lower MS part. It is therefore desirable to define an extension of the empirical color- corrections for hotter and brighter stars. A good choice for a calibrating cluster is the Pleiades for several reasons. First of all, its geometric distance is now known to a precision comparable to that of the Hyades, (see Paper III and references therein for a detailed discussion of the cluster parameters). Second, it has low reddening, . Third, a precise metal abundance from high-resolution spectra is available, . Furthermore, Cepheid clusters tend to be of ages comparable to that of the Pleiades, making it a good template for distance and reddening estimates.
| IDaaThe star designation is that of Hertzsprung (1947), Hz II; and Trumpler (1921), TS. | |||||||
|---|---|---|---|---|---|---|---|
| Hz II 153 | |||||||
| Hz II 447 | |||||||
| Hz II 531 | |||||||
| Hz II 817 | |||||||
| Hz II 859 | |||||||
| Hz II 1028 | |||||||
| Hz II 1139 | |||||||
| Hz II 1234 | |||||||
| Hz II 1362 | |||||||
| Hz II 1375 | |||||||
| Hz II 1407 | |||||||
| Hz II 1823 | |||||||
| Hz II 1993 | |||||||
| Hz II 2195 | |||||||
| Hz II 2345 | |||||||
| Hz II 2717 | |||||||
| Hz II 3031 | |||||||
| Hz II 3302 | |||||||
| Hz II 3308 | |||||||
| Hz II 3309 | |||||||
| Hz II 3310 | |||||||
| Hz II 3319 | |||||||
| Hz II 3332 | |||||||
| Hz II 3334 | |||||||
| Hz II 5016 | |||||||
| Hz II 5023 | |||||||
| Hz II 5025 | |||||||
| TS 23 | |||||||
| TS 25 | |||||||
| TS 78 | |||||||
| TS 84 | |||||||
| TS 115 | |||||||
| TS 137 | |||||||
| TS 165 | |||||||
| TS 194 |
The sources of our Pleiades photometry are described in Paper III. We began by removing a few known binaries and then rejected stars that are more than 0.1 mag in color away from a 15 point median of the sample sorted in ; this step was independent of the theoretical isochrones. Table 3 lists photometry of the hot Pleiades stars that remained after this selection. The CMDs of these stars are shown in Figure 5. Small plus signs denote stars rejected as far from the MS, while open circles show stars retained for use in the following calibration process.

In the course of this work we became aware of some problematic features in the LCB color tables. They computed synthetic colors from both the “original” and the “corrected” model flux distributions (hereafter original and corrected LCB tables, respectively). In Figure 6 we compare the corrected LCB table with the original LCB table for MS stars (). The LCB empirical color- relations (corrected LCB table) are defined only for , which results in an artificial jump in CMDs, particularly in the -band bolometric correction. In addition, there are small scale structures in the color corrections (especially in ) that cause interpolation noise in our isochrones at K. We therefore used the original LCB table above 8000 K, the corrected LCB table below 6500 K, and a linear ramp between the two tables in order to produce smoother base isochrones. Isochrones at an age of 100 Myr generated with these “merged” color- relations are shown as dot-dashed lines in Figure 5. However, these still fail to match the observed MS of the Pleiades and therefore require further corrections.

We derived empirical corrections to the isochrone in , , , and by forcing a match to the Pleiades photometry as done for the Hyades (Paper II). Figure 7 plots the difference in color between individual stars and an isochrone generated with the merged LCB color- relations. The was calculated from . Filled circles are for the Pleiades stars, and the open circles are for the Hyades stars used in the calibration of the lower MS. The Pleiades stars have smaller error bars than the Hyades points because we assumed a negligible distance spread for the Pleiades, while the Hyades ones reflect parallax errors for individual stars (de Bruijne et al., 2001). The solid lines in Figure 7 represent our empirical corrections, which were computed at a constant in a seven-point moving window. Given the modest sample size and intrinsic scatter in the upper MS, we did not attempt to resolve out smaller scale structures. We defined the empirical color- corrections as those for the Pleiades at K and for the Hyades at K. A spline function was used to bridge over the narrow gap between these two corrections. We also used in MS fitting but without color corrections because photometric errors were too large in this color to provide a reliable calibration.
| (K) | |||||||||
|---|---|---|---|---|---|---|---|---|---|
Applying these corrections to the colors at each defines
the empirically calibrated isochrone for the Pleiades, which is tabulated
along with the color corrections in Table 4. Isochrones
incorporating the corrections for the Pleiades are shown as solid lines
in Figure 5. Systematic errors in the color corrections
are mag from the errors in the adopted distance, metallicity,
and reddening values for the Pleiades. We assumed that our empirical
corrections in the upper MS are independent of metallicity and age
and applied them to all isochrones generated in Paper III. The isochrones
constructed in this way are available online
at
http://www.astronomy.ohio-state.edu/iso/.
There is one important functional difference between the calibration for luminous stars and that for the lower MS stars. The MS for FGK-type stars is intrinsically very narrow. As a result, for the low-mass stars we could plausibly claim that the empirical cluster sequence could be used to redefine the color- relationship. On the other hand, the dispersion about the mean trend for upper MS stars is significantly larger. For the Pleiades, we found a dispersion of 0.02 mag in for (after excluding outliers), which is significantly above the photometric precision. A comparable increase was seen in and (0.02 and 0.04 mag, respectively). Although this could be due to differential reddening across the cluster field (Breger, 1986), the persistence of rapid rotation in early-type stars can impact both their evolution and the mapping of onto colors (e.g., Collins & Sonneborn, 1977) as a consequence of the Kraft (1965) break in rotational properties. Furthermore, these effects depend on both the rotation rate and the inclination to the line of sight and can be as large as 0.1 mag in . Nonetheless, the mean cluster locus can still be used to define a template for distance studies but should not be interpreted as a direct change in the color- relationship. In other words, our empirical corrections remove systematic trends from the rotation-induced color anomalies, as well as from any intrinsic problems in the adopted color- relationship.
3.2. Main-Sequence Fitting
We determined the distance, reddening, and the ratio of total to selective extinction in [] for each cluster via an iterative approach, which fits an isochrone to individual CMDs of various color indices. All of these parameters are essential to obtain self-consistent solutions for the absolute magnitude of a Cepheid (§ 5). Our MS-fitting process also includes rejection of stars that are too far away from an MS ridge-line, defined by the locus of points with the highest density on each CMD. Individual color excesses in each cluster were used to derive according to the extinction law described by Cardelli et al. (1989, hereafter CCM89). The rest of this section describes the MS-fitting process in detail.
Our sample clusters do not have detailed radial velocity or proper-motion membership studies. Before isochrone fitting we therefore applied the photometric filtering procedure described in Paper III to identify and reject stars that are likely foreground/background objects or cluster binaries. The procedure iteratively identifies a cluster MS ridge-line independently of the isochrones and rejects stars if they are too far away from the ridge-line. This was done by computing in each CMD as
| (1) |
where is the color difference between the data point and MS at the same ; and are photometric errors in color and , respectively. The error in contributes to the error in by the inverse slope of the MS, . We added in quadrature to the propagated photometric errors in the denominator to take into account the presence of differential reddening, cluster binaries, non-cluster members, and other effects that would increase the MS width above the photometric precision. We adjusted the value of so that the total is equal to the total number of stars used in the filtering.
Initially we rejected all data points as outliers if (the individual contribution to ) was greater than 9 (corresponding to a outlier). We repeated adjusting and rejecting outliers with the reduced set of data points until there remained no point with . We combined the results from all CMDs, and rejected stars if they were tagged as an outlier at least in one of the CMDs. Missing data in any colors was not a criterion for rejection. For this study we included and in the filtering procedure. We reduced the rejection threshold at each iteration until it was limited to –, but our result is insensitive to the final rejection threshold within the fitting errors.
Our filtering results are shown in Figures 1–4. The bull’s-eyes represent stars retained and used in the following MS fits, and open circles are the ones rejected by the filtering. At the end of the iteration, values in and were (0.055 mag, 0.101 mag) in NGC 129, (0.050 mag, 0.102 mag) in VDB 1, (0.023 mag, 0.064 mag) in NGC 5662, (0.048 mag, 0.102 mag) in Lyngå 6, (0.031 mag, 0.078 mag) in NGC 6067, (0.033 mag, 0.058 mag) in NGC 6087, (0.043 mag, 0.111 mag) in M25, and (0.011 mag, 0.026 mag) in NGC 7790. These excess dispersions are most likely due to differential reddening of heavily reddened, young open clusters. Note that the ratio of values from and is also approximately equal to the color-excess ratio (see below). We discuss in detail the effects of differential reddening on P-L relations in § 5. In and , photometric errors were usually large enough that values were automatically set to zero.
The fitting process took advantage of the changing slope of the MS with absolute magnitude. Near the MS turnoff (), the MS is nearly vertical, allowing a precise determination of the reddening. Further down (), the slope of the MS is still relatively steep [e.g., ], but it nevertheless provides sufficient leverage for determining the distance. We divided each CMD into two zones, shown as boxes in Figures 1–4, which define the regions used for determining the color excess and distance. The color excess was determined for stars with in , , and , and at in and . Distance determinations came from stars with and the corresponding color ranges in other colors with the same . For Lyngå 6 and NGC 7790, and were not used in the distance estimation because the lower parts of the MS are below the 2MASS completeness limit ().
| Color-Excess Ratios | CCM89aaEstimated at . | BCP98aaEstimated at . | This PaperbbWeighted mean and rms deviation. | OthersccRevised for zero-color stars using color-dependent reddening relations in BCP98. | ref |
|---|---|---|---|---|---|
| 1 | |||||
| 2,3,4 | |||||
| 4 | |||||
| 4 |
References. — (1) Dean et al. 1978; (2) Schultz & Wiemer 1975; (3) Sneden et al. 1978; (4) Rieke & Lebofsky 1985.
Note. — Color excesses involving 2MASS bandpasses are corrected for the difference in filter effective wavelengths.
Since the color excess and depend on the intrinsic color of stars, we adopted the color-dependent relations from Bessell et al. (1998, hereafter BCP98) and M. S. Bessell (2007, private communication). Their formulae were based on the theoretical stellar spectral energy distributions with the extinction law from Mathis (1990). Specifically, their formulation yields
| (2) |
| (3) |
where is an intrinsic color of each star. The and are the values for zero-color stars, where is in their model. For other colors we used the following color-excess ratios:
| (4) | |||||
| (5) | |||||
| (6) | |||||
| (7) |
The first terms represent the color-excess ratios from CCM89 at
, and the second terms are color-dependent relations
from BCP98. Differences
between the original coefficients in BCP98 and those for the 2MASS
system using transformation equations in Carpenter (2001)555
Updated color transformations for 2MASS All-sky Data Release can be found at
http://www.ipac.caltech.edu/2mass/releases/allsky/doc/sec6_4b.html.
were found to be negligible. Table 3.2 lists color-excess
ratios for zero-color stars from CCM89 and BCP98, as well as observationally
derived values from Schultz & Wiemer (1975), Dean et al. (1978), Sneden et al. (1978),
and Rieke & Lebofsky (1985). Color-excess ratios determined from our cluster
sample are also shown in the fourth column, which is discussed in
the next section.
The fitting process begins with a guess at the average distance. At this distance, individual color excesses for zero-color stars [, , etc.] were determined using stars on the upper MS. These were used to determine the best-fit and from the CCM89 extinction law by minimizing
| (8) |
where represents effective wavelengths in (Bessell et al., 1998) and isophotal wavelengths in (Cohen et al., 2003). The index in the summation runs over , , , , and . The is the fitting error in the upper MS, which was determined from the scatter of the points around the isochrone and the individual errors in color. The CCM89 color excess, , can be expressed as
| (9) |
where is a function of from polynomial relations in CCM89. Note that and in equation (8) are two parameters to be determined and that in equation (9) is the normalization factor, which is different from the input color excess in .
The fitting procedure then found weighted median distances on each CMD by using the stars in the lower part of the MS. The weighted average distance from all CMDs was computed, and the process was repeated until convergence, which occurred when the difference in the average distance from the previous iteration became smaller than its propagated error.

An example of the fit is shown in Figure 8 for NGC 6067. The solid line in the top panel is the best-fitting CCM89 extinction curve to the data (open circles). The bottom panel shows likelihood contours in and drawn at = 2.30, 6.17, and 11.8 from the minimum (68.3%, 95.4%, and 99.73% confidence levels for 2 degrees of freedom).
4. Cluster Properties
In this section we present our results on the distance, reddening, and of the sample clusters and evaluate various systematic errors in these parameters. In particular, we assess the accuracy of MS-fitting based on internal consistency of distances from multi-color CMDs. We show that our distance estimates are generally shorter than previous ZAMS-fitting results and that this is mainly due to our lower reddening estimates.
4.1. Distance, Reddening, and
| Cluster | aaWeighted average distance and its propagated error, not including systematic uncertainties. | bbStandard deviation of individual distance moduli. | ||||||||
|---|---|---|---|---|---|---|---|---|---|---|
| NGC 129 | 79 | 58 | 53 | |||||||
| VDB 1 | 20 | 13 | 13 | 18 | ||||||
| NGC 5662 | 52 | 46 | 37 | |||||||
| Lyngå 6 | 21 | 21 | ||||||||
| NGC 6067 | 141 | 120 | 43 | 35 | ||||||
| NGC 6087 | 22 | 20 | 19 | |||||||
| M25 | 45 | 36 | 35 | |||||||
| NGC 7790 | 63 | 57 | ||||||||
Note. — Formal fitting errors are shown for individual distance moduli with a number of points used in the fit.
| Cluster | aaStandard deviation of estimates from all CMDs except , after transforming color-excess values to using the CCM89 color-excess ratios. | ||||||||||
|---|---|---|---|---|---|---|---|---|---|---|---|
| NGC 129 | 53 | 45 | 43 | 41 | |||||||
| VDB 1 | 12 | 9 | 11 | 10 | 10 | ||||||
| NGC 5662 | 47 | 41 | 38 | 37 | |||||||
| Lyngå 6 | 23 | 22 | 9 | 8 | 9 | ||||||
| NGC 6067 | 107 | 67 | 31 | 26 | 22 | ||||||
| NGC 6087 | 30 | 25 | 24 | 24 | |||||||
| M25 | 60 | 52 | 47 | 47 | |||||||
| NGC 7790 | 35 | 33 | 27 | 28 | 28 |
Note. — Color excess values are those for zero-color stars (see text). Formal fitting errors are shown for individual color excesses with a number of points used in the fit.
Our MS-fitting results on the distance and color excess from individual CMDs are shown in Tables 6 and 7, respectively, along with a number of stars used in the fit. The last two columns in Table 6 show the weighted average distance modulus from all available CMDs with its propagated error and the standard deviation () of individual distances. The last column in Table 7 lists a standard deviation of from all CMDs, after transforming individual color-excess values in , , and to using the CCM89 reddening law (Table 3.2). We excluded from this computation since we found a large systematic deviation of our color-excess estimates from the CCM89 law as discussed below.

In Figures 1–4 the best-fitting isochrones are overlaid on the cluster CMDs. While there is some variation in the quality of the data, we could divide the sample clusters into three groups based on how tight the MS is on optical CMDs. The first group contains NGC 6067 and NGC 7790, which have well-populated CMDs and small fitting errors on each CMD. They also have a well-defined peak on the distribution of an individual star’s distance modulus as shown in Figure 9 for NGC 7790. The second group is NGC 129, NGC 5662, Lyngå 6, NGC 6087, and M25. These clusters have less well-defined peaks, either because of strong differential reddening (§ 5) or because of a bias in the sampling from photoelectric observations at faint magnitudes. The last group is VDB 1, which has a sparse MS and correspondingly large distance uncertainties.
We can also divide the clusters into groups by examining the difference in derived cluster properties from different colors. Clusters where the results from multi-color CMDs have a high internal consistency are strong cases, while clusters with substantial differences indicate problems. For the above first and second groups of clusters except Lyngå 6, the standard deviations of individual distances [ in Table 6] are 0.03–0.08 mag, which are generally consistent with the fitting error on individual CMDs. On the other hand, both Lyngå 6 and VDB 1 exhibit a larger dispersion in distance [ and mag, respectively], and they also have a larger standard deviation of from different colors ( in Table 7).
However, the dispersion in Lyngå 6 is consistent with the statistical scatter expected from the small sample size. By contrast, VDB 1 has a statistically unreliable result that demands its exclusion from our data set. For this cluster, the best distance estimates inferred from different colors disagree by much more than their individual error estimates would imply. One possible explanation for the internal inconsistency is that the cluster MS is contaminated by less reddened field stars as shown by spectral-type study (Preston, 1964). Because these stars happen to lie on the cluster MS, our photometric filtering could have misidentified cluster members. We therefore exclude VDB 1 from the following analysis and leave it for future studies.
| Source of Error | Quantity | |||
|---|---|---|---|---|
| (Myr) | ||||
| Helium () | ||||
| Fitting | ||||
| Total |
Note. — , , , , , and represent zero-point errors in the cluster photometry.
| Cluster | |||
|---|---|---|---|
| NGC 129 | |||
| NGC 5662 | |||
| Lyngå 6 | |||
| NGC 6067 | |||
| NGC 6087 | |||
| M25 | |||
| NGC 7790 |
Table 8 shows the error budget for NGC 6067 as an example. The first column displays individual sources of error, and the second column shows the size of the errors adopted for each quantity. The third through fifth columns list error contributions to , , and , respectively. The size of systematic errors in cluster metallicity, age, and photometry was discussed in § 2. The quantity represents the uncertainty in the helium abundance at fixed metallicity and comes from the consideration of the initial solar abundance and those of the Hyades and the Pleiades (Paper I and Paper III). The fitting errors represent the internal precision of the fit and were taken as the larger value of the propagated error or in Table 6. We estimated the fitting errors in and from the size of the contours on the distribution (e.g., Fig. 8). The total systematic error is the quadrature sum of these errors. The , , and of our cluster sample are listed in Table 9 with total systematic errors in these quantities.

Independently of the CCM89 reddening law, we also derived color-excess ratios based on our cluster sample. Figure 10 shows a correlation between and color-excess values in other color indices. Individual clusters are represented as a point, and fitting errors are shown only. The solid line is a linear fit to the data, constrained to pass through the origin. Table 3.2 summarizes our best-fit slopes of these lines or color-excess ratios. Our values are generally in good agreement with the CCM89 law and other observational estimates. However, our method yields a lower than these studies, which may reflect a zero-point offset in of our isochrones. Note that we did not derive color corrections for .
4.2. Comparison with Previous Studies
| Cluster | This Study | FW87aaDistances revised assuming the same Pleiades distance, , as in this paper. | TSR03aaDistances revised assuming the same Pleiades distance, , as in this paper. | HST03 | G05bbDistances to individual Cepheids from the surface brightness technique. |
|---|---|---|---|---|---|
| NGC 129 | |||||
| NGC 5662 | |||||
| Lyngå 6 | |||||
| NGC 6067 | |||||
| NGC 6087 | |||||
| M25 | |||||
| NGC 7790 |

The most up-to-date compilation of Cepheid parameters in open clusters and associations can be found in Tammann et al. (2003). Their distances are from the earlier compilation by Feast (1999). These ZAMS-fitting distances are the same as in Feast & Walker (1987), but include more recent distance estimates for NGC 129 (Turner et al., 1992) and NGC 7790 (Romeo et al., 1989). All of our Cepheids are listed in these tables, and the comparisons with distances in Feast & Walker and Tammann et al. are shown in the upper two panels of Figure 11 and listed in Table 10. Both of these studies estimated distances relative to the Pleiades but assumed different Pleiades distance of and mag, respectively. We revised their distances assuming our Pleiades distance, . Since they did not explicitly present errors, we plotted our errors only. The average differences in distance are and with Feast & Walker and Tammann et al., respectively. The sense of the differences is that our new distance estimates are shorter on average. The standard deviations of the differences are mag for both comparisons, while the expected size from our error estimates is mag. If our error estimates are correct, the dispersion indicates a random error of mag in distance estimates from Feast & Walker and Tammann et al..
In addition to these studies, Hoyle et al. (2003) derived ZAMS-fitting distances to 11 open clusters with new photometry in . Our comparison with this study is shown in Figure 11 and tabulated in Table 10. The error bars represent quadrature sums of our and their reported error estimates. Their distances are marginally consistent with our estimates, and the average difference is , our distances being shorter on average. However, we did not attempt to revise their distances assuming our Pleiades distance scale. They used a ZAMS from Allen (1973) for the optical data, but they also claimed that the same results were obtained from the ZAMS in Turner (1979) and Mermilliod (1981). Since the Pleiades distance modulus of 5.56 mag was adopted in Turner, the distance moduli in Hoyle et al. would then become longer by mag on average than ours when they are on the same Pleiades distance scale as in this paper.
The bottom panel in Figure 11 shows the comparison with distances from the surface brightness technique by Gieren et al. (2005). Their distances are also larger on average than our estimates by mag as in the previous MS-fitting studies. However, they recalibrated the projection factor, which was used to convert observed velocities to pulsational velocities, using MS-fitting distances to cluster Cepheids. Therefore, their estimates are not completely independent from the above MS-fitting studies.
| Cluster | This StudyaaErrors from differential reddening are not included. | FW87 | F95 | TSR03 | HST03 |
|---|---|---|---|---|---|
| NGC 129 | |||||
| NGC 5662 | |||||
| Lyngå 6 | |||||
| NGC 6067 | |||||
| NGC 6087 | |||||
| M25 | |||||
| NGC 7790bbAverage value for CEa Cas, CEb Cas, and CF Cas. |

Our short distances are mainly due to our lower values than those in the previous work. This is because the MS-fitting distances are correlated with reddening by (Paper III). The top panel in Figure 12 compares the Cepheid reddening with those in Feast & Walker (1987), and individual estimates are listed in Table 11. They estimated the OB star reddening at the location of the Cepheids and then transformed it to the value appropriate for the Cepheid using a color-dependent reddening law (e.g., eqs. [2] and [3]). The mean difference from our study is mag, our values being smaller on average. The difference in then approximately matches the size expected to produce the difference in distance modulus ( mag).
Individual reddening estimates from Fernie et al. (1995), Tammann et al. (2003), and Hoyle et al. (2003) are also listed in Table 11, and comparisons with our estimates are shown in Figure 12. Many studies used an extensive compilation of Cepheid reddening in the David Dunlap Observatory (DDO) database of Galactic classical Cepheids,666http://www.astro.utoronto.ca/DDO/research/cepheids/ which is from heterogeneous methods (Fernie, 1990, 1994; Fernie et al., 1995). The mean difference with their data is in the sense that our reddening is smaller. Tammann et al. adopted these reddening estimates for their cluster Cepheids but made slight corrections to remove a mild correlation of the color excess with residuals from the period-color relation. This results in a reduced difference with our estimates by . However, the results from Tammann et al. are internally less consistent, in the sense that the extinction corrections on the Cepheid magnitudes and the reddening values for the MS-fitting distance estimates were not derived from the same methods. Finally, we compared our reddening values with those in Hoyle et al., which were based on the cluster color-color diagram. Their values are also systematically larger than ours by .
There are a limited number of reddening estimates from the spectral types in the literature. Kraft (1958) estimated from one B-type star in NGC 129, while Arp et al. (1959) found from seven stars in the vicinity of its Cepheid (DL Cas). In M25, Sandage (1960) estimated from the spectral types given by Feast (1957) and by Wallerstein (1957), but found a slightly larger reddening, , in the vicinity of its Cepheid (U Sgr). Finally, Kraft (1958) estimated from six stars in NGC 7790. These estimates are generally found between the previous estimates and our new values. Because of low Galactic latitudes of the clusters (), the dust map of Schlegel et al. (1998) could not provide meaningful upper limits on the color excess.
We contend that our reddening estimates are more reliable than the previous values, which mostly relied on the solar metallicity ZAMS-fitting on color-color diagrams. In contrast to these studies, we took into account metallicity and age effects on MS fitting, and our estimates are based on simultaneous fits over a wider range of spectral bands, including near-infrared . We also note that photometric zero-point errors in -band (e.g., Bessell, 2005) could introduce significant uncertainties in color excesses derived from color-color diagrams.
5. Galactic Period-Luminosity Relations
With cluster parameters derived in the previous section, we are now in a position to estimate absolute magnitudes of Cepheids and to redetermine the Galactic P-L relations. We show that our new P-L relation in is generally fainter than in previous studies. However, it is in good agreement with recent parallax studies (Benedict et al., 2007; van Leeuwen et al., 2007) when the Wesenheit magnitudes are employed.
5.1. Absolute Magnitudes of Cepheids
| Cepheids | aaWesenheit index from Freedman et al. (2001): . | |||||||
|---|---|---|---|---|---|---|---|---|
| DL Cas | ||||||||
| V Cen | ||||||||
| TW Nor | ||||||||
| V340 Nor | ||||||||
| S Nor | ||||||||
| U Sgr | ||||||||
| CEa Cas | ||||||||
| CEb Cas | ||||||||
| CF Cas |
The absolute magnitude was computed for each Cepheid from
| (10) |
where is the observed intensity-mean magnitude and is the extinction-corrected distance modulus. We used the same color-dependent prescriptions for and as those for MS dwarfs (eqs. [2] and [3]). The absolute magnitudes in other filter passbands were computed from the CCM89 reddening law at each cluster’s . Table 12 lists absolute magnitudes in for all Cepheids in this study. In the last column we also show the reddening-insensitive Wesenheit magnitude, , which was adopted in the HST Key Project.777We simply adopted from Freedman et al. (2001) to directly compare our results with those of other studies, which also employed the same relation. We would derive for the Cepheids with at , computed from the average of our cluster sample. This difference in has a negligible effect on of Cepheids. It is noted that Macri et al. (2001b) tested the CCM89 reddening law using photometry for 70 extragalactic Cepheids in 13 galaxies. They showed that a mean color-excess ratio of is in good agreement with the CCM89 predicted value.
| Source of Error | Quantity | NGC 129 | NGC 5662 | Lyngå 6 | NGC 6067 | NGC 6087 | M25 | NGC 7790 |
|---|---|---|---|---|---|---|---|---|
| DL Cas | V Cen | TW Nor | V340 Nor | S Nor | U Sgr | CEa, CEb, CF Cas | ||
| aaIndividual errors taken from Table 1. | ||||||||
| (Myr) | ||||||||
| Helium () | ||||||||
| Fitting | ||||||||
| bbPhotometric zero-point error in the intensity mean magnitude of a Cepheid. | ||||||||
| ccDifferential reddening over a cluster field. | ||||||||
| Total |
Note. — , , , , , and represent zero-point errors in the cluster photometry.
Table 13 shows systematic errors in of the Cepheids. As in Table 8, we estimated the size of errors by performing MS fits for alternate values of systematic error quantities. These are shown in the first and second columns, which are the same as those in Table 8 except the last two rows: and . The represents a systematic error in the Cepheid photometry, which was treated as independent of the cluster photometry and any of the MS-fitting process. Note that , , and in equation (10) are correlated with each other via MS fitting.
The in Table 13 represents the error in the reddening for individual Cepheids. In equation (10) we adopted the Cepheid reddening as the mean cluster reddening value. However, reddening for individual stars becomes more uncertain as we deal with more differentially reddened clusters. For these clusters, the colors for individual stars scatter along a reddening vector, and this can be detected by a large size of the MS width above photometric precision.
| Cluster | aaSize of differential reddening inferred from artificial cluster tests, assuming a normal distribution of . | bbThis value should be subtracted from the estimated . Errors are semi-interquartile ranges. |
|---|---|---|
| NGC 129 | ||
| NGC 5662 | ccNot corrected from the artificial cluster tests. | |
| Lyngå 6 | ||
| NGC 6067 | ||
| NGC 6087 | ||
| M25 | ||
| NGC 7790 | ccNot corrected from the artificial cluster tests. |
To estimate the size of differential reddening for each cluster, we first computed the standard deviation of colors in the upper MS from Table 7. Since the photometric filtering likely reduces the size of the dispersion, we corrected for it from artificial cluster CMD tests (Paper III). We generated solar metallicity, 80 Myr isochrones with photometric errors of mag in colors and magnitudes. We used the Salpeter (1955) mass function for the primaries and a flat mass function for the secondaries for a 40% binary fraction.888The binary fraction is defined as the number of binaries divided by the total number of systems in the considered fitting range. Single stars and binaries were then randomly displaced from the MS assuming a normal distribution of individual reddening with a standard deviation . After applying the photometric filtering, we then estimated the size of the reduction in dispersion as a function of . In this way, we inferred for each cluster from the observed dispersion in , which are shown in the second column of Table 14. We made no corrections to those for NGC 5662 and NGC 7790 because the dispersions in were equal to or smaller than our assumed photometric precision ().
In addition to previously known clusters with differential reddening (NGC 129, NGC 5662, and M25), we also found that the remaining clusters except NGC 7790 have larger dispersions than photometric errors. While this could be due to remaining binaries, background stars, rapid rotators, or an underestimation of the photometric errors, we took the excess dispersion in Table 14 as a characteristic measure of differential reddening as a conservative error estimate. The in Table 14 was then multiplied by to estimate the error in , which is shown in Table 13. For all clusters except NGC 7790, differential reddening is the largest error source in .
In previous studies, local Cepheid reddening was often determined using photometry of neighboring stars. We experimented with this approach for M25. We estimated individual Cepheid’s reddening on and assumed that the dispersion around the best-fitting isochrone is solely due to differential reddening. However, we could not place a strong constraint on the local color excess for U Sgr because there were not a sufficient number of stars with good . In addition, cluster binaries cannot be easily distinguished from highly reddened single stars on CMDs, which could lead to an overestimation of reddening.
5.2. The Galactic P-L Relations
Our Cepheid sample does not span a wide range of periods, which leads to a large error in P-L slopes. Instead, we adopted the P-L slopes derived from LMC Cepheids, assuming that the P-L relations for Cepheids in the Galaxy and in the LMC have the same slopes. Some investigators have claimed that the Galactic P-L relations are steeper than those of the LMC Cepheids, and that the LMC P-L relations have a break at days, possibly due to different metal contents of Cepheids (Kanbur & Ngeow, 2004; Sandage et al., 2004; Ngeow et al., 2005). However, Macri et al. (2006) recently showed that P-L relations from the LMC Cepheids in the OGLE-II catalog (Udalski et al., 1999a) are a good fit to Cepheids in the two fields of NGC 4258, which have approximately the LMC and the Galactic metal abundances (see § 6.1).
We derived LMC P-L slopes using fundamental mode Cepheids in the OGLE-II catalog (Udalski et al., 1999a) and those in Persson et al. (2004). The OGLE-II Cepheids have an average period of with about half of them being in the same period range as our Galactic Cepheid sample. The P-L relations in the LMC from the OGLE-II database were originally derived by Udalski et al. (1999b) and then revised according to the new photometric calibration (Udalski, 2000). We rederived the period-apparent magnitude relations in using the revised data from the OGLE-II Internet archive999http://www.astrouw.edu.pl/~ogle/ogle2/cep_lmc.html after iterative rejection from 680 Cepheids with (Udalski et al., 1999b). We also derived similar relations in on the LCO system from the photometry in Persson et al. (2004). As in their analysis, we excluded four stars (HV 883, HV 2447, and HV 2883 have periods longer than 100 days, and HV 12765 is about 0.2 mag brighter than the mean P-L relation), leaving 88 Cepheids with .
We then derived the Galactic P-L relations in after correcting for interstellar extinction:
The slope errors are those estimated from the LMC Cepheids. The zero-point errors were estimated from the magnitude dispersion among the Cepheids, assuming that the magnitude errors are uncorrelated with each other. We took the average magnitudes and periods of the three Cepheids in NGC 7790 as one data point. Cepheids in the two northern clusters (NGC 129 and NGC 7790) have no photometry in Laney & Stobie (1992), so the P-L relations in were derived from five clusters.

Figures 13 and 14 display P-L relations for our Galactic Cepheids (bull’s-eyes) in all filter passbands. In -band the of the fit is for 6 degrees of freedom, which indicates our reasonable error estimation. The standard deviation of the Galactic Cepheids around the P-L relation is mag, which is comparable to that of the LMC counterparts (Udalski et al., 1999b). This value is smaller than previous estimates for the Galactic Cepheids from MS fitting: Tammann et al. (2003) found 0.26 mag for 25 Cepheids (see also Sandage et al., 2004), and Fouqué et al. (2003) estimated 0.27 mag from 24 Cepheids.
In Figure 13 the OGLE-II Cepheids are also shown at a distance modulus of 18.50 mag, which was adopted in the HST Key Project (small boxes). Magnitudes of these Cepheids were corrected for extinction based on the OGLE-II reddening map, which was derived from the -band magnitudes of red clump stars (Udalski et al., 1999a). As seen in the figure, the LMC P-L relation (dashed line) is brighter than our Galactic P-L relation (solid line) by mag. This is due to metallicity and reddening effects, as well as the LMC distance as discussed in § 6.2.
5.3. Comparison with Previous Studies
| Cluster | This Study | FW87aaMagnitudes revised assuming the same Pleiades distance, , as in this paper. | TSR03aaMagnitudes revised assuming the same Pleiades distance, , as in this paper. | HST03 | G05 |
|---|---|---|---|---|---|
| DL Cas | |||||
| V Cen | |||||
| TW Nor | |||||
| V340 Nor | |||||
| S Nor | |||||
| U Sgr | |||||
| CEa,CEb,CF CasbbAverage value for CEa Cas, CEb Cas, and CF Cas. |

Figure 15 compares our with those of Feast & Walker (1987), Tammann et al. (2003), Hoyle et al. (2003), and Gieren et al. (2005). Error bars represent our error estimates only. We revised absolute magnitudes in Feast & Walker and Tammann et al. assuming our Pleiades distance ( mag in distance modulus). Individual estimates are shown in Table 15. We restricted our comparison to since absolute magnitudes in other passbands are correlated with each other. The weighted average differences are , , , and from Feast & Walker, Tammann et al., Hoyle et al., and Gieren et al., respectively, in the sense that our estimates are fainter on average. This is mainly due to the fact that our distance and reddening estimates are smaller on average than those in the previous studies (§ 4.2).


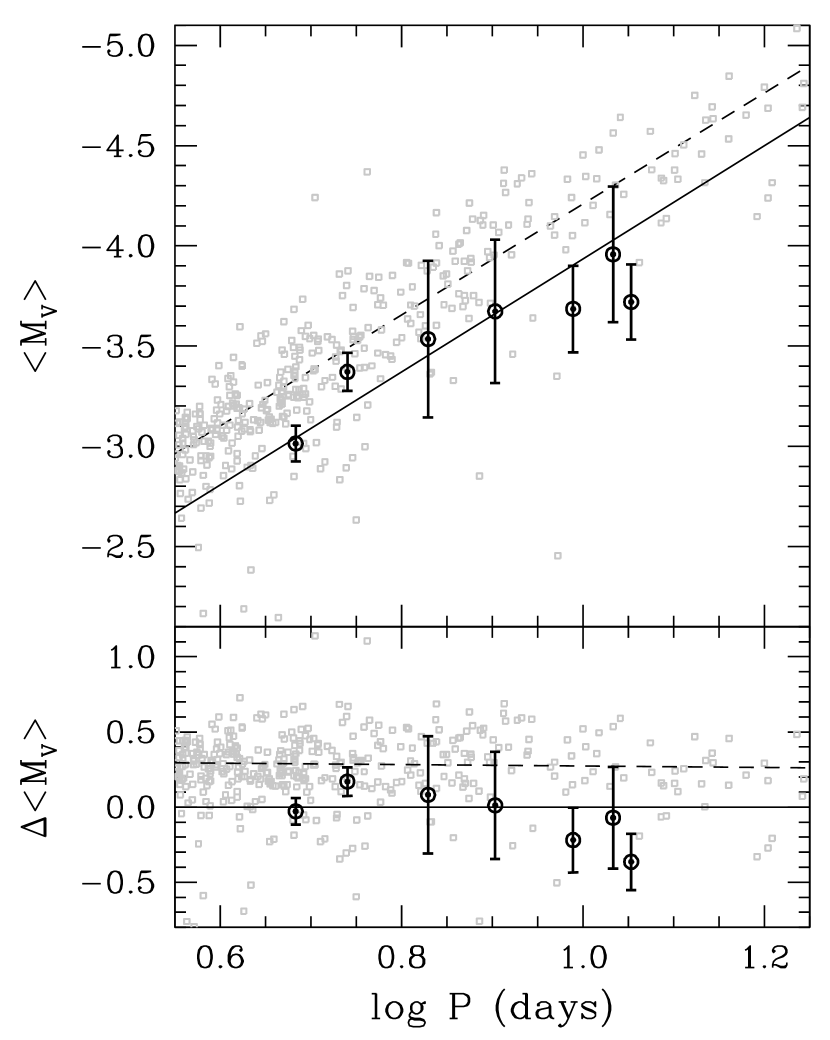
In addition, we also made a comparison with all cluster Cepheids in Tammann et al. (2003) as shown in the left panel of Figure 16. As found in the above Cepheid-to-Cepheid comparison, the difference with their is statistically insignificant for Cepheids with . However, their P-L relation is steeper than ours because their long-period Cepheids at are brighter than expected from our P-L relation. If we assume their P-L slope for our sample, we would derive for 10-day period Cepheids, which is mag fainter than their P-L zero point.
In the right panel of Figure 16, we compare our Galactic P-L relation in with that of the recent HST parallax study (Benedict et al., 2007), which provided accurate parallaxes (average ) for nine Galactic Cepheids using the HST Fine Guidance Sensor (see also Benedict et al., 2002b). Their Cepheid parallaxes were estimated with respect to photometric parallaxes of reference stars, which set the absolute distance scale of each reference frame. The magnitudes were then corrected for interstellar extinction from either color-color relations or the DDO Galactic Cepheid database. We have no Cepheids in common with their study since their distance measurements were focused on nearby field Cepheids. If we assume their P-L slope, our 10-day period Cepheids would be mag fainter than their zero point. If the difference is solely due to the error in our reddening estimates, our estimates would have been underestimated by . However, it is noted that reddening can be determined far more accurately for cluster Cepheids than it can for field stars. Our error bars in Figure 16 are slightly larger than those of the HST study because of our conservative error estimates for the extinction correction.

On the other hand, the HST-based P-L relation is in better agreement with ours when the Wesenheit magnitude is used as shown in Figure 17. The weighted mean difference of our Galactic Cepheids from their best-fitting P-L relation (solid line) is in the sense that our P-L relation is fainter. Since the Wesenheit magnitude was designed to minimize the effect of errors in the reddening, the agreement may indicate that the large difference in is due to the difference in the distance estimation.
Previous studies based on Hipparcos data typically yielded for 10-day period Cepheids (Feast & Catchpole, 1997; Feast et al., 1998; Lanoix et al., 1999; Groenewegen & Oudmaijer, 2000), while Luri et al. (1998) obtained from statistical parallaxes. Recently, van Leeuwen et al. (2007) reexamined the Galactic P-L relations based on the new reduction of the Hipparcos astrometric data (van Leeuwen & Fantino, 2005), where improvements of up to a factor of 2 in parallax accuracy have been achieved by reconstructing the satellite’s attitude (van Leeuwen, 2005). They analyzed their data together with the HST parallaxes to derive a P-L relation in . If we adopt their P-L slope in , our P-L relation would be fainter than their best-fitting P-L relation.
5.4. Systematic Errors in P-L relations
| Source of Error | |
|---|---|
| Isochrone Calibration | |
| Metallicity Scale ( dex) | |
| Age Scale [] | |
| Reddening Laws | |
| Differential Reddening + Binary | |
| Total Systematic | |
| Statistical | |
| Combined (Systematic + Statistical) |
When determining the P-L relations in the previous section, we assumed that the errors in of individual Cepheids (Table 13) are uncorrelated with each other. However, there are a number of error sources that could systematically change . These are shown in Table 16 with their estimated size of error contributions to the P-L zero point, which is described below in detail. In short, the calibration error is from the uncertainty in the adopted distance of the Pleiades (Paper III). Errors in the metallicity scale of dex and the age scale of were adopted. The error from the reddening laws represents the case of using different color-dependent prescriptions for and from Feast & Walker (1987) and Laney & Stobie (1993). We performed artificial cluster CMD tests to estimate a probable size of a bias in the MS-fitting technique from differential reddening and unresolved cluster binaries.
From the comparison with Yong et al. (2006) and Andrievsky et al. (2002), we inferred that our adopted metallicity scale (Fry & Carney, 1997) has a dex systematic error (§ 2.1). Metallicity changes of dex would vary the of 10-day period Cepheids from to mag.
In this paper, only the relative age scale is relevant with respect to the Pleiades. Our assumed age range in § 2.1 reflects the cluster-to-cluster variations with respect to the adopted age of Myr. However, it is possible that the Cepheid clusters are all systematically younger or older than the Pleiades. This would change the reddening values since the mean color of the upper MS varies with the cluster age. In fact, some of the CMDs have stars that extend far above the top end of the Myr isochrone. If these bright stars are cluster members, they would suggest younger ages than Myr. Nevertheless, the P-L zero point is relatively insensitive to the age. If the overall age scale is uncertain at the level of individual cluster ages (– Myr), we would have and mag for 10-day period Cepheids at and Myr, respectively.
We estimated the error from the reddening laws using different prescriptions for the color-dependent and in Feast & Walker (1987) and Laney & Stobie (1993). For the same and values derived from the cluster MS fitting, we found that these prescriptions result in a fainter P-L relation by than our default case (eqs. [2] and [3]).
The average that we inferred from the clusters in this study is (Table 9), which is in good agreement with the average Galactic value for the diffuse interstellar medium, . The formal standard deviation of is , but individual errors are too large to detect a cluster-to-cluster variation. Even if we adopt a different , it would have a reduced impact on . This is because a larger makes an MS-fitting distance shorter (Paper III), but it makes the extinction correction larger at the same time (eq. [10]).
In § 5.1 we considered the case where the presence of differential reddening makes it difficult to estimate individual extinctions for Cepheids. This is independent of the MS-fitting technique in the sense that it does not affect any of the cluster parameters. However, differential reddening could also modify cluster parameters because of cluster binaries. Unresolved binaries are typically brighter and redder than a single-star MS, which would make a distance apparently shorter. If there exists differential reddening across the cluster field, the distribution of these binaries on CMDs would be modified, and the MS-fitting parameters would subsequently change.

To estimate the effect of differential reddening, we performed artificial cluster CMD tests as described earlier in § 5.1. We assumed that has a normal distribution with a standard deviation . For each set of artificial cluster CMDs we applied the photometric filtering and estimated , , , and as for the actual cluster data, assuming for Cepheids. Each panel in Figure 18 shows the bias in each of these quantities as a function of . The thick solid line shows the median of the bias from 200 artificial cluster CMDs, and each set of CMDs contained 60 single stars and 40 unresolved binaries in our MS-fitting range for the distance determination. Thin lines on either side are the first and third quartiles of these estimates. The dashed line indicates a zero bias.
Even in the presence of a small differential reddening, low mass-ratio binaries cannot be easily detected from the photometric filtering. Because these unresolved binaries are redder than a single-star MS at a given , the reddening would be overestimated as shown in Figure 18 for . A higher then results in a longer distance, and a Cepheid would look brighter by several hundredths of a magnitude in . As differential reddening becomes stronger, binaries would be more scattered around the MS, and it would become further difficult to distinguish them from highly reddened single stars. As a result, both cluster reddening and distance estimates decrease at , while semi-interquartile ranges continuously increase. We also experimented with 30% and 50% binary fractions but found insignificant changes within the semi-interquartile ranges.
The last column in Table 14 shows the size of the bias in for each Cepheid, which was determined at in the second column. Applying these corrections to in Table 12 leads to mag reduction in for 10-day period Cepheids, again making worse the agreement with the brighter calibration in the previous studies. The total of the fit becomes smaller ( for 6 degrees of freedom) if we add in quadrature the semi-interquartile range to the error in .
In summary, our Galactic P-L relation in -band has a statistical error of 0.07 mag and a systematic error of 0.14 mag in the zero point (Table 16). If we add these quantities in quadrature, the combined error would be 0.16 mag. Since we determined the Galactic P-L relations in other filter passbands with the same cluster distance, reddening, and estimates as in , their zero-point errors are correlated with each other. Therefore, we took mag as a systematic error in the Cepheid distance scale in the following section.
6. Extragalactic Distance Scales
Cepheids have long served as our most commonly used standard candles for extragalactic distance studies. The conventional way of estimating extragalactic Cepheid distances is to use a fiducial P-L relation derived from the LMC Cepheids with an adopted distance to the LMC. However, geometric distances to a few galaxies have become available in recent years, providing an opportunity to compare with the Cepheid distance scale. In this section we therefore apply our Galactic P-L relations to estimate a distance to NGC 4258 (M106) that has an accurate geometric distance measurement from its water maser sources (Herrnstein et al., 1999). We then infer a distance to the LMC and compare our result with those adopted by the HST Key Project and the SN Ia calibration program (Sandage et al., 2006), from which we consider a possible increase in their Hubble constant measurements. We finish with a discussion of the potentially interesting case of M33 (NGC 598). Our most fundamental conclusion is that the distance to NGC 4258 is in good agreement with the geometric measurement when using the P-L relations inferred from open clusters. We also compare our LMC distance with those from the HST (Benedict et al., 2007) and the Hipparcos parallax studies (van Leeuwen et al., 2007).
6.1. The Maser-host Galaxy NGC 4258
Herrnstein et al. (1999) inferred a geometric distance to NGC 4258 from the orbital motions of water maser sources on its nucleus and found (see also Argon et al., 2007). Many Cepheids were also observed in this galaxy, providing an opportunity to check the Cepheid distance scale (Maoz et al., 1999; Newman et al., 2001). Recently, Macri et al. (2006) discovered 281 Cepheids and provided accurate photometry using the Advanced Camera for Surveys/Wide Field Camera (ACS/WFC) onboard the HST. In particular, they observed two fields in the galaxy, located at two different galactocentric distances with significantly different gas-phase metal abundances, and derived the metallicity sensitivity of the Cepheid luminosity.
We reexamined the Macri et al. data set in light of our revised P-L relationship. Following their selection procedure, we used the “restricted” sample of 69 Cepheids and estimated distance moduli for the two groups of Cepheids in the inner (with a period cut of days) and outer fields ( days). For each group of this sample we corrected for extinction using our P-L relations in . The absolute distance to NGC 4258 was then estimated by anchoring our Galactic sample to a reference gas-phase metal abundance within the galaxy.
| Filter | |||
|---|---|---|---|
| Inner Field | Outer Field | mag dex-1 | |
| Average | |||
Note. — Distances are shown at the best-fit reddening from the Galactic P-L relations (see text). Errors represent fitting uncertainties, and do not include the error from the correlation with reddening.

Figure 19 shows how we determined the average distance and reddening. In the left two panels apparent distance moduli in are shown for Cepheids in the inner and outer fields (top and bottom, respectively). Distances from shorter wavelength filters are systematically longer, and the data are well fitted by a CCM89 extinction curve (solid line). Here we assumed for the Cepheids, which was computed from the average of our cluster sample with equation (2) at . At this value, the CCM89 extinction law yields absorption ratios of 1.30 and 0.61 for and , respectively, where we took effective wavelengths of these filters from BCP98. We added 0.02 mag in quadrature to the fitting error to take into account the photometric zero-point error. At the limit of , an intercept on the ordinate is the true or unreddened distance modulus (e.g., Madore & Freedman, 1991, 1998). The right two panels in Figure 19 show likelihood contours in the average reddening and distance modulus from these fits. Contours are shown at = 2.30, 6.17, and 11.8 (68.3%, 95.4%, and 99.73% confidence levels) for 2 degrees of freedom. Horizontal lines represent the distance estimate from the water maser sources and its combined error (Herrnstein et al., 1999). Distance moduli at the best-fit reddening are listed in Table 17 for each of the two galactic fields.
When the reddening is constrained in this way, distances in both fields are in good agreement with the maser distance. However, the distance from the inner field is shorter than the distance from the outer field by . The most natural interpretation of this difference is that it measures the metallicity dependence of the Cepheid luminosity. This effect has been extensively discussed in the literature and tested empirically (Freedman & Madore, 1990; Gould, 1994; Sasselov et al., 1997; Kochanek, 1997; Kennicutt et al., 1998; Udalski, 2000; Kennicutt et al., 2003; Groenewegen et al., 2004; Sakai et al., 2004; Storm et al., 2004; Romaniello et al., 2005; Macri et al., 2006).
To estimate the true distance modulus of the galaxy, we first estimated metal abundances in the two NGC 4258 fields and then inferred a distance at the metallicity of the Galactic Cepheids. Stellar abundances cannot be measured directly for most of the Cepheid galaxies. Instead, the HST Key Project adopted “empirical” gas-phase [O/H] abundances from Zaritsky et al. (1994). Macri et al. computed oxygen abundances at each Cepheid’s location from the H II region abundance gradient in Zaritsky et al.. The average abundances from this table are and dex for the inner and outer field Cepheids, respectively, when the LMC Cepheids have on this scale (Sakai et al., 2004). To relate these abundances to those of our Galactic Cepheid sample, we adopted a stellar abundance difference between the LMC Cepheids and Galactic supergiants from Luck et al. (1998) of . They also found a similar -element enhancement between the LMC and the Galactic samples. In the following discussion we adopted , assuming that the stellar abundance difference is the same as the difference in the gas-phase oxygen abundance.
Since the metallicity of the Galactic Cepheids is found between the metal abundances for the inner and outer fields, the true distance would lie between distance estimates from the two galactic fields. From a linear interpolation, we obtained (P-L zero point) for a distance to NGC 4258, which is in good agreement with the current maser distance. The first error is from the fit to the HST ACS data ( mag), an error in ( mag for change in ), and an error in the metallicity scale ( mag for dex). We adopted an error in the metallicity scale of dex to account for a possible difference in the stellar and gas-phase abundances, but it has only a moderate effect on the distance determination.
Previous studies found somewhat longer Cepheid distances to NGC 4258 although these values are consistent within the errors with the maser solution. As a part of the HST Key Project, Maoz et al. (1999) estimated using the Wide-Field Planetary Camera 2 (WFPC2), and Newman et al. (2001) revised it to be , where the first errors represent those unique to each determination and the second errors are systematic uncertainties in the HST Key Project distances.
However, the reddening in the HST Key Project is significantly larger than our estimates. The final result in the HST Key Project lists or for Cepheids located in the middle of galactocentric distances to the two ACS fields. On the other hand, we found and for the inner- and outer-field Cepheids, respectively, where the errors are the contour sizes in Figure 19. Macri et al. also estimated individual Cepheid reddenings using the OGLE-II LMC P-L relations, and their average values are also larger than ours, being and mag for the inner and outer fields, respectively.
In Table 17 we also listed the metallicity sensitivity () in each band, which was computed from the distances and the average abundance difference in the two galactic fields. The magnitude of this effect is smaller than the original estimate in Macri et al., mag dex-1. Since our estimate neglects the change in color with metallicity, we employed the metallicity corrections from Kochanek (1997) in the next two sections. Kochanek derived corrections in based on a simultaneous analysis of Cepheids in 17 galaxies with a proper treatment of correlations between extinction, temperature, and metallicity. The corrections are , , , , , and mag dex-1 in , respectively, in the sense that metal-rich Cepheids have a decreased flux in but increased fluxes in , possibly due to line-blanketing and back-warming among other effects. These estimates are based on for LMC Cepheids, but their dependence on the LMC reddening is small. If we adopt these corrections for NGC 4258, we would derive for the inner-field and mag for the outer-field Cepheids, where the errors represent the statistical uncertainty.
6.2. LMC
Our Galactic P-L relations can also be applied to estimate the distance to the LMC and its mean reddening. We included photometry of the LMC Cepheids from Persson et al. (2004), as well as photometry from the OGLE-II catalog in the multi-wavelength fitting technique. This approach assumes that Cepheids in these two surveys were drawn from the same population.101010The OGLE-II Cepheids were observed along the LMC bar, while the Cepheids observed in (Persson et al., 2004) are more dispersed over the LMC.

Figure 20 shows likelihood contours in the solution for the average LMC reddening and its distance modulus (middle panel) from the fits on the apparent distance moduli in (left panel). We applied metallicity corrections for and assumed that the metallicity sensitivities on the Glass-Carter system in Kochanek (1997) are the same as in the LCO system. As in the NGC 4258 case, we assumed for the Cepheids, which yields absorption ratios of 0.29, 0.18, and 0.12 for , respectively, from the CCM89 extinction law. In this calculation we took the effective filter wavelengths from Persson et al. (2004) for on the LCO system. We added mag in (Udalski et al., 1999a) and mag in (Persson et al., 2004) in quadrature to the fitting errors to account for photometric zero-point errors.
| Filter | ||
|---|---|---|
| OGLE-II aaDistances derived assuming the OGLE-II reddening map. | Best-fit bbDistances shown at the best-fit reddening from the Galactic P-L relations (see text). Errors represent fitting uncertainties, and do not include the error from the correlation with reddening. | |
| Average | ||
Note. — After applying metallicity corrections from Kochanek (1997).
As shown in Figure 20, our best-fit solution yields (P-L zero point). Extinction-corrected distance moduli at the best-fit reddening are listed in Table 18. The first error in distance is a quadrature sum of a fitting error ( mag) and an error from ( mag for in ). We also added in quadrature an error from the metallicity ( mag for dex). As in the NGC 4258 case the zero-point error of the Galactic P-L relations dominates the combined error in the LMC distance modulus. Without metallicity corrections, we would derive .
We also derived , where the error is from the contour in Figure 20. Our average reddening is 0.03 mag smaller than the average reddening from the OGLE-II, , which was adopted in the HST Key Project.111111The HST Key Project adopted the OGLE-II LMC P-L relations and scaled them to . However, the P-L relations were not scaled to as they claimed (see also Fouqué et al., 2003). However, our reddening estimate is closer to the value of (Walker, 1999) from several different reddening estimates for LMC stars (see Table II in McNamara & Feltz, 1980). It is also in agreement with the reddening value determined for the LMC Cepheids, (Caldwell & Coulson, 1985; Laney & Caldwell, 2007). The zero point of the OGLE-II reddening map was set by two LMC clusters (NGC 1850 and NGC 1835) and one eclipsing binary (HV 2274), but the reddening for HV 2274 has different values from various studies: OGLE-II adopted (Udalski et al., 1998), which is larger than (Guinan et al., 1998), (Nelson et al., 2000), and (Groenewegen & Salaris, 2001). Furthermore, as shown in Table 18, extinction corrections from the OGLE-II reddening map result in systematically shorter distances at shorter wavelengths, which may indicate an overcorrection for extinction (see also Fouqué et al., 2003).
Our distance modulus is mag smaller (or in distance) than the adopted distance modulus by the HST Key Project ( mag). Formally, this implies an increase in their by . Our LMC distance is also shorter by mag (or in distance) than the distance modulus adopted by the Sandage et al. (2006) program ( mag). In addition to our study, recent parallax studies from the HST (Benedict et al., 2007) and the revised Hipparcos catalog (van Leeuwen et al., 2007) used the Wesenheit index to derive and mag, respectively, also suggesting a downward revision of the LMC distance. Finally, Macri et al. (2006) estimated a distance modulus of NGC 4258 relative to the LMC of . Given the maser distance, this was then translated into the LMC distance modulus of , which is within of our estimate.
We note that stronger constraints on distance can be achieved when several photometric bands are used including near-infrared data. As illustrated in Figure 20, the statistical error in distance becomes larger by a factor of 3 when only information is used (right panel) rather than from (middle panel). The error would be even larger when the distance and reddening values are estimated from only two bands, such as the Wesenheit index.
6.3. M33
As our final case, we estimated the average distance and reddening for M33 Cepheids using the same method as in the previous section. The distance to this nearby spiral galaxy has recently been measured from a detached eclipsing binary, (Bonanos et al., 2006), and from two water maser sources in H II regions, (Brunthaler et al., 2005).

Figure 21 shows likelihood contours in the solution for the average reddening and distance modulus. As in the HST Key Project, we used photometry in Freedman et al. (1991) for their 10 best observed Cepheids, which was obtained at the 3.6 m Canada-France-Hawaii Telescope (CFHT), the Kitt Peak National Observatory (KPNO) 4 m telescope, and the Palomar 1.5 m telescope. We assumed mag for the photometric zero-point error in each band. On the Zaritsky et al. (1994) scale, M33 Cepheids have , which was adopted in the HST Key Project. We therefore applied metallicity corrections from Kochanek (1997) for .
At the best-fit reddening, we obtained an extinction-corrected distance modulus of , , and in , respectively, where the uncertainties are fitting errors only. The average distance is (P-L zero point). The first error was determined by adding in quadrature the fitting error (0.28 mag), the error from ( mag for ), and the error from the metallicity ( mag for dex). We adopted the error in the metallicity from the HST Key Project. If we adopt metal abundances derived from electron temperatures (Sakai et al., 2004), the abundance difference between the LMC and M33 becomes , which leads to . We would derive without metallicity corrections.
The HST Key Project used the same ground-based photometry for this galaxy and derived a metallicity-corrected distance modulus of based only on as for the other HST sample galaxies. While this distance is in good agreement with our estimate, our average reddening of is lower than their estimate, or .121212We note that Freedman et al. (1991) originally derived and using photometry, assuming the LMC distance modulus of 18.5 mag and its mean reddening of 0.10 mag. A part of the difference is due to different zero points of P-L relations. However, our reddening is in good agreement with the value of the eclipsing binary, , which was obtained from photometry (Bonanos et al., 2006) and with previous estimates based on several different methods (see Table 7 of Bonanos et al.).
A similar result was obtained from a larger Cepheid sample in Macri et al. (2001a). They provided photometry for 251 Cepheids obtained at the Fred Lawrence Whipple Observatory (FLWO) 1.2 m telescope and the MDM 1.3 m telescope (see also Mochejska et al., 2001a, b). From the restricted sample of 90 Cepheids in similar to those of the Freedman et al. sample, we derived and , where the uncertainties are fitting errors only.
Distances from these two independent sets of photometry are about mag shorter than the distance from the eclipsing binary, although our distance has a large error. One potential explanation for the short Cepheid-based distance is the unresolved blends by a strong star-to-star correlation function. Mochejska et al. (2001c) investigated the influence of blending by comparing HST WFPC2 and Macri et al. ground-based images for a sample of 102 Cepheids (see also Mochejska et al., 2000). They found that the average flux contribution from unresolved luminous companions on the ground-based images could be on average in for , which would systematically underestimate the Cepheid distance by . In addition, Lee et al. (2002) obtained single-epoch -band photometry for a subset of the Macri et al. sample using HST WFPC2 and found that the HST photometry is on average mag fainter than Macri et al. photometry.
Follow-up observations with a higher spatial resolution (e.g., Macri, 2004) would be helpful for a definitive test of the distance to M33, although there are indications that our estimated reddening is more accurate than the value in the HST Key Project. Note that the effect of stellar blending is less significant in our distance estimates for NGC 4258 and the LMC. The ground-based photometry with the full width at half-maximum (FWHM) of would correspond to pc at the distance of the LMC, compared to pc at the distance of M33. The ACS/WFC FWHM of 0.09″(Ford et al., 2003) corresponds to pc at the distance of NGC 4258.
7. SUMMARY AND DISCUSSION
We have continued our effort to improve the accuracy of isochrones and distances derived from MS fitting. We extended the previous Hyades-based calibration to the upper MS by constructing empirical color- corrections to match the observed Pleiades MS at the cluster’s accurately known distance. We applied these empirically calibrated sets of isochrones to Cepheid-bearing Galactic open clusters to derive distances, reddenings, and at the spectroscopic metal abundances and obtained Galactic P-L relations based on nine Cepheids in seven clusters. Our distance modulus of individual Cepheids has an accuracy of mag (or in distance), which is compatible to those of recent parallaxes from the HST (Benedict et al., 2007) and the revised Hipparcos catalog (van Leeuwen et al., 2007).
Using these P-L relations, we derived a distance to NGC 4258 and found that our Cepheid distance is in excellent agreement with the maser distance, supporting our distance scale from the MS-fitting technique. From photometry we derived the LMC distance modulus of (P-L zero point) after applying metallicity corrections. This is also in close agreement with distance estimates from the recent HST and Hipparcos parallax studies. However, our revised LMC distance is lower than the distance adopted by the HST Key Project, which formally implies an increase in their by . A similar size of an increase in is expected from the SN Ia calibration program by Sandage et al. (2006).
Our reddening estimates are systematically lower than those in the HST Key Project. Part of the reason is the P-L relations with different assumptions about the reddening. They adopted the color excess for LMC Cepheids from the OGLE-II reddening map, but its average value is larger than our LMC reddening estimate. Nonetheless, relative distances between the LMC and target galaxies in the HST Key Project would remain less affected because the reddening-free or Wesenheit index adopted in the HST Key Project is designed to avoid the problem of knowing the absolute zero point of the reddening scale. In other words, the absolute reddening value would not be important as long as the difference in reddening between target Cepheids and the calibrating system is well-defined. Therefore, the Wesenheit index can be effectively used to build the cosmic distance scale once highly accurate distances to calibrating Cepheids are available.
However, our estimates for NGC 4258 and M33 are larger by than those in the HST Key Project, more than expected from the difference in the LMC reddening. This is due to two reasons. First, the Cepheid’s color is not only affected by reddening, but it can be also affected by the metal content. The HST Key Project corrected a distance modulus for a metallicity effect after deriving a color excess. On the other hand, we applied metallicity corrections to apparent distance moduli from Kochanek (1997), and then derived a reddening value. Because the sign and size of the metallicity corrections could not be the same in different broadband filters, the difference in the Cepheid metallicity could lead to different reddening estimates from those in the HST Key Project. Second, the Wesenheit magnitude is based on only two broadband filters. However, reddening and distance estimates are naturally correlated in the standard procedure to estimate these parameters using P-L relations, so a small zero-point error in the photometry, for example, can be translated into a large error in reddening. Therefore, obtaining Cepheid photometry at least in three or more passbands including near-infrared filters is of great importance in the distance and reddening estimation (e.g., Gieren et al., 2006; Soszyński et al., 2006).
In the determination of individual Cepheids’ absolute magnitudes, the extinction is one of the largest sources of error because of strong differential reddening in Cepheid-bearing young open clusters. Although we found an error of mag in the mean for a cluster, most Cepheid-bearing clusters have patchy reddening that makes the individual Cepheid reddening uncertain by up to . An average reddening of cluster members located near a Cepheid was often used to determine the Cepheid’s reddening, but differential reddening over a small scale could not be resolved unless we have a sufficient number of nearby stars with well-determined reddening. However, it is noted that the most secure reddening estimates for Cepheids are considered to be given by the cluster Cepheids. In addition, our LMC reddening is in close agreement with the previous standard value, (Walker, 1999), and our average reddening for M33 Cepheids is in good agreement with the value inferred from photometry of an eclipsing binary (Bonanos et al., 2006).
In terms of the zero point of the Galactic P-L relations, the uncertainty in the metallicity scale of the Galactic open clusters is the largest error source, with a change of dex producing a mag shift in distance modulus. No other source is unusually large. In Paper III we have shown that several color indices can be effectively used in MS fitting to determine a cluster metallicity because of differential sensitivities of these colors on metal abundance. Although the noise in the current photometry prevented the estimation of the photometric metal abundance, deep multi-color photometry combined with near-infrared data will be useful to determine , , , and [M/H], simultaneously. A more accurate metallicity scale could then be used to reduce the size of the systematic error in the P-L zero point. In addition, the zero-point error can be further reduced by deeper photometry of other Cepheid-bearing clusters, which were not included in this paper because of poor photometric quality. These are C1814-191, Collinder 394, Mon OB2, NGC 1647, NGC 6649, NGC 6664, Platais 1, Trumpler 35, Vel OB5, and Vul OB1.
References
- Allen (1973) Allen, C. W. 1973, Astrophysical Quantities (London: Athlone)
- Alonso et al. (1995) Alonso, A., Arribas, S., & Martínez-Roger, C. 1995, A&A, 297, 197
- Alonso et al. (1996) Alonso, A., Arribas, S., & Martínez-Roger, C. 1996, A&AS, 117, 227
- An et al. (2007) An, D., Terndrup, D. M., Pinsonneault, M. H., Paulson, D. B., Hanson, R. B., & Stauffer, J. R. 2007, ApJ, 655, 233 (Paper III)
- Andrievsky et al. (2002) Andrievsky, S. M., et al. 2002, A&A, 381, 32
- Argon et al. (2007) Argon, A. L., Greenhill, L. J., Reid, M. J., Moran, J. M., & Humphreys, E. M. L. 2007, ApJ, 659, 1040
- Arp (1960) Arp, H. 1960, ApJ, 131, 322
- Arp et al. (1959) Arp, H., Sandage, A., & Stephens, C. 1959, ApJ, 130, 80
- Bahcall & Pinsonneault (2004) Bahcall, J. N., & Pinsonenault, M. H. 2004, Phys. Rev. Lett., 92, 121301
- Bahcall et al. (2001) Bahcall, J. N., Pinsonneault, M. H., & Basu, S. 2001, ApJ, 555, 990
- Basu et al. (2000) Basu, S., Pinsonneault, M. H., & Bahcall, J. N. 2000, ApJ, 529, 1084
- Baumgardt et al. (2000) Baumgardt, H., Dettbarn, C., & Wielen, R. 2000, A&AS, 146, 251
- Benedict et al. (2002a) Benedict, G. F., et al. 2002a, AJ, 123, 473
- Benedict et al. (2002b) Benedict, G. F., et al. 2002b, AJ, 124, 1695
- Benedict et al. (2007) Benedict, G. F., et al. 2007, AJ, 133, 1810
- Berdnikov et al. (2000) Berdnikov, L. N., Dambis, A. K., & Vozyakova, O. V. 2000, A&AS, 143, 211
- Bessell (2005) Bessell, M. S. 2005, ARA&A, 43, 293
- Bessell et al. (1998) Bessell, M. S., Castelli, F., & Plez, B. 1998, A&A, 333, 231 (BCP98)
- Böhm-Vitense et al. (1998) Böhm-Vitense, E., Evans, N. R., Carpenter, K., Albrow, M. D., Cottrell, P. L., Robinson, R., & Beck-Winchatz, B. 1998, ApJ, 505, 903
- Bonanos et al. (2006) Bonanos, A. Z., et al. 2006, ApJ, 652, 313
- Breger (1966) Breger, M. 1966, PASP, 78, 293
- Breger (1986) Breger, M. 1986, ApJ, 309, 311
- de Bruijne et al. (2001) de Bruijne, J. H. J., Hoogerwerf, R., & de Zeeuw, P. T. 2001, A&A, 367, 111
- Brunthaler et al. (2005) Brunthaler, A., Reid, M. J., Falcke, H., Greenhill, L. J., & Henkel, C. 2005, Science, 307, 1440
- Caldwell & Coulson (1985) Caldwell, J. A. R., & Coulson, I. M. 1985, MNRAS, 212, 879
- Cardelli et al. (1989) Cardelli, J. A., Clayton, G. C., & Mathis, J. S. 1989, ApJ, 345, 245 (CCM89)
- Carpenter (2001) Carpenter, J. M. 2001, AJ, 121, 2851
- Carter (1990) Carter, B. S. 1990, MNRAS, 242, 1
- Clariá et al. (1991) Clariá, J. J., Lapasset, E., & Bosio, M. A. 1991, MNRAS, 249, 193
- Cohen et al. (2003) Cohen, M., Wheaton, W. A., & Megeath, S. T. 2003, AJ, 126, 1090
- Collins & Sonneborn (1977) Collins, G. W., II, & Sonneborn, G. H. 1977, ApJS, 34, 41
- Dean et al. (1978) Dean, J. F., Warren, P. R., & Cousins, A. W. J. 1978, MNRAS, 183, 569
- Evans et al. (1997) Evans, N. R., Böhm-Vitense, E., Carpenter, K., Beck-Winchatz, B., & Robinson, R. 1997, PASP, 109, 789
- Evans et al. (1998) Evans, N. R., Böhm-Vitense, E., Carpenter, K., Beck-Winchatz, B., & Robinson, R. 1998, ApJ, 494, 768
- Evans & Bolton (1990) Evans, N. R., & Bolton, C. T. 1990, ApJ, 356, 630
- Evans et al. (2006) Evans, N. R., Massa, D., Fullerton, A., Sonneborn, G., & Iping, R. 2006, ApJ, 647, 1387
- Feast (1957) Feast, M. W. 1957, MNRAS, 117, 193
- Feast (1999) Feast, M. 1999, PASP, 111, 775
- Feast (2003) Feast, M. 2003, in Stellar Candles for the Extragalactic Distance Scale, ed. D. Alloin & W. Gieren (Berlin: Springer), 45
- Feast & Catchpole (1997) Feast, M. W., & Catchpole, R. M. 1997, MNRAS, 286, L1
- Feast et al. (1998) Feast, M., Pont, F., & Whitelock, P. 1998, MNRAS, 298, L43
- Feast & Walker (1987) Feast, M. W., & Walker, A. R. 1987, ARA&A, 25, 345
- Fernie (1961) Fernie, J. D. 1961, ApJ, 133, 64
- Fernie (1990) Fernie, J. D. 1990, ApJS, 72, 153
- Fernie (1994) Fernie, J. D. 1994, ApJ, 429, 844
- Fernie et al. (1995) Fernie, J. D., Beattie, B., Evans, N. R., & Seager, S. 1995, IBVS No. 4148
- Ford et al. (2003) Ford, H. C., et al. 2003, Proc. SPIE, 4854, 81
- Fouqué et al. (2003) Fouqué, P., Storm, J., & Gieren, W. 2003, in Stellar Candles for the Extragalactic Distance Scale, ed. D. Alloin & W. Gieren (Berlin: Springer), 21
- Freedman & Madore (1990) Freedman, W. L., & Madore, B. F. 1990, ApJ, 365, 186
- Freedman et al. (1991) Freedman, W. L., Wilson, C. D., & Madore, B. F. 1991, ApJ, 372, 455
- Freedman et al. (2001) Freedman, W. L., et al. 2001, ApJ, 553, 47
- Fry & Carney (1997) Fry, A. M., & Carney, B. W. 1997, AJ, 113, 1073
- Gieren et al. (1997) Gieren, W. P., Fouqué, P., & Gómez, M. 1997, ApJ, 488, 74
- Gieren et al. (1998) Gieren, W. P., Fouqué, P., & Gómez, M. 1998, ApJ, 496, 17
- Gieren et al. (2006) Gieren, W., Pietrzyński, G., Nalewajko, K., Soszyński, I., Bresolin, F., Kudritzki, R.-P., Minniti, D., & Romanowsky, A. 2006, ApJ, 647, 1056
- Gieren et al. (2005) Gieren, W., Storm, J., Barnes, T. G., III, Fouqué, P., Pietrzyński, G., & Kienzle, F. 2005, ApJ, 627, 224
- Groenewegen & Oudmaijer (2000) Groenewegen, M. A. T., & Oudmaijer, R. D. 2000, A&A, 356, 849
- Groenewegen & Salaris (2001) Groenewegen, M. A. T., & Salaris, M. 2001, A&A, 366, 752
- Groenewegen et al. (2004) Groenewegen, M. A. T., Romaniello, M., Primas, F., & Mottini, M. 2004, A&A, 420, 655
- Gould (1994) Gould, A. 1994, ApJ, 426, 542
- Guinan et al. (1998) Guinan, E. F., et al. 1998, ApJ, 509, L21
- Gupta et al. (2000) Gupta, A. C., Subramaniam, A., Sagar, R., & Griffiths, W. K. 2000, A&AS, 145, 365
- Haug (1978) Haug, U. 1978, A&AS, 34, 417
- Herrnstein et al. (1999) Herrnstein, J. R., et al. 1999, Nature, 400, 539
- Hertzsprung (1947) Hertzsprung, E. 1947, Annalen van de Sterrewacht te Leiden, 19, 1
- Hoag et al. (1961) Hoag, A. A., Johnson, H. L., Iriarte, B., Mitchell, R. I., Hallam, K. L., & Sharpless, S. 1961, Publications of the U.S. Naval Observatory Second Series, 17, 345
- Hoyle et al. (2003) Hoyle, F., Shanks, T., & Tanvir, N. R. 2003, MNRAS, 345, 269
- Johnson (1960) Johnson, H. L. 1960, ApJ, 131, 620
- Kanbur & Ngeow (2004) Kanbur, S. M., & Ngeow, C.-C. 2004, MNRAS, 350, 962
- Kennicutt et al. (2003) Kennicutt, R. C., Jr., Bresolin, F., & Garnett, D. R. 2003, ApJ, 591, 801
- Kennicutt et al. (1998) Kennicutt, R. C., Jr., et al. 1998, ApJ, 498, 181
- Kervella et al. (2004a) Kervella, P., Bersier, D., Mourard, D., Nardetto, N., & Coudé du Foresto, V. 2004a, A&A, 423, 327
- Kervella et al. (2004b) Kervella, P., Nardetto, N., Bersier, D., Mourard, D., & Coudé du Foresto, V. 2004b, A&A, 416, 941
- Kim et al. (2002) Kim, Y.-C., Demarque, P., Yi, S. K., & Alexander, D. R. 2002, ApJS, 143, 499
- Kochanek (1997) Kochanek, C. S. 1997, ApJ, 491, 13
- Kraft (1958) Kraft, R. P. 1958, ApJ, 128, 161
- Kraft (1965) Kraft, R. P. 1965, ApJ, 142, 681
- Landolt (1983) Landolt, A. U. 1983, AJ, 88, 439
- Landolt (1992) Landolt, A. U. 1992, AJ, 104, 340
- Lane et al. (2000) Lane, B. F., Kuchner, M. J., Boden, A. F., Creech-Eakman, M., & Kulkarni, S. R. 2000, Nature, 407, 485
- Lane et al. (2002) Lane, B. F., Creech-Eakman, M. J., & Nordgren, T. E. 2002, ApJ, 573, 330
- Laney & Stobie (1992) Laney, C. D., & Stobie, R. S. 1992, A&AS, 93, 93
- Laney & Stobie (1993) Laney, C. D., & Stobie, R. S. 1993, MNRAS, 263, 921
- Laney & Caldwell (2007) Laney, C. D., & Caldwell, J. A. R. 2007, MNRAS, 377, 147
- Lanoix et al. (1999) Lanoix, P., Paturel, G., & Garnier, R. 1999, MNRAS, 308, 969
- Lee et al. (2002) Lee, M. G., Kim, M., Sarajedini, A., Geisler, D., & Gieren, W. 2002, ApJ, 565, 959
- Lee & Lee (1999) Lee, J.-D., & Lee, S.-G. 1999, Journal of Korean Astronomical Society, 32, 91
- Lejeune et al. (1997) Lejeune, Th., Cuisinier, F., & Buser, R. 1997, A&AS, 125, 229 (LCB)
- Lejeune et al. (1998) Lejeune, Th., Cuisinier, F., & Buser, R. 1998, A&AS, 130, 65 (LCB)
- Luck et al. (1998) Luck, R. E., Moffett, T. J., Barnes, T. G., III, & Gieren, W. P. 1998, AJ, 115, 605
- Luri et al. (1998) Luri, X., Gómez, A. E., Torra, J., Figueras, F., & Mennessier, M. O. 1998, A&A, 335, L81
- Lyngå (1987) Lyngå, G. 1987, Catalogue of Open Cluster Data, 5th ed. (Lund: Lund Observatory)
- Macri (2004) Macri, L. M. 2004, IAU Colloq. 193: Variable Stars in the Local Group, 310, 33
- Macri et al. (2006) Macri, L. M., Stanek, K. Z., Bersier, D., Greenhill, L. J., & Reid, M. J. 2006, ApJ, 652, 1133
- Macri et al. (2001a) Macri, L. M., Stanek, K. Z., Sasselov, D. D., Krockenberger, M., & Kaluzny, J. 2001a, AJ, 121, 870
- Macri et al. (2001b) Macri, L. M., et al. 2001b, ApJ, 549, 721
- Madore (1975) Madore, B. F. 1975, A&A, 38, 471
- Madore & Freedman (1991) Madore, B. F., & Freedman, W. L. 1991, PASP, 103, 933
- Madore & Freedman (1998) Madore, B. F., & Freedman, W. L. 1998, ApJ, 492, 110
- Maoz et al. (1999) Maoz, E., Newman, J. A., Ferrarese, L., Stetson, P. B., Zepf, S. E., Davis, M., Freedman, W. L., & Madore, B. F. 1999, Nature, 401, 351
- Mathis (1990) Mathis, J. S. 1990, ARA&A, 28, 37
- McNamara & Feltz (1980) McNamara, D. H., & Feltz, K. A., Jr. 1980, PASP, 92, 587
- Mermilliod (1981) Mermilliod, J. C. 1981, A&A, 97, 235
- Mermilliod et al. (1987) Mermilliod, J. C., Mayor, M., & Burki, G. 1987, A&AS, 70, 389
- Mermilliod & Paunzen (2003) Mermilliod, J.-C., & Paunzen, E. 2003, A&A, 410, 511
- Meynet et al. (1993) Meynet, G., Mermilliod, J.-C., & Maeder, A. 1993, A&AS, 98, 477
- Mochejska et al. (2001a) Mochejska, B. J., Kaluzny, J., Stanek, K. Z., Sasselov, D. D., & Szentgyorgyi, A. H. 2001a, AJ, 121, 2032
- Mochejska et al. (2001b) Mochejska, B. J., Kaluzny, J., Stanek, K. Z., Sasselov, D. D., & Szentgyorgyi, A. H. 2001b, AJ, 122, 2477
- Mochejska et al. (2000) Mochejska, B. J., Macri, L. M., Sasselov, D. D., & Stanek, K. Z. 2000, AJ, 120, 810
- Mochejska et al. (2001c) Mochejska, B. J., Macri, L. M., Sasselov, D. D., & Stanek, K. Z. 2001c, preprint (astro-ph/0103440)
- Moffat & Vogt (1973) Moffat, A. F. J., & Vogt, N. 1973, A&AS, 10, 135
- Moffat & Vogt (1975) Moffat, A. F. J., & Vogt, N. 1975, A&AS, 20, 155
- Nelson et al. (2000) Nelson, C. A., Cook, K. H., Popowski, P., & Alves, D. R. 2000, AJ, 119, 1205
- Newman et al. (2001) Newman, J. A., Ferrarese, L., Stetson, P. B., Maoz, E., Zepf, S. E., Davis, M., Freedman, W. L., & Madore, B. F. 2001, ApJ, 553, 562
- Ngeow et al. (2005) Ngeow, C.-C., Kanbur, S. M., Nikolaev, S., Buonaccorsi, J., Cook, K. H., & Welch, D. L. 2005, MNRAS, 363, 831
- Orsatti et al. (2001) Orsatti, A. M., Vega, E. I., & Marraco, H. G. 2001, A&A, 380, 130
- Paulson et al. (2003) Paulson, D. B., Sneden, C., & Cochran, W. D. 2003, AJ, 125, 3185
- Perryman et al. (1998) Perryman, M. A. C., et al. 1998, A&A, 331, 81
- Persson et al. (2004) Persson, S. E., Madore, B. F., Krzemiński, W., Freedman, W. L., Roth, M., & Murphy, D. C. 2004, AJ, 128, 2239
- Phelps & Janes (1994) Phelps, R. L., & Janes, K. A. 1994, ApJS, 90, 31
- Piatti et al. (1998) Piatti, A. E., Clariá, J. J., & Bica, E. 1998, ApJS, 116, 263
- Pinsonneault et al. (2003) Pinsonneault, M. H., Terndrup, D. M., Hanson, R. B., & Stauffer, J. R. 2003, ApJ, 598, 588 (Paper I)
- Pinsonneault et al. (2004) Pinsonneault, M. H., Terndrup, D. M., Hanson, R. B., & Stauffer, J. R. 2004, ApJ, 600, 946 (Paper II)
- Preston (1964) Preston, G. W. 1964, PASP, 76, 165
- Ribas et al. (2005) Ribas, I., Jordi, C., Vilardell, F., Fitzpatrick, E. L., Hilditch, R. W., & Guinan, E. F. 2005, ApJ, 635, L37
- Rieke & Lebofsky (1985) Rieke, G. H., & Lebofsky, M. J. 1985, ApJ, 288, 618
- Romaniello et al. (2005) Romaniello, M., Primas, F., Mottini, M., Groenewegen, M., Bono, G., & François, P. 2005, A&A, 429, L37
- Romeo et al. (1989) Romeo, G., Bonifazi, A., Fusi Pecci, F., & Tosi, M. 1989, MNRAS, 240, 459
- Sagar & Cannon (1997) Sagar, R., & Cannon, R. D. 1997, A&AS, 122, 9
- Sakai et al. (2004) Sakai, S., Ferrarese, L., Kennicutt, R. C., Jr., & Saha, A. 2004, ApJ, 608, 42
- Salpeter (1955) Salpeter, E. E. 1955, ApJ, 121, 161
- Sandage (1958) Sandage, A. 1958, ApJ, 128, 150
- Sandage (1960) Sandage, A. 1960, ApJ, 131, 610
- Sandage & Tammann (2006) Sandage, A., & Tammann, G. A. 2006, ARA&A, 44, 93
- Sandage et al. (2004) Sandage, A., Tammann, G. A., & Reindl, B. 2004, A&A, 424, 43
- Sandage et al. (2006) Sandage, A., Tammann, G. A., Saha, A., Reindl, B., Macchetto, F. D., & Panagia, N. 2006, ApJ, 653, 843
- Sasselov et al. (1997) Sasselov, D. D., et al. 1997, A&A, 324, 471
- Schlegel et al. (1998) Schlegel, D. J., Finkbeiner, D. P., & Davis, M. 1998, ApJ, 500, 525
- Schultz & Wiemer (1975) Schultz, G. V., & Wiemer, W. 1975, A&A, 43, 133
- Sills et al. (2000) Sills, A., Pinsonneault, M. H., & Terndrup, D. M. 2000, ApJ, 534, 335
- Skrutskie et al. (2006) Skrutskie, M. F., et al. 2006, AJ, 131, 1163
- Sneden et al. (1978) Sneden, C., Gehrz, R. D., Hackwell, J. A., York, D. G., & Snow, T. P. 1978, ApJ, 223, 168
- Soszyński et al. (2006) Soszyński, I., Gieren, W., Pietrzyński, G., Bresolin, F., Kudritzki, R.-P., & Storm, J. 2006, ApJ, 648, 375
- Stetson (2000) Stetson, P. B. 2000, PASP, 112, 925
- Storm et al. (2004) Storm, J., Carney, B. W., Gieren, W. P., Fouqué, P., Latham, D. W., & Fry, A. M. 2004, A&A, 415, 531
- Tammann et al. (2003) Tammann, G. A., Sandage, A., & Reindl, B. 2003, A&A, 404, 423
- Thackeray et al. (1962) Thackeray, A. D., Wesselink, A. J., & Harding, G. A. 1962, MNRAS, 124, 445
- Torres & Ribas (2002) Torres, G., & Ribas, I. 2002, ApJ, 567, 1140
- Trumpler (1921) Trumpler, R. J. 1921, Lick Observatory Bulletin, 10, 110
- Turner (1979) Turner, D. G. 1979, PASP, 91, 642
- Turner (1986) Turner, D. G. 1986, AJ, 92, 111
- Turner et al. (1992) Turner, D. G., Forbes, D., & Pedreros, M. 1992, AJ, 104, 1132
- Turner et al. (1998) Turner, D. G., Pedreros, M. H., & Walker, A. R. 1998, AJ, 115, 1958
- Udalski (2000) Udalski, A. 2000, Acta Astronomica, 50, 279
- Udalski et al. (1998) Udalski, A., Pietrzyński, G., Woźniak, P., Szymański, M., Kubiak, M., & Żebruń, K. 1998, ApJ, 509, L25
- Udalski et al. (1999a) Udalski, A., Soszyński, I., Szymański, M., Kubiak, M., Pietrzyński, G., Woźniak, P., & Żebruń, K. 1999a, Acta Astronomica, 49, 223
- Udalski et al. (1999b) Udalski, A., Szymański, M., Kubiak, M., Pietrzyński, G., Soszyński, I., Woźniak, P., & Żebruń, K. 1999b, Acta Astronomica, 49, 201
- van den Bergh (1957) van den Bergh, S. 1957, ApJ, 126, 323
- van den Bergh & Harris (1976) van den Bergh, S., & Harris, G. L. H. 1976, ApJ, 208, 765
- van Leeuwen (2005) van Leeuwen, F. 2005, A&A, 439, 805
- van Leeuwen & Fantino (2005) van Leeuwen, F., & Fantino, E. 2005, A&A, 439, 791
- van Leeuwen et al. (2007) van Leeuwen, F., Feast, M. W., Whitelock, P. A., & Laney, C. D. 2007, MNRAS, 379, 723
- Walker (1985) Walker, A. R. 1985, MNRAS, 213, 889
- Walker (1987) Walker, A. R. 1987, South African Astronomical Observatory Circular, 11, 131
- Walker (1999) Walker, A. R. 1999, in Post-Hipparcos Cosmic Candles, ed. A. Heck & F. Caputo (Dordrecht: Kluwer), 125
- Walker & Coulson (1985) Walker, A. R, & Coulson, I. M. 1985, South African Astronomical Observatory Circular, 9, 97
- Wallerstein (1957) Wallerstein, G. 1957, PASP, 69, 172
- Wampler et al. (1961) Wampler, J., Pesch, P., Hiltner, W. A., & Kraft, R. P. 1961, ApJ, 133, 895
- Yong et al. (2006) Yong, D., Carney, B. W., Teixera de Almeida, M. L., & Pohl, B. L. 2006, AJ, 131, 2256
- Zaritsky et al. (1994) Zaritsky, D., Kennicutt, R. C., Jr., & Huchra, J. P. 1994, ApJ, 420, 87