1–10
The dwarf low surface brightness population in different environments of the Local Universe
Abstract
The nature of the dwarf galaxy population as a function of location in the cluster and within different environments is investigated. We have previously described the results of a search for low surface brightness objects in data drawn from an East-West strip of the Virgo cluster ([Sabatini et al. (2003)]) and have compared this to a large area strip outside of the cluster ([Roberts et al. (2004)]). In this talk I compare the East-West data (sampling sub-cluster A and outward) to new data along a North-South cluster strip that samples a different region (part of sub-cluster A, and the N,M clouds) and with data obtained for the Ursa Major cluster and fields around the spiral galaxy M101. The sample of dwarf galaxies in different environments is obtained from uniform datasets that reach central surface brightness values of 26 B mag/arcsec2 and an apparent B magnitude of 21 (MB=-10 for a Virgo Cluster distance of 16 Mpc). We discuss and interpret our results on the properties and distribution of dwarf low surface brightness galaxies in the context of variuos physical processes that are thought to act on galaxies as they form and evolve.
keywords:
dwarf galaxies, low suface brightness galaxies, clusters1 Introduction
Although dwarf galaxies are the most abundant galaxies of the Local Universe, their number counts in the field (measured by the faint end part of the Luminosity Function, LF, [Blanton et al. (2001)], [Norberg et al. (2002)]) are well below those predicted by the Mass Function (MF) of CDM hierarchical galaxy formation models ([Kauffman et al. (1993)],[Klypin et al.(̇1999)],[Moore et al. (1999)]) - this is known as the ’missing satellites’ problem. However, recent discoveries of ultra-faint dwarfs of the Local Group made with SDSS data ([Irwin et al. (2007)] and references therein) have doubled the number of known dwarf satellites of the MW, reducing the discrepancy between observations and predictions, even if a factor of 4 is still missing in order to solve the missing satellites problem ([Simon & Geha (2007)]). These results prove that, even in the Local Universe, the census of the dwarf galaxy population is still incomplete and the slope () of the faint end part of the LF is therefore still subject to revision: selection effects due to the intrinsic faint total magnitude and low surface brightness of dwarf galaxies, have made them particularly elusive in surveys that were not purposely designed to select them. On the observational side, the issue is further clouded by non-uniform datasets: different surveys reach different magnitude and surface brightness limits and detection methods and selection criteria vary in the way they identify dwarf galaxies. This can lead to studies of the LF in which different authors report extremely different results even for the same region of sky: see for example the Fornax cluster where an extremely steep LF () is found by [Kambas et al. (2000)], while a flat one () is reported by Mieske et al (this conf). In this talk we report on our ongoing work to try and quantify the numbers of Low Surface Brightness (LSB) dwarf galaxies as a function of the environment in the Local Universe (within 20 Mpc) and to assess and compare their properties. We reduced as much as possible the observational biases with the uniformity of our data and by using exactly the same detection algorithm and selection criteria for identifying dwarf galaxies in all the different environments that we analysed. To reach this goal we put very strong requirements on the way we carried out our work:
-
•
the dataset and the data analysis need to be homogeneuos. As already mentioned, data in the literature are highly inhomogeneous: often the detection methods, candidate selection and the resulting completeness of the compared samples are different. In order to avoid these problems, our data are obtained in exaclty the same way for the different environments (same observing instrumentation and setup, same data analysis, detection and selection method);
-
•
data need to go deep both in magnitude and surface brightness. Flux limited surveys sample only our neighborhoods for the dwarfs contribution and easily miss further away denser environments like the Virgo Cluster; surface brightness limited surveys miss the contribution by LSB galaxies (e.g. the SDSS catalogue misses 50% of galaxies from mag/arcsec2, [Blanton et al. (2005)]). our method allows the detection of galaxies with intrinsic properties of 2326 B mag/arcsec2 and -10-14, where and are the B band exponential central surface brightness and absolute magnitude respectively ;
-
•
data need to cover different environments: inhabiting the shallowest potential wells and thus being the most sensitive to internal and external physical processes that control galaxy formation, dwarfs are the best test-beds to investigate how the environment affects galaxy evolution and to estimate the contribution of different physiscal processes (photo-ionization, tidal interactions, SN winds, ram pressure stripping, harassment). We obtained data from different environments of the Local Unieverse (the field, M101, the Ursa Major Cluster, the Virgo Cluster). Given the magnitude limits of our survey (see previous point), the galaxies that we analyse are fainter than those typically detected in the comprehensive survey of the Virgo cluster carried out by [Binggeli et al. (1984)] and extends down towards the properties of the ’classical’ dSph galaxies of the Local Group (excluding the recently discovered ultra-faint dwarfs).
2 Data and data analysis
The optical data were obtained using the Wide Field Camera (WFC) on the Isaac Newton Telescope, La Palma, Canary Islands as part of the Wide Field Survey (WFS), a multicolour data survey covering over 200 deg2 of sky. The WFC is a mosaic of four thinned EEV 4K 2K CCDs with a pixel size of 0.33 arc sec and total sky coverage of 0.29 deg2. Images on CCD 3 were not used due to its vignetting, this reduced our total field of view to 0.21 deg2. The Virgo data, taken during observing runs in 1999 and 2002, consists of two perpendicular strips extending from the centre of the Virgo cluster (defined as M87) outwards by 7 deg and covering a total area of about 28 .
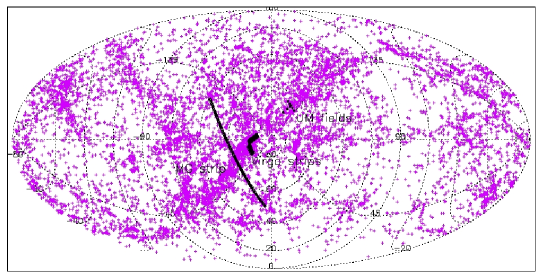
These 2 data strips sample different regions of the Virgo cluster, with one lying roughly perpendicular to the super-galactic plane (E-W) and covering sub-cluster A and outward, and the other (N-S) almost parallel to it, sampling clouds N,M. The Ursa Major data was obtained in 2002: they consist of 8 fields going along a N-S, E-W cross in the cluster and totalling 1.68 . The M101 data was obtained in 2004 and consist of 72 frames covering an area of just over 15 , in a box around M101. The field region is taken from the Millennium Galaxy Strip (MGS) and consists of an area of 30 along the celestial equator ([Liske et al. (2003)]), passing through filaments and voids and crossing the Virgo Southern extension at its mid point. The different environments of this survey are shown in black in Fig 1. All B band exposures were for 750s, whilst the exposure time for the i band images was 1000s. All data reduction was carried out by the Cambridge Astronomical Survey Unit pipeline (http://www.ast.cam.ac.uk/ wfcsur/index.php). This included de-biasing, bad pixel replacement, non-linearity correction, flat-fielding, de-fringing, gain correction and photometric calibration.
2.1 Data analysis
The detection of LSB dwarf galaxies is subject to strong selection effects, due to their intrinsic low surface brightness that is, by definition, below the sky level (i.e. they consist of low signal-to-noise objects on a digital image). For this reason, standard algorithm based on a connected pixels above a threshold concept (e.g. SExtractor, [Bertin& Arnouts (1996)]) are not ideal for their detection. The galaxy detection in this work was therefore performed using a purposely built, fully automated, detection algorithm based on the convolution of the original images in the Fourier Space with a set of multi-scale filters of exponential profile. The method and its potentialities are discussed in Scaramella et al (this conf). The detection algorithm produces a list of candidate LSB galaxies that need to be selected against the background galaxies. In order to estimate the best selection criteria (i.e. the one that optimize cluster members detection and minimize background contamination of the sample), we ran numerical simulations of a cone of Universe uniformly populated by galaxies and of a cluster at the position of the Virgo Cluster. The details of this detection algorithm and the selection criteria have been extensively discussed in Sabatini et al. (2003) and Roberts et al. (2004). The result of this process is that we selected galaxies that, at the distance of the Virgo cluster (16 Mpc, [Jerjen et al. (2004)]), satisfy the following criteria: a central surface brightness of B mag/arcsec2, and an exponential scale size () in the range: arcsec. 111This actually corresponds to galaxies with intrinsic scale sizes of 3 arcsec as it can be shown that convolution of the typical seeing function of our data with a 3 arcsec scale length resulted in a measured scale length of about 4 arcsec ([Sabatini et al. (2003)]). Our final sample consist of 596 dwarf LSB galaxies (roughly 2/3 out of which were previously uncatalogued) found over an area of 70 deg2 in environments of increasing density.
3 Results
3.1 Number density and Dwarf-to-Giant Ratio
In the EW strip of the Virgo Cluster, we found on average about 18
galaxies per deg2 but ranging from about 40 per deg2 at the
cluster centre to approximateley 4 per deg2 at the cluster edge
([Sabatini et al. (2003)]). This decline in numbers with cluster radius
is a good indicator that we have selected a predominately cluster
population rather than background galaxies. In a related paper
([Roberts et al. (2004)]) we compared the Virgo cluster result with field
data from the MGS. Over this region the average number of galaxies
detected were only 4 per deg2, consistent with the numbers we
detected at the edge of the Virgo cluster, again indicating that
our cluster data consists predominately of cluster galaxies.
Comparing the numbers of dwarf galaxies to that of the giant
galaxy population over the same region of sky gave a
Dwarf-to-Giant Ratio (DGR) of about 14 (DGR=Num()/Num()) for the Virgo E-W strip and
22 for the N-S strip. The DGR of the MGS strip was at most 6,
consistent with the numbers of dwarf and giant galaxies found in
the Local Group (Mateo, 1998) if we imagine to move the Local
Group to the Virgo Cluster distance and apply the above discussed
selection criteria. The Virgo cluster clearly supports many more
dwarf galaxies per giant than do galaxies in less rich
environments. Values of DGR are shown in table 1
(column 3) for the environments where it was possible to calculate
them. Average number density of dwarf galaxies is also shown
(column 2) and can be compared in different environments. The MGS
survey clearly shows that there is no large field population of
LSB low luminosity galaxies that would steepen the luminosity
functions of [Blanton et al. (2001)] and [Norberg et al. (2002)] at fainter
magnitudes, to account for the discrepancy with theoretical
predictions. In the special environment of the Virgo cluster,
consistently with previous shallower surveys, we found relatively
large numbers of dwarf galaxies, that provide a little closer
match to the theory (Moore et al., 1999).
3.2 Properties of the dwarf galaxies in our sample


In [Sabatini et al. (2005)] we followed up the galaxies of our catalogue
and analysed the B-I colours and gas content (through observations
of our candidates carried out at Arecibo, with a mass limit of
at the distance of the Virgo
Cluster and a column density limit of ). Table 1 shows average values of the B-I
colours (column 4). Interestingly colours of the two different
regions analysed in Virgo are similar, but the NS strip shows a
higher dispersion: this could be due to the strip being populated
by galaxies from further away infalling clouds (implying fainter
magnitudes and therefore larger errors in the
colour)222This picture is also supported by the comparison
of the total magnitude distributions of the two
sample and the surface brightness (SB) distributions: galaxies in the NS strip have fainter total apparent magnitude and
than galaxies in the EW strip similar SB, suggesting that they are
at a higher distance ([Roberts et al. (2007)]). On average dwarfs in
Virgo are bluer than typical giant ellipticals in the cluster
((B-I), [Michard (2000)]) and wihin the errors have
similar (B-I) colour to typical globular clusters (GC) around M87
((B-I), [Conture et al. (1990)]). It’s also worth
noticing that (B-I) colours of galaxies in the 2 cluster strips
does not depend upon distance from
the cluster centre.
HI detection rate for a subsample of galaxies in our surveys of
the Virgo Cluster and the field that were followed up are shown in
table 1 (column 5): galaxies in the cluster tend to
be gas poor compared with those in the field. In aggrement with
this picture, although still under intense discussion at the low
masses (see this conf), we find that the HI Mass Function (HIMF)
in the cluster is shallower than in the field (see Fig
2). This has an opposite trend to the LF, that we
find steep in Virgo and flat in the field (Fig 2),
suggesting that the cluster plays an important role in promoting
star formation and therefore in converting atomic gas into stars.
To summarise: in the comparison of Virgo cluster dwarf galaxies to
MGS field dwarf galaxies, consistent with previous observations,
we find that the cluster population is redder and gas poor.
Concerning the morphology of galaxies in the different
environments analysed, again consistent with previous results in
the literature, we find that dE are more abundant in denser
environments and tend to be a small percentage in the field (table
1, columns 6 to 8).
| (N/deg2) | (det. rate) | ||||||
| MGS | 4 | 1.20.3 | 24 % | 33 % | 43 % | ||
| M101* | 3.6 | 40 % | 38 % | 22 % | |||
| M101 | 0.1 | 100 % | |||||
| UMa | 4 | 33 % | 17 % | 50 % | |||
| Virgo EW | 18 | 1.80.4 | 62 % | 26 % | 12 % | ||
| Virgo NS | 22 | 1.80.7 | 54 % | 22 % | 24% |
4 Discussion
In what follows we will discuss the properties of these extremely faint low surface brightness galaxies in relation to the environment in which they reside and evaluate which of the analysed physical mechanisms can be the main driver for their evolution. The main issue that we are trying to assess is wheter these galaxies are fossils of the primordial fluctuations predicted by CDM models or they have been created more recently. [Kauffman et al. (1993)] suggest that the missing DM halos must remain dark and so undetectable. If this is so, then a much larger fraction of field DM halos remain dark compared to those in clusters. The cluster environment must have played an important role in making these galaxies visible. Alternately if these dark halos do not survive to the present epoch, the cluster environment must have created the excess of dwarf galaxies compared to the field. In what follows we analyse mechanisms in favor of one or the other scenario.
4.1 Creation of dwarfs
-
•
Harassment - [Moore et al. (1999)] showed that infalling LSB disk galaxies in a cluster can be morphologically transformed into dEs by the several high speed tidal interactions with giant cluster galaxies. We tested 2 predictions of this model:
1) size of the dEs in our sample. Moore et al. (1998) give the smallest radius of an harassed galaxy to be 1.67 Kpc, even if [Sabatini et al. (2005)] calculated that if the dwarf galaxies found in the cluster originally came from a population of larger field galaxies then they should have tidal radii of the order 7kpc (). The dwarf galaxies in our sample have scale-lengths between 4 arcsec and 9 arcsec, which, at the distance of Virgo correspond to physical scale-sizes of 0.25kpc to 0.75kpc, therefore smaller than the predicted sizes.
2) tidal streams (i.e. stars torn out from the harassed galaxies will lie along narrow streams which follow the orbital path of the galaxy). [Davies et al. 2005] carried out a search for these tidal arcs around 38 dE galaxies found in our survey of the N-S strip, reaching the limit of 29 B mag/arcsec2 (which is 1.5 mag fainter than the predicted surface brightness values for the stream stripped by an infalling galaxy distributed around a radius of 1 Mpc and 2 Kpc thick, [Moore et al. (1996)]). From this search, Davies et al. found no evidence for tidal streams which could be associated with the sample of dEs.
A recent paper by [Mastropietro et al. (2005)] shows that the size of harassed dEs could be smaller and streams surface brightness fainter than what originally predicted. However, the most problematic part of the harassment idea is where the initial LSB disk galaxies come from. As galaxy groups come together to form clusters this population should reside in the groups, while large numbers of LSB disc galaxies are just not found in galaxy groups. -
•
Tidal Dwarfs - Slow speed close tidal interactions between galaxies in clusters result in gas and stars being pulled out from the interacting galaxies into giant streams, along which clumps of gas and stars form. Over time the stream fades, and the clump is classified as a Tidal Dwarf Galaxy (TDG). There is observational evidence of the extistence of this kind of galaxies (see e.g. [Hunsberger et al. (1996)]) and simulations of the formation of TDGs predict that at most 1-2 of them form with each interaction ([Okazaki & Taniguchi (2000)], [Duc et al. (2007)]). We can estimate how many TDG producing interactions there could be in Virgo by considering a simple rate equation. The number of interactions (N) which may produce a TDG in a cluster depends upon four parameters - the number density of galaxies (), their interaction cross section (), their velocity (v) and the age of the cluster (T). Thus,
(1) If we assume that only interactions between disk galaxies (S0 and spirals) produce TDGs ([Okazaki & Taniguchi (2000)]), then using the information in [Tully et al. (1996)] and assuming that the interaction cross-section is the virial radius, we estimate there to be about 13 interactions per Gyr. So, if we assume that each interaction makes, at most, 2 TDGs, this means that we would expect 26 TDGs to be formed every Gyr. It seems therefore extremely unlikely that TDGs make up a large fraction of the cluster dwarf galaxy population, and certainly not large enough to account for the dwarf galaxy population we find in Virgo today.
-
•
Ram pressure stripping - Galaxies infalling in a cluster with a hot intra-cluster medium are subject to its ram pressure that can be capable of stripping thier gas away. dIrrs could be particularly fragile with respect to this mechanism ([van Zee et al. (2004)]) and could potentially be transformed to dEs. However, the importance of ram pressure stripping on the evolution of cluster dwarf galaxies in Virgo was investigated by [Sabatini et al. (2005)] who found that, due to the expected high M/L ratio of these galaxies, only those dwarfs within the cluster core (0.5Mpc or 1.5∘) would be affected by this process. For the E-W strip, they also conclude that the dwarfs they detect within the projected cluster core would be severely tidally disrupted if they were actually located in the core, thus they must be outside the core region, and therefore will not be subject to ram pressure stripping. The majority (99%) of the galaxies detected in our N-S Virgo cluster strip are outside the projected core region due to the offset of this strip from the cluster centre. Thus the effect of ram pressure stripping on these galaxies must be small.
In [Sabatini et al. (2005)] we suggest that enhanced star formation triggered by interactions with the cluster and galaxy potentials, accelerates the evolution of infalling DM halos so that they resemble the dEs which we see in Virgo today, a process that does not happen in the field. The (B-I) colour of our detections (discussed in section 3) are consistent with a stellar population that is younger than the giant elliptical galaxies.
4.2 Suppression of dwarfs
Having discussed the possible mechanisms which could create the large population of dwarf galaxies that we find in our survey of the Virgo cluster region, we now investigate the possible reasons why we detect very few dwarf galaxies in lower density environments (the general field, the region around M101 and the low density Ursa Major cluster).
-
•
Supernovae winds - In this scenario ([Dekel & Silk (1986)]), the most commonly invoked when attempting to suppress the formation of dwarf galaxies, the first generation of SN injects enough energy into the halo gas, for it to escape the halo and thereby prevent further star formation, rendering the halo invisible. [Babul & Rees (1992)] have suggested that this mechanism for gas expulsion may be environmentally dependent because the pressure of the intra-cluster gas will reduce gas loss in clusters (pressure confinement). However, it is not clear how efficient this mechanism for gas loss will be in any environment: [MacLow & Ferrara (1999)] have investigated this idea using numerical simulations and showed that SN winds are effective at blowing out the gas only for haloes of masses 106. [Sabatini et al. (2005)] have also questioned the viability of this gas loss mechanism in the light of the very high mass-to-light ratios that have been derived for some dwarf galaxies. Note also that, using ASCA X-ray survey temperature maps, [Roberts (2005)] showed that galaxies in Virgo are pressure confined only within 3 deg of M87 in the NS strip and 2 deg in the EW. Thus gas expulsion via SN winds does not appear to be able to explain why we see small numbers of dwarf galaxies only in low density environments.
-
•
Re-ionization - Are there many DM haloes present in low density environments that are not observable because they have not been lit up by star formation? One explanation for this is the presence of a photoionizing background preventing the gas in the halo from cooling. To account for an environmental dependence of this mechanism, we should refer to the so called ‘squelching’ scenario ([Tully et al. (2002)]): in this picture high density cluster sized regions (like the Virgo Cluster) are assumed to form before the epoch of re-ionization (thus star formation in their dwarfs is not inhibited). Lower density regions (such as Ursa Major and the field) form later and thus the UV background heats the gas in the dwarfs residing in them, preventing it from cooling and forming stars. However, in their model, [Tully et al. (2002)] used of 6, while the third year of WMAP results have pushed the epoch of re-ionization to , a time when the formation of dwarf galaxy sized objects is rare.
Although the squelching scenario may have problems explaining the environmental dependence of dwarf galaxy populations, the effect of photoionization on low mass DM haloes may well play a part in the formation of galaxies in the idea known as ‘downsizing’ ([Cowie et al. (1996)]). This scenario, born out of observational evidence that larger galaxies have older stellar populations than lower mass ones is at first sight contrary to hierarchical theory of structure formation. However, it is not contrary if for some reason star formation in low mass halos is in some way delayed, possibly delayed so long that large numbers of small halos have not yet undergone any star formation at all.
If photoionization does result in there being many low mass DM haloes in the Universe which have not been able to form stars to make them visible as dwarf galaxies, then gravitational lensing could be used as a probe of substructure. This is an ideal tool to use since light is deflected gravitationally by matter, whether it is light or dark, thus if there were small dark haloes present in the Universe, they could be detected by this means. Such studies have been carried out ([Metcalf & Zhao (2002)], 2002, [Bradac et al. (2002)], [Dalal & Kochanek (2002)]) and preliminary results show evidence for the presence of substructure. [Kochanek & Dalal (2003)] also rule out the possibilities of other effects causing the flux anomalies in a further study of their data, concluding that ‘low mass haloes remain the best explanation of the phenomenon’. However, if these low mass DM haloes do exist in the numbers predicted by CDM, then as they fall through the disk of their parent galaxy, they should heat the disk and cause it to thicken ([Tóht & Ostriker (1992)]). This is contrary to some observations of old thin disk systems or galaxies with no thick disk components, although it is now being argued that the amount of heating and thickening has been overestimated ([Font et al. (2001)], [Velázquez & White (1999)]). This is clearly a matter for further investigation.
5 Conclusions
Our suggested solution to the origin of the differences in the number counts and properties of dwarf galaxies in different environments is that there must be many very LSB or totally dark galaxies in the Universe that we have not yet been discovered. In the cluster environment many of these have been ’lit up’ by enhanced star formation due to them being pulled and pushed around within the cluster environment. In support of this we cite the following results from our survey:
-
1.
The dE galaxies in Virgo are bluer than the giant ellipticals - their star formation was delayed until the cluster was formed.
-
2.
Dwarf galaxies in Virgo are redder and gas poor compared to those in the field - the cluster environment promotes the conversion of gas into stars. Note that downsizing implies low efficiency star formation in the lowest mass objects - but more rapid in clusters?
-
3.
The galaxies we detect in Virgo are too small to be the result of harassment.
-
4.
There are too few tidal interactions in Virgo for them to be created tidally.
-
5.
There is a clear lack of dwarf galaxies in the dynamically young Ursa Major cluster.
-
6.
If the dwarfs have high mass-to-light ratios they will not be subject to gas lose by SN driven winds.
Multi-band follow ups to try and constrain the stellar population,
star formation history, age, metallicity of the dwarfs of our
catalogue are necessary in order to better investigate their
nature. We are currently using SDSS imaging data at this
purpose for a subsample of them and we hope to obtain NIR data for
constraining their stellar population.
The recent discovery of extremely low luminosity and low surface brightness dSph companions to the MW ([Irwin et al. (2007)] and references therein) has highlighted the possibility that the predicted population of low mass haloes in CDM may actually exist. [Kleyna et al. (2005)] comment that this new dSph, which has a M/L of over 500M and absolute magnitude, -6.75, ‘may represent the best candidate for a “missing” CDM halo’. They conclude that there must be more dark and massive dwarfs hiding in the region around the Milky Way. It is therefore extremely important that searches for such objects are carried out if we are to properly check the consistency of observations with CDM predictions.
References
- [Babul & Rees (1992)] Babul, A. & Rees,M., 1992, MNRAS, 255, 346
- [Bertin& Arnouts (1996)] Bertin, E., Arnouts, A., 1996, A A, 117, 393
- [Binggeli et al. (1984)] Binggeli, B., Sandage, A., Tarenghi, M., 1984, AJ, 89, 64
- [Blanton et al. (2001)] Blanton, M.R., Dalcanton, J., Eisenstein, D., Loveday, J., Strauss, M., SubbaRao, M., Weinberg, D.H., Anderson, J.E. Jr. and 61 coauthors,2001, AJ,121, 2358
- [Blanton et al. (2005)] Blanton, M.R., Eisenstein, D., Hogg, D.W., Schlegel, D.J. & Brinkmann, J.,2005, ApJ, 631, 208
- [Bradac et al. (2002)] Bradac, M., Schneider, P., Steinmetz, M., Lombardi, M., King, L. & Porcas, R., 2002, AA, 388, 373
- [Conture et al. (1990)] Conture, J., Harris, W. & Allwright, J., 1990, ApJS, 73, 671
- [Cowie et al. (1996)] Cowie, L., Songaila, A., Hu, E. & Cohen, J., 1996, AJ, 112, 839
- [Dalal & Kochanek (2002)] Dalal, N. & Kochanek C., 2002, ApJ, 572, 25
- [Davies et al. 2005] Davies, J.I., Roberts, S. & Sabatini, S., 2005, MNRAS, 356, 794
- [Dekel & Silk (1986)] Dekel, A. & Silk, J., 1986, textitApJ, 303, 39
- [Duc et al. (2007)] Duc, P.A., Bournaud, F. & Boquien, M., 2007 IAUS, 237, 323
- [Font et al. (2001)] Font, A., Navarro, J., Stadel, J. & Quinn, T., 2001, ApJ, 563, L1
- [Hunsberger et al. (1996)] Hunsberger, S., Charlton, J. & Zaritsky, D., 1996, ApJ, 462, 50
- [Irwin et al. (2007)] Irwin, M.J., Belokurov, V., Evans, N.W., Ryan-Weber, E.V., de Jong, J.T.A., Koposov, S., Zucker, D.B., Hodgkin, S.T. and 19 coauthors,,2007, ApJ, 656L, 13
- [Jerjen et al. (2004)] Jerjen, H., Binggeli, B., Barazza, F., 2004, AJ, 127, 771
- [Kambas et al. (2000)] Kambas, A., Davies, J.I., Smith, R., Bianchi, S., Haynes J.A.,2000, AJ, 120, 1316
- [Kauffman et al. (1993)] Kauffman, G., White S.D.M. & Guiderdoni B., 1993, MNRAS, 264, 201
- [Kleyna et al. (2005)] Kleyna, J., Wilkinson, M.I., Evans, N.W., Gilmore, G., Frayn, C., 2005, ApJ, 630, 141
- [Klypin et al.(̇1999)] Klypin, A., Kravtsov, A.V., Valenzuela O. & Prada, F., 1999, ApJ, 522, 82
- [Kochanek & Dalal (2003)] Kochanek, C. & Dalal, N., 2003, AIP Conf. Proc. 666, ’The Emergence of Cosmic Structure’, p. 103
- [Liske et al. (2003)] Liske, J., Lemon, D., Driver, S., Cross, N. & Couch, W., 2003, MNRAS, 344, 307
- [MacLow & Ferrara (1999)] MacLow, M. & Ferrara, A., 1999, ApJ, 513, 142
- [Mastropietro et al. (2005)] Mastropietro, C., Moore, B., Mayer, L., Debattista, V.P., Piffaretti, R., Stadel, J.,, 2005, MNRAS,364, 607
- [Metcalf & Zhao (2002)] Metcalf, R. & Zhao, H., 2002, ApJ, 567, L5
- [Michard (2000)] Michard, R., 2000, AA, 360, 85
- [Moore et al. (1996)] Moore, B., Katz, N., Lake, G., Dressler, A. & Olmer, A.,1996, Nature, 379, 613
- [Moore et al. (1999)] Moore, B., Ghigna, S., Governato, F., Lake, G., Quinn, T., Stadel, J. & Tozzi, P., 1999, ApJ, 524, L19
- [Norberg et al. (2002)] Norberg, P., Cole, S., Baugh, C.M., Frenk, C.S., Baldry, I., Bland-Hawthorn, J., Bridges, T., Cannon, R., and 20 coauthors,2002, textitMNRAS, 336, 907
- [Okazaki & Taniguchi (2000)] Okazaki, T. & Taniguchi, Y., 2000, ApJ, 543, 149
- [Roberts et al. (2004)] Roberts, S., Davies, J.I., Sabatini, S., van Driel, W., O’Neil, K., Baes, M., Linder, S.M., Smith, R., Evans, R., 2004, MNRAS, 352, 478
- [Roberts (2005)] Roberts, S., 2005, PhD Thesis, Cardiff University
- [Roberts et al. (2007)] Roberts, S., Davies, J.I., Sabatini, S., Auld, R., Smith, R.,2007 MNRAS, in press
- [Sabatini et al. (2003)] Sabatini, S., Davies, J.I., Scaramella, R., Smith, R., Baes, M., Linder, S.M., Roberts S. & Testa, V., 2003, MNRAS, 341, 981
- [Sabatini et al. (2005)] Sabatini, S., Davies, J.I., Van Driel, W., Baes, M., Robert, S., Smith, R., Linder, S.,O’Neil, K., 2005, MNRAS, 357, 819
- [Simon & Geha (2007)] Simon, J.D. & Geha M., 2007, submitted to ApJ (preprint: astro-ph/0706.0516v1)
- [Tóht & Ostriker (1992)] Toth, G. & Ostriker, J., 1992, ApJ, 389, 5
- [Tully et al. (1996)] Tully, B.R., Verheijen, M.A.W., Pierce, M.J., Huang, J.S., Wainscoat, R.J.,1996, AJ, 112, 2471
- [Tully et al. (2002)] Tully, B.R., Somerville, R., Trentham, N. & Verheijen, M., 2002, ApJ, 569, 573
- [van Zee et al. (2004)] van Zee, L., Barton, E.J. & Skillman, E.D., 2004, AJ, 128, 2797
- [Velázquez & White (1999)] Velázquez, H. & White, S., 1999, MNRAS, 304, 254
- [Zwaan et al. (2005)] Zwaan, M.A., Stavely-Smith, L., Koribalski, B.S., Henning, P.A., Kilborn, V.A., Ryder,, S.D., Barnes, D.G., Bhathal Rl et al. 2005, AJ, 1255, 2842
CorteseI am wondering if in comparing the contribution of dwarf galaxies in different environments you have considered that the field is underdense, i.e. the number of galaxies in the field is small and therefore relative errors on counts are large. Can the errors take into account of the discrepancy and reconcile the faint end slope of the Virgo Cluster and that of the Field? Same comment on the DGR.
SabatiniNumber counts in the faint part of the LF in the field indeed were so low that we couldn’t do a LF. This is why we have used the DGR for the comparison - the DGR allows to rescale taking into account the different density of the environments. However, indeed relative errors in counts are larger in the field, but I don’t think they could be responsible for reconciling the discrepancy: we would have to have missed an order of magnitude in number of dwarfs in the field compared to the centre of the cluster.
MooreWhat about Valotto et al. 2001?
SabatiniValotto et al. show that using statistical subtraction for the estimation of the background contamination, can lead to artificially steep LFs. For this reason, we do not use control fields for a statistical estimation of the background. We instead run numerical simulations to model the background galaxy population and find the best selection criteria (based on morphology) that allows to minimize the background contamination. A far away galaxy looks faint and could in principle be a contaminant in the cluster LF, but selecting galaxies for their scale length and surface brightness ensures us to get rid of these contaminants, that would appear smaller and with higher surface brightness at a given magnitude if compared to local LSB galaxies