Evidence for out-of-equilibrium crystal nucleation in suspensions of oppositely charged colloids
Abstract
We report a numerical study of the rate of crystal nucleation in a binary suspension of oppositely charged colloids. Two different crystal structures compete in the thermodynamic conditions under study. We find that the crystal phase that nucleates is metastable and, more surprisingly, its nucleation free energy barrier is not the lowest one. This implies that, during nucleation, there is insufficient time for sub-critical nuclei to relax to their lowest free-energy structure. Such behavior is in direct contradiction with the common assumption that the phase that crystallizes most readily is the one with the lowest free-energy barrier for nucleation. The phenomenon that we describe should be relevant for crystallization experiments where competing solid structures are not connected by an easy transformation.
pacs:
81.10.Aj, 82.70.Dd, 68.55.AcLiquids often must be cooled substantially below the freezing temperature before spontaneous crystallization occurs in the bulk. The reason is that the system has to overcome a free-energy barrier when moving from the metastable liquid to the stable solid phase. When the two phases are separated by a high free-energy barrier, spontaneous fluctuations that would result in the formation of the stable phase are unlikely and therefore rare. Most fluctuations will result in the formation of ephemeral “sub-critical” crystal nuclei that redissolve spontaneously. Only occasionally a crystal nucleus will form that exceeds the critical size needed for spontaneous subsequent growth Kelton (1991). The crystal nucleation rate is defined as the number of post-critical clusters that form per unit time in a unit volume. In classical nucleation theory (CNT), it is assumed that sub-critical clusters are in quasi-equilibrium with the parent phase Kelton (1991). This assumption is reasonable if the time it takes to establish an equilibrium distribution of sub-critical clusters is short compared to the time needed to nucleate a crystal. If the nucleation rate is low, the steady-state distribution of sub-critical clusters of size is (nearly) proportional to , where is the free energy associated with the formation of a crystalline cluster of size in the metastable liquid. The CNT expression for the nucleation rate per unit volume is
| (1) |
where is a kinetic prefactor and is the height of the nucleation barrier. It was already pointed out by Ostwald Ostwald (1897) that often, during crystal nucleation, a solid phase forms that is not the thermodynamically most stable one. Stranski and Totomanow Stranski and Totomanow (1933) have rationalized this observation in the language of CNT by suggesting that the phase that nucleates is the one separated from the parent phase by the lowest free-energy barrier - and this need not be the most stable solid phase. Implicit in this explanation is the assumption that the kinetic prefactor is similar for different nucleation routes, and that hence the relative nucleation rates are exclusively determined by the heights of the nucleation barriers. Unfortunately, the assumptions underlying the Stranski-Totomanow (ST) rule cannot easily be tested in experiments. Here we present simulations where we compute independently the rate of crystal nucleation and the height of the free energy barriers separating a metastable liquid from two more stable solid phases.
In order to study rare events such as liquid-solid nucleation by simulation, one has to resort to special simulation techniques, precisely because a typical nucleation event does not occur within the time scale of a conventional simulation. The only alternative is to use very large system sizes Koishi et al. (2003) and long simulation times Matsumoto et al. (2002). But even then the metastable system has to be prepared in a state deeply supersaturated before spontaneous nucleation can be observed Huang et al. (1998).
Here, we use the the Forward-Flux-Sampling (FFS) method of Allen et al. Allen et al. (2005, 2006) to compute the rate of crystal nucleation. This method was designed to study rare events both in and out of equilibrium. It can be used under conditions where brute-force simulations become impractical. FFS has been used to calculate the rate of crystal nucleation in molten salts Valeriani et al. (2005) and the nucleation rate of an Ising model in pores Page and Sear (2006).
To compute the free-energy barriers for crystal nucleation, we use umbrella sampling van Duijneveldt and Frenkel (1992). This method has been used before to compute the free-energy barriers for the nucleation of crystals ten Wolde et al. (1995); Punnathanam and Monson (2006) and liquids ten Wolde and Frenkel (1998). The umbrella-sampling approach determines the variation of the free energy of the system with a reaction coordinate that measures the progress of the transformation from the liquid to the crystalline phase. It should be noted that, whereas the nucleation rate is an observable quantity, the height of the free-energy barrier for crystal nucleation may depend somewhat on the choice of the reaction coordinate.
Making use of the information obtained using both methods we will show below that crystal nucleation in a mixture of oppositely charged colloids is incompatible with the ST conjecture.
In our simulations, we studied a 1:1 binary mixture of monodisperse, oppositely charged colloids. The screened Coulomb interaction between two colloids of diameter and charge is approximated by a Yukawa potential:
| (2) |
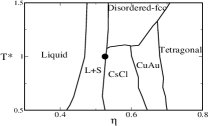
where the sign is positive for equally charged and negative for oppositely charged colloids, is the Bjerrum length ( is the dielectric constant of the solvent) and is the inverse Debye screening length ( is the number density of added salt). A hard core prevents colloids from overlapping. The total energy of the system is the sum of the pair interactions. The cut-off radius, , is 3.5. We define the reduced temperature as the inverse of the contact energy, and the reduced pressure as . The phase diagram of this potential for reproduces the solid structures that are found experimentally in mixtures of oppositely charged colloids Hynninen et al. (2006). In this system, two solid phases can coexist with the fluid. At high temperatures, the liquid phase coexists with a substitutionally disordered face-centered cubic colloidal crystal (disordered-fcc). At low temperatures the stable solid at coexistence has CsCl structure, where the charges are ordered on a bcc lattice (Fig. 1).
This system is a suitable candidate to test the Stranski-Totomanow conjecture as two distinct solid phases may form during crystal nucleation. In contrast to systems that have been studied earlier Auer and Frenkel (2002); Cacciuto et al. (2004) these two solids are not connected by an “easy” (e.g. martensitic) transformation. Besides, we study nucleation close to the coexistence temperature between both solids.
Both for the FFS calculations and for the calculation of the free-energy barrier separating liquid and solid, we need a reaction coordinate that measures the progress of the nucleation process. In the present study, we use , the number of particles in the largest solid cluster, as a reaction coordinate ten Wolde et al. (1996). Our reaction coordinate distinguishes liquid from solid but is not sensitive to the structure of the crystal lattice. In fact, under the thermodynamic conditions used in our study (, ), every particle in either the disordered fcc phase or the CsCl-like solid is identified as crystalline. On the contrary, in the metastable liquid phase, less than five out of 1000 particles were identified as crystalline.
The FFS technique expresses the nucleation rate, , as the product of two factors van Erp et al. (2004):
| (3) |
where is the rate at which spontaneous fluctuations lead to the formation of a small crystallite consisting of particles, whilst denotes the probability that such a cluster will grow to form a bulk solid, rather than redissolve. In what follows, we will ignore the effect of hydrodynamic interactions and estimate using a kinetic Monte Carlo (MC) algorithmCichocki and Hinsen (1990) with a maximum displacement of 0.01 Auer and Frenkel (2002, 2001). In the limit of small trial displacements, the MC algorithm approaches Brownian Dynamics, but MC has the added advantage that we can easily work in the ensemble. The probability is computed as a product of probabilities:
| (4) |
where is the probability that a trajectory that starts with a cluster of size , will grow to size rather than redissolve. This probability can be estimated by starting a number of trajectories from a cluster of size and dividing the number of those that arrive at by the total number of trials. The successful trajectories provide starting configurations for the next step, namely, the calculation of the probability that cluster will grow to size , rather than redissolve. The FFS method only works if the dynamics of the system is not fully deterministic. In the present case, different kinetic MC trajectories (with maximum displacement 0.04 ) were generated from the same configuration by changing the seed of the random number generator. We stress that the “reaction coordinate” in the FFS scheme is only used to measure the progress of the crystal growth –it does not favor one crystal structure over another Allen et al. (2005, 2006).
In this work, we have studied the crystallization of the metastable liquid phase in a system of 1000 particles at and =15 (). The packing fraction of the liquid at the coexistence pressure, , is . At and , the packing fraction of the metastable liquid is .
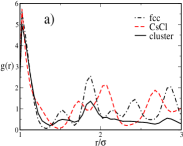
At , no spontaneous nucleation is observed even after MC cycles (a cycle consists of a trial move per particle and a volume move). However, the nucleation rate can be computed at using the FFS method (3). We find that the probability that a crystalline cluster of 5 particles will continue to solidify is . The rate at which spontaneous fluctuations in the metastable liquid result in the formation of crystalline clusters of 5 particles is equal to (where denotes the diffusion coefficient at infinite dilution). Therefore, the nucleation rate is estimated to be . We observe the growth of a rather compact solid cluster in the metastable liquid. When the crystalline cluster has reached a size of , it has a 50% probability of redissolving: this is our operational definition of the critical nucleus size. To identify the crystal structure of the solid nucleus, we analyse the radial distribution function of the particles that belong to the cluster. This provides a convenient way to distinguish disordered fcc and CsCl structures. Figure 2 a shows the comparison of for a cluster of 80 particles with that of the bulk solid phases. From the figure, it is evident that the arrangement of the particles in the growing solid cluster is fcc-like even though the stable solid phase at and is CsCl.
The formation of crystal nuclei of a metastable solid phase can be interpreted as a manifestation of the Ostwald step rule. According to the conjecture of Stranski and TotomanowStranski and Totomanow (1933), the free energy barrier for the formation of disordered fcc should then be lower than the one for the formation of a CsCl cluster. The ST conjecture relies on the assumption that sub-critical nuclei are in quasi-equilibrium. However, as we will show, this turns out not to be the case. We can test this by repeating the FFS scheme with a different kinetic MC scheme that includes an additional trial move: the swap of positive and negative particles. If the system is already in equilibrium, the introduction of additional MC moves will not change the structure of the sub-critical nuclei.
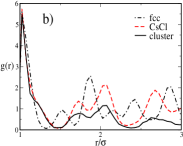
When we performed FFS simulations including 20% swap moves we observe the formation of charge-ordered clusters with a CsCl structure (Fig.2 b). Not only the structure of the sub-critical nuclei has changed but also the size of the critical nucleus: it now contains . Moreover, the probability that a solid cluster of 5 particles will form a bulk crystal has increased to 10-15±1. The fact that the pathway for crystal nucleation can be altered by artificially improving the sampling of configurational space indicates that local equilibrium is not established during the natural nucleation dynamics (no swaps). This observation is in direct contradiction to the key assumption underlying the Stranski-Totomanow conjecture. Our simulations suggest that the time it takes a cluster to grow from a small size to the critical size is too short to allow for efficient sampling of the accessible configurational space – as a result, it gets kinetically trapped in a metastable structure. We expect that such behavior will be common when there is no “easy” kinetic route (e.g. martensitic transformation) from the metastable to the stable crystal phase.
At higher pressures (), where the probability of forming a post-critical nucleus is higher and no FFS is needed to observe the transition, the same phenomenology is reproduced. In a kinetic MC simulation without swap moves a substitutionally disordered fcc lattice is formed. The same is obtained in a Brownian Dynamics simulation. In contrast, when swap moves are included, the liquid transforms into a substitutionally ordered lattice.
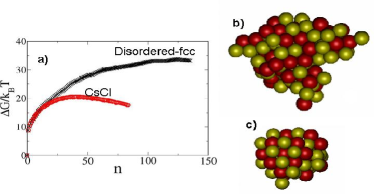
Interestingly, as we can selectively prepare fcc or CsCl nuclei by changing our kinetic MC scheme, we can now separately compute with umbrella sampling van Duijneveldt and Frenkel (1992) the free energies of these two different types of clusters. In umbrella-sampling simulations, the minimum free energy path is sampled along a given reaction coordinate. Nevertheless, when the calculation is carried out without swap moves, the growth of CsCl clusters is dramatically slowed down, instead, fcc clusters are formed and persist for long time in the system. If the simulation is run long enough, the structure of the clusters changes into CsCl, suggesting that CsCl clusters have indeed lower free energy. By including swap moves in the umbrella sampling scheme, clusters grow directly in their lowest free-energy state (CsCl), yielding a different free-energy barrier. Fig.3 shows the barriers for both types of calculations. As can be seen from the figure, the free-energy barrier for the nucleation of fcc clusters is higher than that for CsCl clusters. Snapshots of two typical critical clusters (fcc and CsCl) are also shown in Fig. 3.
This observation has direct implication for the interpretation of experiments Bartlett and Campbell (2005); Leunissen et al. (2005). The dynamics of real binary crystals of charged colloids is best described by the kinetic MC scheme (i.e. without unphysical swap moves). Hence we should expect that in charged colloidal systems, crystallization proceeds through a sequence of non-equilibrium sub-critical crystal nuclei. In experiments on crystallization in binary charged colloids Hynninen et al. (2006), both substitutionally ordered (CuAu) and substitutionally disordered (fcc) crystallites have been observed. The simultaneous observation of both phases could be explained thermodynamically if the experimental conditions fortuitously happened to correspond to coexistence. The present work suggests another explanation: non-equilibrium nucleation of the fcc phase precedes a subsequent, slow transformation to the substitutionally ordered crystal phase.
At first sight, it might seem that the present results, although at odds with the ST conjecture, are not incompatible with CNT. After all, within that theory, preferred nucleation of the crystal structure with the higher nucleation barrier is possible if a large kinetic prefactor in Eq. 1 compensates the effect of the higher nucleation barrier. Yet, the existing versions of CNT do not correctly describe this effect: in CNT the kinetic prefactor describes the rate at which clusters grow due to the attachment and detachment of single particles to a pre-existing crystallite, and the rate of addition and removal of particles is hardly different for fcc and CsCl clusters. What seems to happen is that small clusters have a disordered fcc structure, but this structure cannot act as a template for subsequent CsCl growth, whilst a structural phase transition inside the clusters is kinetically inhibited. A crystal cluster could change its internal structure by a succession of particle additions and removals, but in practice this would mean that a disordered fcc cluster would have to redissolve almost completely before it can form a CsCl cluster. The “success” of the small sub-critical fcc clusters blocks the subsequent formation of the more stable CsCl clusters. This phenomenon is reminiscent of the “self-poisoning” of small crystallites during the rapid growth of post-critical crystal nuclei Towler et al. (2004). The difference is that, in the present case, the self-poisoning already takes place with sub-critical nuclei.
The present results imply that, at least to predict crystal nucleation, there are situations where it is not enough to compute the free energy barrier that separates the parent phase from resultant solid structures - beyond a certain cluster size, the formation of the lowest free-energy clusters may be kinetically inhibited. The fast growth of the clusters results in the breakdown of the local equilibrium assumption for sub-critical nuclei.
E. S. acknowledges useful discussions with M. Hermes and A. Cuetos. The authors acknowledge a critical reading by J. van Meel and R. Allen. The work of the FOM Institute is part of the research program of FOM and is made possible by financial support from the Netherlands organization for Scientific Research (NWO).
References
- Kelton (1991) K. F. Kelton, Cristal Nucleation in Liquids and Glasses (Academic, Boston, 1991).
- Ostwald (1897) W. Ostwald, Z. Phys. Chem. 22, 289 (1897).
- Stranski and Totomanow (1933) I. N. Stranski et al., Z. Phys. Chem. 163, 399 (1933).
- Koishi et al. (2003) T. Koishi et al., J. Chem. Phys. 119, 11298 (2003).
- Matsumoto et al. (2002) M. Matsumoto et al., Nature 416, 409 (2002).
- Huang et al. (1998) J. Huang et al., J. Phys. Chem. A 102, 2708 (1998).
- Allen et al. (2005) R. J. Allen et al., Phys. Rev. Lett. 94, 018104 (2005).
- Allen et al. (2006) R. J. Allen et al., J. Chem. Phys. 024102, 024102 (2006).
- Valeriani et al. (2005) C. Valeriani et al., J. Chem. Phys. 122, 194501 (2005).
- Page and Sear (2006) A. Page et al., Phys. Rev. Lett. 97, 065701 (2006).
- van Duijneveldt and Frenkel (1992) J. S. van Duijneveld et al., J. Chem. Phys. 96, 4655 (1992).
- ten Wolde et al. (1995) P. R. ten Wolde et al., Phys. Rev. Lett. 75, 2714 (1995).
- Punnathanam and Monson (2006) S. Punnathanam et al., J. Chem. Phys. 125, 024508 (2006).
- ten Wolde and Frenkel (1998) P. R. ten Wolde et al., J. Chem. Phys. 109, 9901 (1998).
- Hynninen et al. (2006) A.-P. Hynninen et al., Phys. Rev. Lett. 96, 018303 (2006).
- Auer and Frenkel (2002) S. Auer et al., J. Phys. Cond. Mat. 14, 7667 (2002).
- Cacciuto et al. (2004) A. Cacciuto et al., Phys. Rev. Lett. 93, 166105 (2004).
- ten Wolde et al. (1996) P. R. ten Wolde et al., J. Chem. Phys. 104, 9932 (1996).
- van Erp et al. (2004) T. S. van Erp et al., J. Chem. Phys. 118, 7762 (2003).
- Cichocki and Hinsen (1990) B. Cichocki et al., Physica A 166, 473 (1990).
- Auer and Frenkel (2001) S. Auer et al., Nature 409, 1020 (2001).
- Bartlett and Campbell (2005) P. Bartlett et al., Phys. Rev. Lett. 95, 128302 (2005).
- Leunissen et al. (2005) M. E. Leunissen et al., Nature 437, 235 (2005).
- Towler et al. (2004) C. S. Towler et al., J. Am. Chem. Soc. 126, 13347 (2004).