11email: gsala@mpe.mpg.de
XMM-Newton and INTEGRAL observations of the black hole candidate XTE J1817-330 ††thanks: Based on observations obtained with XMM-Newton, an ESA science mission with instruments and contributions directly funded by ESA Member States and NASA; and with INTEGRAL, an ESA project with instruments and science data center funded by ESA member states (especially the PI countries: Denmark, France, Germany, Italy, Switzerland, Spain), Czech Republic and Poland, and with the participation of Russia and the USA.
Abstract
Aims. The galactic black hole candidate XTE J1817-330 was discovered in outburst by RXTE in January 2006. We present here the results of an XMM-Newton Target of opportunity observation (TOO), performed on 13 March 2006 (44 days after the maximum), and an INTEGRAL observation performed on 15-18 February 2006 (18 days after the maximum).
Methods. The EPIC-pn camera on-board XMM-Newton was used in the fast read-out Burst mode to avoid photon pile-up, while the RGSs were used in Spectroscopy high count rate mode. We fit both the XMM-Newton and the INTEGRAL spectra with a two-component model consisting of a thermal accretion disk (represented by diskbb or diskpn models) and a comptonizing hot corona (represented by a power-law or the compTT model).
Results. The soft X-ray spectrum is dominated by an accretion disk component, with a maximum temperature decreasing from 0.96 at the time of the INTEGRAL observation to on 13 March. The Optical Monitors on board INTEGRAL and XMM-Newton showed the source with magnitudes V: 11.3–11.4, U:15.0–15.1 and UVW1:14.7–14.8. The soft X-ray spectrum, together with the optical and UV data, show a low hydrogen column density towards the source, and several absorption lines, most likely of interstellar origin, are detected in the RGS spectrum: OIK, OIK, OII, OIII and OVII, which trace both cold and hot components of the ISM. The soft X-ray spectrum indicates the presence of a black hole, with an estimate for the upper limit of the mass of 6.0M⊙.
Key Words.:
X-rays: stars – stars: binaries: close – X-rays: individual: XTE~J1817-3301 Introduction
X-ray binaries are the brightest X-ray sources in the sky. They are powered by the accretion of material from the secondary star onto a compact object (neutron star or black hole). The spectral type of the companion determines the accretion regime and properties. In low mass X-ray binaries, with secondary stars of type later than A, the mass transfer occurs through Roche lobe overflow and forms an X-ray emitting accretion disk. The optical emission is dominated by the X-ray heated companion, the outer disc and/or reprocessed hard X-rays. In the case of high mass X-ray binaries, where the companion is an O or B star, the strong wind of the secondary star is intercepted and accreted by the compact object. The main X-ray source stems from the wind interaction. Though an accretion disk may also be present, the secondary star is dominating the optical emission of the source.
The generally accepted picture for the X-ray emission of accreting black holes consists of an accretion disk, responsible for thermal black body emission in the X-ray band; and a surrounding hot corona, origin site of non-thermal power-law emission, up to the energy range of gamma-ray telescopes, due to inverse comptonization of soft X-ray photons from the disk. The standard accretion disk model (Mitsuda et al. mit84 (1984), diskbb model in xspec) consists of the sum of blackbodies from an accretion disk with a surface temperature that depends on the radius as . This asymptotic distribution is sufficiently accurate for . But since the model neglects the torque-free boundary condition, the temperature distribution is not accurate for the inner disk when it extends down to the innermost stable orbit. The diskpn model in xspec (Gierliński et al. gie99 (1999)) includes corrections for the temperature distribution near the black hole by taking into account the torque-free inner-boundary condition.
At present, around 20 X-ray binaries contain a dynamically confirmed black hole, and around another 20 are the so called black-hole candidates (see Remillard & McClintock rmc06 (2006) for a recent review). Seven of the 20 confirmed black holes, and 12 of the black-hole candidates are transient sources with only one unique outburst observed. XTE J1817-330 is the next one to be added to the list of transient black-hole candidates.
XTE J1817-330 was discovered by the Rossi X-ray Timing Experiment (RXTE) on 26 January 2006 (Remillard et al. rem06 (2006)) with a flux of 0.93() Crab (2-12 keV) and a very soft spectrum, typical for black hole transients. The source reached a maximum of Crab on 28 January 2006, followed by an exponential decline in X-ray flux (Fig. 1), with an e-folding time of 27 days. Only five days after the discovery, the radio counter-part was identified, with a steep spectrum and no evidence for variability (Rupen et al. 2006a ), and a second observation four days later showed a fading in flux of a factor 2.6 (Rupen et al. 2006b ). The NIR counterpart was discovered on 7 February with magnitude (D’Avanzo et al. dav06 (2006)), and only four days later, the optical counterpart was identified (Torres et al. tor06 (2006)), with . The g’-K color supports a low reddening to the source. The non-detection of the source in previous images indicates a large outburst amplitude in the optical, suggesting a short orbital period (Torres et al. tor06 (2006)).
| Obs. ID | Observation start | Observation end | Flux (10–200 keV) | Photon index |
|---|---|---|---|---|
| () | ||||
| 00030359011 | 2006-01-31T22:15:43 | 2006-01-31T22:38:02 | ||
| 00035348002 | 2006-02-03T03:21:26 | 2006-02-03T03:34:02 | ||
| 2006-02-03T06:39:36 | 2006-02-03T06:49:18 | |||
| 2006-02-03T17:48:27 | 2006-02-03T18:01:01 | |||
| 2006-02-03T21:01:26 | 2006-02-03T21:18:02 | |||
| 00035339002 | 2006-02-15T14:13:03 | 2006-02-15T14:35:02 | ||
| 00192152001 | 2006-02-24T14:46:31 | 2006-02-24T15:29:12 | ||
| 2006-02-24T16:23:00 | 2006-02-24T17:05:38 | |||
| 2006-02-24T17:59:26 | 2006-02-24T18:42:04 | |||
| 2006-02-24T19:35:53 | 2006-02-24T20:15:21 |
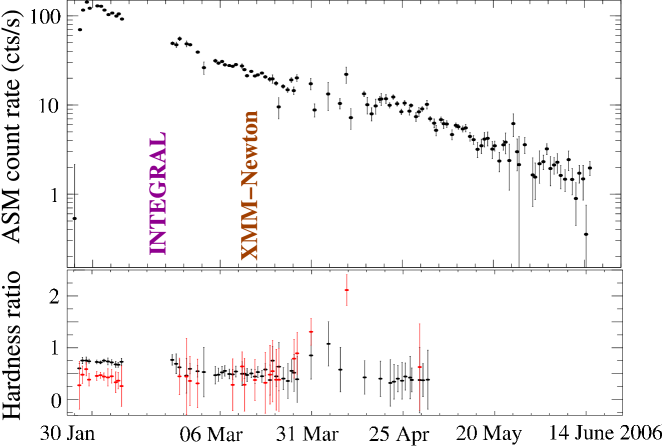
We requested an XMM-Newton (0.4-10.0 keV) Target of Opportunity Observation (TOO) shortly after the discovery. The observation could not be performed until the first visibility period of the source, which started on 13 March 2006. Here we report on the results of the XMM-Newton TOO, together with an INTEGRAL (20-150 keV) pointed observation performed on 15-18 February 2006 (Goldoni et al. gol06 (2006)). In section 2 we give the details of the observations. The results are described in section 3 and discussed in section 4.
2 XMM-Newton and INTEGRAL observations
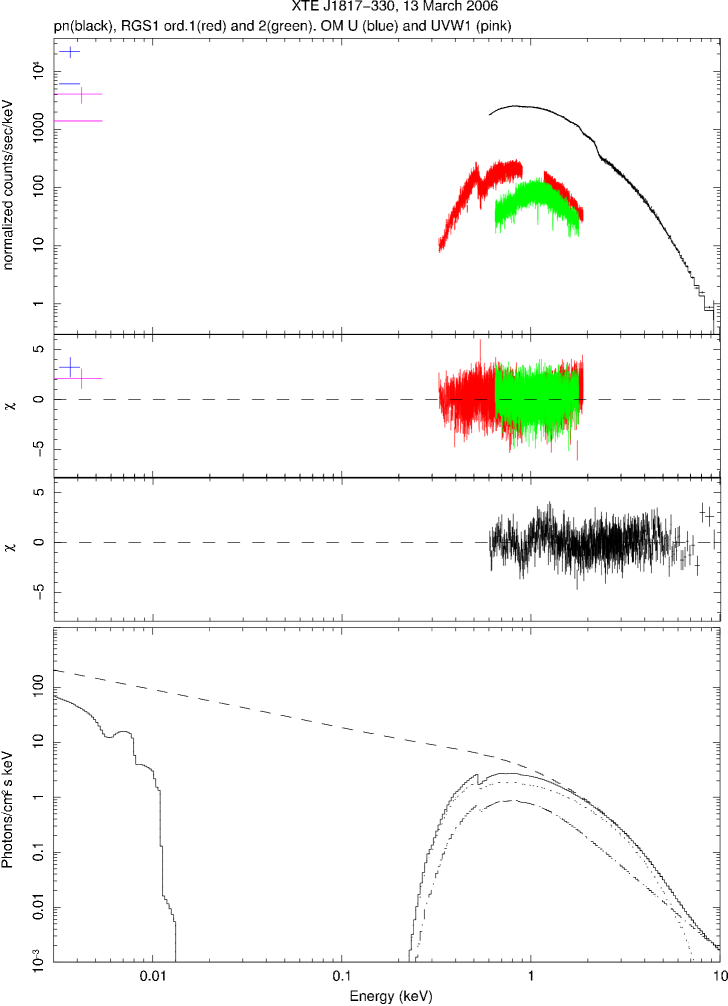
We obtained a TOO observation with XMM-Newton (0.1-10.0 keV) on 13 March 2006 (obs. ID. 0311590501, 20 ks), when the source flux detected by the All Sky Monitor (ASM) on board RXTE had faded to 300 mCrab. The EPIC-pn camera was used in the fast read-out Burst mode (Kuster et al. kus99 (1999)). The spectrometer RGS1 was operated in Spectroscopy High Count Rate mode, which reads the CCD nodes one by one, avoiding photon pile-up. RGS2 cannot be operated in this mode and was highly affected by pile-up. The two MOS cameras were switched off for telemetry limitations. The Optical Monitor (OM) on board XMM-Newton obtained simultaneous optical light-curves in the Fast mode, using filters U (first 10 ks, split in five 1.7 ks exposures) and UVW1 (10 ks, again split in five 1.7 ks exposures), and using simultaneously a fast mode window and an imaging window.
XMM-Newton data were reduced with the XMM-Newton Science Analysis Software (SAS 7.0.0), and XRONOS 5.21 and XSPEC 11.3 were used for timing and spectral analysis. The high flux of the source provides a spectrum with high statistics in the EPIC-pn camera. After checking that adding the double events increases the total count rate only by 10–15%, we decided to keep the best spectral resolution for the EPIC-pn by taking only single events (pattern=0) into account. The source spectrum was extracted from a box including 10 RAWX columns at each side of the source position, and excluding events with RAWY 140 (to avoid direct illumination by the source) and RAWY 10. Some problems with the calibration of the Burst mode are affecting the soft part of the EPIC-pn spectrum, and cause extra residuals in this energy range, especially around the oxygen edge at 0.5 keV. We therefore consider events with energies between 0.6 and 10.0 keV for spectral analysis. The exclusion of energies below 0.6 keV does not represent an important loss in this case, since the lowest end of the X-ray band is simultaneously covered by the RGS, which provide good spectra at high resolution of this energy band.
The OM data have been included for joint spectral analysis with the X-ray data by using the canned response matrices provided at the XMM-Newton calibration portal (v1.0) in conjunction with two spectral data files containing the average count rates for each filter. The total count-rate error has been determined by adding the statistical filter measurement error given by the OM processing, in quadrature with the absolute error of the calibration of the response matrices, which is 10%.
INTEGRAL observed XTE J1817-330 in hard X-rays (20-150 keV) as a TOO on 15-18 February 2006 (Goldoni et al. gol06 (2006)). 90 science windows for a total amount of 193 ks of exposure time on the source were considered. We used the INTEGRAL Off-line Scientific Analysis (OSA) version 5.1, and the matrices available for standard software (isgr_rmf_grp_0016.fits and isgr_arf_rsp_0014.fits) for the spectral analysis. Data screening was performed according to the median count rate with respect to each science window and its distribution: science windows with rate larger than 10 standard deviations from the median count rate were excluded. We added a systematic error of 10% to the JEM-X data.
XTE J1817-330 was also detected with Swift/BAT. We analyzed 7 months of BAT survey data (from January 2006 to July 2006) looking for a detection of XTE J1817-330. Data processing was performed using standard Swift software available in the HEADAS 6.1 distribution and following the recipes of the BAT analysis threads at the HEASARC web pages. Specifically, only data which satisfied the following requirements were used: (1) the star tracker is locked and the spacecraft is settled on the nominal pointing direction; (2) the spacecraft is outside the South Atlantic Anomaly and the total rate of the BAT array is less than 18000 s-1 . Data which fulfilled the above requirements were rebinned in energy accordingly to the Gain/Offset map generated on board and were used to generate a sky image. The sky images were searched for excesses above the 6-sigma threshold. XTE J1817-330 was detected 10 times above this threshold and for all these observations we extracted a spectrum (Table 1). The BAT XTE J1817-330 spectra were used to test the spectral variations between the XMM-Newton and the INTEGRAL observations.

3 Results
XTE J1817-330 was clearly detected by all instruments on board XMM-Newton and INTEGRAL. It provided a high statistics spectrum in the EPIC-pn camera, with a count-rate of 339060 cts/s. The XMM-Newton Optical Monitor shows the source with standard AB magnitudes and (magnitudes from the OM observation source list obtained by the SAS task omsrclistcomb) (Fig. 2).
The EPIC-pn light curve, together with the simultaneous U and UVW1 light curves obtained by the XMM-Newton OM, are shown in Fig.3. The light curve of a comparison star in the OM field of view is also shown. The EPIC-pn count-rate is corrected for dead time losses, which in Burst mode are 97%. The X-ray light curve is constant within 5% during the whole observation The simultaneous U light curve shows a slight modulation, rising during the first 6 ks and decreasing afterwards. Although not so clearly, the later UVW1 light curve suggests a possible continuation of this modulation. This might hint to an orbital modulation with a period of 6 hours.
XTE J1817-330 is clearly detected in IBIS/ISGRI, with a significance of 246, with a total of 2.4 and a count rate of . The Optical Monitor on-board INTEGRAL shows XTE J1817-330 with an instrumental visual magnitude of V: 11.350.05.
3.1 Spectral analysis
We use a 2-component model consisting of a thermal accretion disk plus power-law to fit both the XMM-Newton and INTEGRAL spectra of XTE J1718-330. Since the RXTE/ASM hardness ratio of the source is not changing substantially from the start of the outburst until the time of the XMM-Newton observation, we checked whether the spectrum was the same in February (time of INTEGRAL observation) as in March (XMM-Newton observation). For that purpose we have analyzed the spectra of 10 Swift/BAT XTE J1817-330 detections in February–March 2005, five of them occurring between the INTEGRAL and the XMM-Newton observations (Table 1). The BAT spectra in the 20–60 keV range during this period are indeed consistent, within the errors, with a power-law of photon index 2.5–3.0. This range is however too wide as to assume a constant spectrum, so we fit separately INTEGRAL and XMM-Newton data.
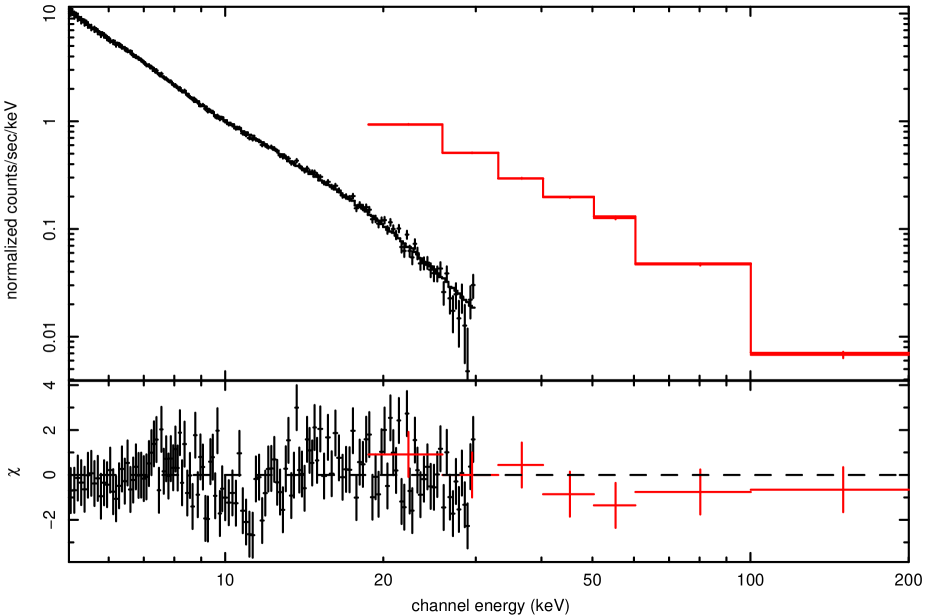
3.1.1 INTEGRAL observation
We fit simultaneously JEM-X (6–30 keV) and IBIS/ISGRI (20–200 keV) spectral data obtained on 15–18 February 2006 with a two component model, diskbb + pow (Figure 4). We add a free relative normalization constant to IBIS data to account for differences between the JEM-X and IBIS calibration. The best fit () is obtained with , , photon index and power-law normalization @1 keV. The relative normalization constant added to IBIS is 1.3. Other spectral models do not improve the fit. No cut-off is found in the spectrum up to 150 keV, and a power-law with a photon index 2.660.02 provides a good fit to the IBIS data alone (). The observed flux is in JEM-X (5–30 keV) and in IBIS (20–200 keV) (errors at 90% confidence).
| TBabs (diskbb + pow) | ||
|---|---|---|
| (frozen) | ||
| Photon index, | ||
| @1 keV) | ||
| (d.o.f) | 1.25 (6029) | 1.45 (6030) |
-
a
All model fits include the oxygen absorption edge and lines listed in Table 4.
-
b
Normalization constant of the diskbb accretion disk model, , where is the innermost disk radius, the distance to the source, and the inclination of the disk.
| TBabs (diskbb + compTT) | TBabs (diskpn + compTT) | |
| 0.05) | ||
| - | ||
| - | (frozen) | |
| - | ||
| 50 (frozen) | 50 (frozen) | |
| L | ||
| (d.o.f) | 1.19 (6028) | 1.18 (6028) |
-
a
All model fits include the oxygen absorption edge and lines listed in Table 4.
-
b
Normalization constant of the diskbb accretion disk model, , where is the innermost disk radius, the distance to the source, and the inclination of the disk.
-
c
Normalization constant of the compTT comptonization model.
-
d
Normalization constant of the diskpn accretion disk model, , where M is the black-hole mass in solar units, i is the inclination of the disk, D is the distance to the system in kpc and is the color/effective temperature ratio.
3.1.2 XMM-Newton observation
We fit simultaneously the data of all XMM-Newton instruments active during the 13 March 2006 observation, i.e., EPIC-pn (0.6–10.0 keV), RGS (0.3–2.0 keV) and OM (exposures with U and UWV1 filters) data (Fig. 5). In all fits in this section, the absorption edge and lines described in section 3.2 are included to minimize the RGS residuals. Error ranges given in this section are 3 confidence.
We use the TBabs model for the foreground absorption (Wilms et al. wil00 (2000)). We cannot, however, use the same absorption model for the OM data, because X-ray absorption models are not defined for UV and optical wavelengths. We use thus the redden model in xspec for the OM data, an IR/optical/UV extinction model from Cardelli et al. (car89 (1989)) with transmission set to unity for energies higher than 15 eV. During the fit, we keep the extinction in redden for the OM data linked to the absorbing hydrogen column density of the TBabs model affecting the X-ray data, by using the relation between optical extinction and hydrogen column density (Zombeck zom07 (2007)).
We first attempt to fit the continuum spectrum with an absorbed multi-temperature accretion disk blackbody model (diskbb in xspec), plus a power-law accounting for the contribution of the comptonized photons in the hot corona. A reasonable fit ( is obtained only for an absorption column density , with , and photon index (Table 2). This high absorption column is in disagreement with the low reddening observed towards the source (Torres et al. tor06 (2006)) and the low absorption pointed out from RXTE, Swift, Chandra and INTEGRAL observations (Remillard et al. rem06 (2006), Miller et al. 2006a , Steeghs et al. ste06 (2006), Miller et al. 2006b , Goldoni et al. gol06 (2006)). Fixing the absorption column to the interstellar value () leads to a poorer fit (, see Table 2 for details) with large residuals for the EPIC-pn. These poor results of the diskbb + pow model are driven by the fact that the power–law component not only accounts for the hard energy band spectrum, but dominates the emission model at low energies, below 1 keV. If the power-law component accounts for the disk photons inverse-comptonized in the corona to higher energies, it is unphysical that they dominate the emission at energies lower than the maximum emission of the disk.
Better fits are obtained using the compTT model for the corona component (Titarchuk tit94 (1994), see Table 3). The electron temperature is fixed to 50 keV in all fits. We do not consider it necessary to tie the temperature of the seed photons to the disk temperature because the best-fit is always obtained with temperatures lower than the maximum temperature of the accretion disk. The best fit for the diskbb+compTT model (with ) is obtained for an absorption column density , a disk with and , and a comptonizing hot plasma with seed photons temperature , and optical depth .
Table 3 also lists the results of the fit using the diskpn model also available in xspec (Gierliński et al. gie99 (1999)). The diskpn model is an extension of the diskbb model, which takes into account the torque-free inner-boundary condition for the accretion disk. The results are very similar with both disk models, but we prefer diskpn both because of the more precise treatment of the inner boundary and for its parametrization. We fix the inner radius in the diskpn model to 6. We obtain the best fit for the diskpn + compTT model () with an absorption column density of , and a disk with and , where M is the black-hole mass in solar units, i is the inclination of the disk, D is the distance to the system in kpc and is the color/effective temperature ratio. The small effective temperature suggests a non-rotating black-hole, and justifies thus the choice of . The best-fit parameters for the compTT model component are the same as for the diskbb + compTT case.
The total unabsorbed flux from the EPIC-pn spectrum (0.4-10 keV) is , indicating an X-ray luminosity of the source at the time of the observation of .
| Identification | Measured | FWHM | Eq. width | F-test | ISM rest-frame |
| Probability | |||||
| O I K | 23.507 | ||||
| O II K | 23.350 | ||||
| O III K | 0.1(fixed) | 23.114 | |||
| O I K | 22.887 | ||||
| O VII K | 21.602 | ||||
| Observed ) | Depth | ||||
| O K edge | |||||
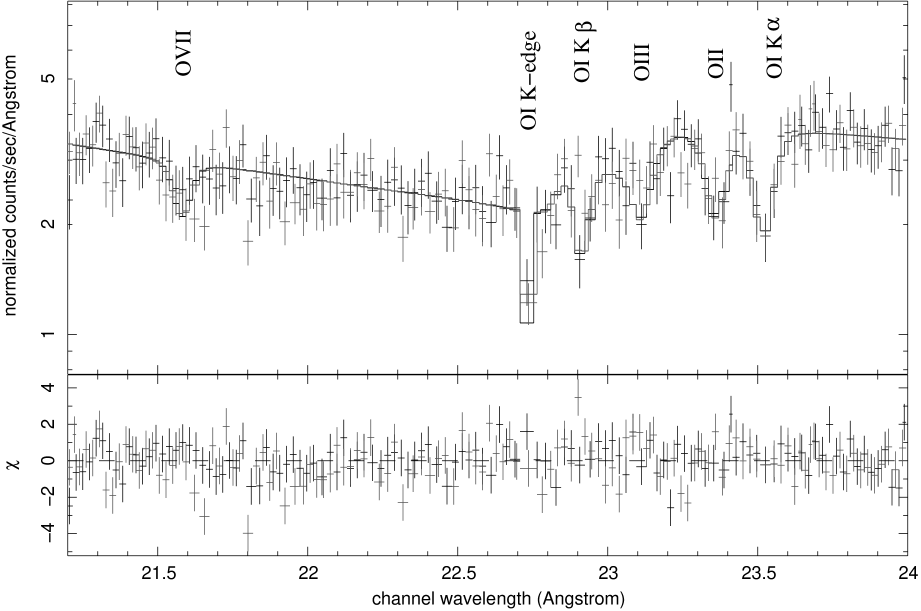
3.2 Interstellar absorption lines
Several absorption features are detected in the RGS spectrum around the oxygen K edge (Fig. 6). In order to explicitly fit the complex structure of the edge and surrounding lines, we have used the vphabs model in xspec as absorber with the oxygen abundance set to zero. We use Wilms et al. (wil00 (2000)) solar abundances for other elements than oxygen, and Verner et al. (ver96 (1996)) cross-sections. We then fit the absorption features with an edge and five Gaussian lines (Table 4).
The observed wavelengths are compatible with the rest frame energy of the lines. Taking into account the uncertainty in the wavelength determination for OI and OII lines (250 km/s for OI, 380 km/s for OII), we can discard the possible location of low ionized species in an intrinsic high-velocity wind of the source. Nevertheless, we can not safely distinguish between interstellar medium (ISM) absorption and some low velocity absorber intrinsic to the source for OIII or OVII (with error ranges in the wavelength determination of 1200 km/s for OIII and 800 km/s for OVII). Interstellar oxygen lines around the oxygen K-edge have previously been observed in the RGS spectra of other sources, and distinguished from the known instrumental components at 23.05 and 23.35 Å(de Vries et al. cor03 (2003)). Interstellar O I, O II and O III absorption lines have also been detected in the high resolution Chandra/HETGS spectra of several X-ray binaries and assigned to the ISM (Juett et al. jue04 (2004)), and Yao & Wang (yao06 (2006)) used the absorption spectra of 4U 1820-303 to determine ISM oxygen and neon abundances.
The O I K line at 23.52 was also detected in the RGS spectra of GRO J1655-40 (Sala et al. sal07 (2007)). As in that case, we confirm the ISM origin of the line by comparing its equivalent width and the hydrogen column density to the source with that of other sources from the previously mentioned works, with which it is consistent.
The RGS1 spectrum of XTE J1817-330 also shows an absorption line at 21.6 , which corresponds to O VII K. O VII indicates the presence of a hot absorbing gas, at T K, and can be produced either by the hot ISM component, or by some intrinsic warm absorber. O VII was detected in the Chandra/HETGS spectrum of GX 339-4 (Miller et al. mil04 (2004)). The authors discussed in that case the difficulties with ascribing the absorption lines to the hot ISM and argued that the origin of the absorption was an intrinsic warm absorber close to the black hole. O VII lines have also been detected at red-shift zero in the spectra of several AGN, opening a debate on the location of the absorber: either in the intergalactic medium of the Local Group, in the Galactic halo or in the Galactic ISM. More recently, not only has O VII been identified as ISM absorption in the spectra of several Galactic low mass X-ray binaries, but it has even been used as tracer of the hot component of the Galactic ISM (Yao & Wang yao05 (2005, 2006)).
The residuals of the EPIC-pn spectrum show an absorption feature at 1.83() keV (, Fig. 7). This line lays in an energy range with rapidly changing effective area (close to Si edge), so its significance must be taken with care. We fit this line with a Gaussian with width fixed to the resolution of the EPIC-pn camera at this energy (100 eV), and obtain an equivalent width of eV (, 90% confidence error) and an F-test probability of . A narrow absorption line near 1.82 keV has been also observed in the spectra of several AGN, and identified as the 1.821 keV line transition of Fe XXIV (Haberl et al. hab06 (2006)). The strongest line was found for MCG-6-30-15, which also showed another Fe XXIV line, as well as lines from other Fe ions (Turner et al. tur04 (2004)). In all cases, the line was interpreted as ISM absorption. Supernova explosions or interaction of supernova remnants with the ISM can heat the interstellar gas up to 2.5 keV, which fits with the temperature range of maximum emissivity of Fe XXIV (1.5-2.5 keV).

4 Discussion
The presented X-ray spectrum of XTE J1817-330 in March 2006 shows the source in a typical high/soft state for black hole transients. From the best-fit parameters of the continuum spectrum, some constrains are obtained for the distance to the source and the mass of the compact object.
Both the inner temperature and radius of the accretion disk point to the presence of a black hole in the system. The inner temperature of the disk (0.700.01 keV) is too low for a neutron star X-ray binary, with typical temperatures of 1.4-1.5 keV, while for non-rotating black hole binaries it is typically less than 1.3 keV (Tanaka tan95 (1995)).
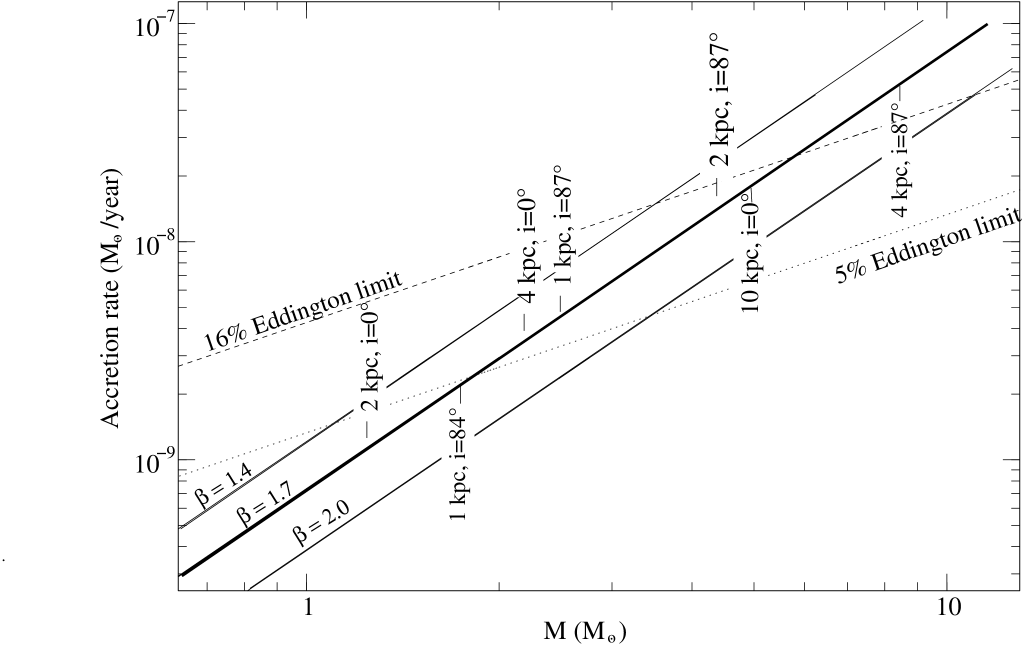
The normalization constant K of the diskpn model is related to the mass of the compact object M, the distance to the source D and the inclination of the disk i as , where is the color/effective temperature ratio. Furthermore, the accretion rate can be obtained from the mass of the compact object and the maximum temperature of the disk (Gierliński et al. gie99 (1999)). Assuming and with the best fit value for the normalization of the diskpn model (), we plot in Figure 8 the accretion rate as a function of the mass of the compact object, giving different values for inclinations and distances (from 1 to 10 kpc). At the time of the XMM-Newton observations, the flux of the source had decreased by a factor of 6 with respect to the maximum registered by RXTE. Assuming that at the time of the maximum the accretion rate was 30% of the Eddington limit, , we overplot in Figure 8 the accretion rate corresponding to 5% of the Eddington limit. This sets a minimum mass for the central object of 2 M⊙.
To set an upper limit, we also overplot the accretion rate corresponding to 16% of (corresponding to the source being close to the Eddington limit at the time of the maximum). This sets an upper limit for the mass for the central object of 6 M⊙.
The above determined limits are obtained assuming . In Figure 8 we also plot the accretion rate for and to establish some “harder” limits for the mass. This leads to a hard upper limit of 10.0 M⊙ for the black hole in XTE J1817-330. Other sources of uncertainty in this upper limit, like the dependence of the disk parameters on the hard component model, are much smaller and thus negligible in this exercise: as determined in section 3, the disk temperature remains the same within 5%, independent of the hard component model; the disk normalization parameter experiences more differences depending on the hard component model and the absorption, changing up to a factor 1.5. However, any of these uncertainties are reflected in Figure 8 by a change in the accretion rate of the order of the line width in the plot, completely negligible in the rough determination of mass limits presented here.
The absorption column obtained with the diskbb+compTT and diskpn+compTT model fits is in agreement with the low absorption already pointed out at the discovery of the source with RXTE (Remillard et al. rem06 (2006)), and confirmed later on in UV and X-rays with pointed observations of RXTE (Miller et al. 2006a ), Swift/UVOT (Steeghs et al. ste06 (2006)), Chandra (Miller et al. 2006b ) and INTEGRAL (Goldoni et al. gol06 (2006)). The low absorption towards XTE J1817-330 makes this new black hole candidate an ideal target for optical observations in the quiescent state, which could provide the dynamical confirmation of the presence of a black hole in the system.
The absorbing hydrogen column is also compatible within the errors with the average galactic column density in the source direction, 1.57 (Dickey & Lockman dic90 (1990)). This locates XTE J1817-330 behind the galactic slab of interstellar medium and provides a lower limit for the distance of 1 kpc.
From Figure 8, taking the 6 M⊙ upper limit for the central object mass and assuming a face on disk, we obtain an upper limit for the distance of 10 kpc.
The type of the secondary star can be constrained from the non-detection of the source previous to outburst in the DSS (V22 mag). With the extinction towards the source derived from the NH, A, the lower limit on the absolute magnitude is M mag (for the maximum possible distance, 10 kpc). A limit on the absolute magnitude of M mag implies that the secondary star must be a K-M star, and a giant can be excluded, even for a 10 kpc distance. We therefore conclude that XTE J1817-330 is a low-mass X-ray binary.
From Figure 5 it is clear that the accretion disk model underestimates the U and UV emission of XTE J1817-330. Rykoff et al. (ryk07 (2007)) find the same with the optical monitor on board Swift. This indicates that the U and UV emission is not dominated by the viscous dissipation of the disk. Rykoff et al. (ryk07 (2007)) find, in addition, that the e-folding time of the NUV light curve is roughly twice that of the hard X-ray light curve, and they conclude that this is consistent with the optical and UV emission being dominated by reprocessed hard X-ray emission.
Acknowledgements.
XMM-Newton and INTEGRAL projects are ESA Science Missions with instruments and contributions directly funded by ESA Member States and the USA (NASA). Both are supported by BMWI/DLR (FKZ 50 OX 0001), the Max-Planck Society and the Heidenhain-Stiftung. We acknowledge the RXTE/ASM team for making quick-look results available for public use. GS acknowledges a postdoctoral fellowship of the Spanish Ministerio de Educación y Ciencia. EB is supported through DLR (FKZ 50 OR 0405).References
- (1) Cardelli, J.A., Clayton, G.C, & Mathis, J.S., 1989, ApJ, 345, 245
- (2) D’Avanzo, P., Goldoni, P., Covino, S. et al., 2006, ATel#724
- (3) de Vries, C.P., den Herder, J.W., Kaastra, J.S., et al. 2003, A&A, 404, 959
- (4) Chen, B. et al., 2004, OM Calibration Status, XMM-SOC-CAL-TN-0019
- (5) Dickey, J.M.& Lockman, F.J., 1990, ARA&A, 28, 215
- (6) Gierliński, M., Zdziarski, A.A., Poutanen, J, Coppi, P.S., Ebisawa, K, Johnson, W.N., 1999, MNRAS, 309, 496
- (7) Goldoni, P., Kuulkers, E., Rodriguez, J., Shaw, S.E., et al., 2006, ATel#742
- (8) Haberl, F., Sembay, S., Altieri, B., & Brinkmann, W, 2006, ESA SP-604, 353
- (9) Juett, A.M., Schulz, N.S. & Chakrabarty, D., 2004, ApJ, 612, 308
- (10) Kuster, M., Benlloch, S., Kendziorra, E. & Briel, U.G., 1999, SPIE, 3765, 673
- (11) Miller, J.M., Raymond, J., Fabian, A.C., et al., 2004, ApJ, 601, 450
- (12) Miller, J.M., Homan, J., Steeghs, D., Torres, M.A.P., & Wijnands, R., 2006a, ATel#743
- (13) Miller, J.M., Homan, J., Steeghs, D., & Wijnands, R., 2006b, ATel#746
- (14) Mitsuda, K., Inoue, H., Koyama, K., Makishima, K., et al., 1984, PASJ, 36, 741
- (15) Remillard, R., & McClintock, J., 2006, ARA&A, 44, 49
- (16) Remillard, R., Levinet, A., Morgan, E., Markwardt, C.,& Swank, J., 2006, ATel#714
- (17) Rupen, M., Dhawan, V., & Mioduszewski, A., 2006a, ATel#717
- (18) Rupen, M., Dhawan, V., & Mioduszewski, A., 2006b, ATel#721
- (19) Rykoff, E.S., Miller, J.M., Steeghs, D., & Torres, M.A.P., 2007, ApJ, accepted (arxiv:astro-ph/0703497).
- (20) Sala, G., Greiner, J., Vink, J., Haberl, F., Kendziorra. E., & Zhang, X.L., 2007, A&A, 461, 1049
- (21) Steeghs, D.,Torres, M.A.P., Miller, J., & Jonker, P.G., 2006, ATel#740
- (22) Tanaka, Y., & Lewin, W.H.G. 1995, in “X-ray Binaries”, eds. Lewin, van Paradijs & van den Heuvel, Cambridge University Press.
- (23) Titarchuk, L., 1994, ApJ, 434, 313
- (24) Torres, M.A.P., Steeghs, D., Jonker, P.G., Luhman, K., & McClintock, J.E., 2006, ATel#733
- (25) Turner, A.K., Fabian, A.C., Lee, J.C., & Vaughan, S, 2004, MNRAS, 353, 319
- (26) Verner, D.A., Ferland, G.J., Korista, K.T., & Yakovlev, D.G. 1996, ApJ, 465, 487
- (27) Wilms, J., Allen, A., & McCray, R., 2000, ApJ, 542, 914
- (28) Yao, Y. & Wang, Y.D., 2005, ApJ, 624, 751
- (29) Yao, Y. & Wang, Y.D., 2006, ApJ, 641, 930
- (30) Zombeck, M.V., 2007, Handbook of Space Astronomy and Astrophysics (Cambridge University Press, 2007, 3rd ed.)