Phase Diagram of CeCoIn5 in the Vicinity of as Determined by NMR
Abstract
We report 115In nuclear magnetic resonance (NMR) measurements in the heavy-fermion superconductor CeCoIn5 as a function of temperature in different magnetic fields applied parallel to the plane. The measurements probe a part of the phase diagram in the vicinity of the superconducting critical field where a possible inhomogeneous superconducting state, Fulde-Ferrel-Larkin-Ovchinnikov (FFLO), is stabilized. We have identified clear NMR signatures of two phase transitions occurring in this part of the phase diagram. The first order phase transitions are characterized by the sizable discontinuity of the shift. We find that a continuous second order phase transition from the superconducting to the FFLO state occurs at temperature below which the shift becomes temperature independent. We have compiled the first phase diagram of CeCoIn5 in the vicinity of from NMR data and found that it is in agreement with the one determined by thermodynamic measurements.
keywords:
FFLO; Vortex lattice; NMR; SuperconductivityPACS:
74.70.Tx, 76.60.Cq, 74.25.Dw, 71.27.+a, , , , , , ,
1 Introduction
Very soon after the development of the BCS theory there have been many efforts to go beyond conventional superconductivity investigating other possible superconducting phases. One of the most notable examples is the prediction of Fulde, Ferrell, Larkin, and Ovchinikov (FFLO) [1] of an unconventional superconducting state realized in the vicinity of the critical field . In general, superconductivity is suppressed in the presence of an applied magnetic field through two distinct physical mechanisms: one, the coupling of the magnetic field to the electronic orbital angular momentum which leads to the formation of a regular vortex array (Abrikosov vortex state); two, the Cooper pairs breaking caused by the Zeeman interaction between the field and the electron spins (Pauli paramagnetism). FFLO argued that when the Pauli pair breaking dominates over the orbital effects, the normal state is unstable with respect to the formation of a new type of electron pairs with non-zero center-of-mass momentum. Specifically, a pairing state with is stabilized reducing the Pauli paramagnetic effect. The appearance of the non-zero momentum breaks the spatial symmetry and, consequently, an inhomogeneous superconducting phase with order parameter that oscillates in real space emerges. It is striking that despite the early theoretical prediction of this exotic superconducting phase its commonly accepted experimental realization is yet to be observed.
Extensive efforts have been made to detect the FFLO state in materials so that the rich physics of the state can be explored. The material properties that are favorable to formation of the FFLO state include high purity (), large spin susceptibility favoring spin coupling to the applied field, and layered structure that inhibits electronic orbital motion for magnetic fields parallel to the conducting planes. Single crystals of CeCoIn5 are identified as good candidate for formation of the FFLO. Indeed, many experiments [2, 3, 4, 5] have identified a possible phase transition to a FFLO state. The phase transition is discerned within the Abrikosov superconducting (SC) state (henceforth referred to as SC state) in the vicinity of the .
Most experiments have focused on the detection of a phase transition between the SC and FFLO states and/or between the FFLO and normal states. However, direct evidence of the order parameter oscillation in the real space is still lacking and the nature of the new low temperature SC state thus remains to be elucidated. NMR appears to be the technique of choice for probing the microscopic nature of the state. However, clear signature of the transition to the FFLO state from SC state across continuous second order transition is still lacking. To address this issue we have performed extended measurements of the temperature dependence of the NMR shift throughout the high field part of the phase diagram.
Here we report 115In NMR measurements as a function of temperature in various applied magnetic fields in the vicinity of on a single crystal sample of CeCoIn5. The shift and the lineshape measurements probe the local spin susceptibility () and a local magnetic field map, respectively. By examining the temperature () dependence of the shift, we identify clear NMR signatures of two phase transitions at low temperatures and high magnetic fields. These are: the sizable discontinuity of the shift at the first order phase transition and onset of the temperature independence of the shift at the continuous second order phase transition from the superconducting to the FFLO state. Furthermore, we show that the phase transitions are accompanied by concomitant line broadening below the transition temperatures. We have compiled the phase diagram in the vicinity of and found it in agreement with the one determined by thermodynamic measurements [2].
2 Experimental Technique and the Sample
We have used high quality single crystals of CeCoIn5 grown by a flux method [6]. The In quadrupolar-split NMR satellite lines were used to infer that was aligned to better than 1∘ with respect to the sample’s plane. Here, the spectra of the axially symmetric 115In(1) site are reported. They were recorded using a custom built NMR spectrometer and obtained, at each given value of , from the sum of spin-echo Fourier transforms recorded at each 10 (or 20) KHz interval. The shift was determined by the diagonalization of the nuclear spin Hamiltonian including the quadrupolar effects. Pure magnetic contribution of the shift is obtained after subtracting independent orbital contribution of 0.13% to the shift.
The low temperature environment was provided by a 3He/4He dilution refrigerator. The RF coil was mounted into the mixing chamber of the refrigerator, ensuring good thermal contact. We used both the ‘top-tuning’ and fixed ‘bottom-tuning’ scheme. The ‘top-tuning’ scheme, in which the variable tuning delay line and matching capacitor were mounted outside the NMR probe, enabled us to span over a wide field/frequency range, while the ‘bottom-tuning’, in which a fixed capacitor was mounted in the mixing chamber near the coil, was used to assure improved signal-to-noise ratio. The sample was both zero-field and field-cooled. No notable influence of the sample cooling history on the NMR shift was detected. In order to avoid heating of the sample by RF pulses we used an RF excitation power much weaker than usual and repetition times of the order of a second to several seconds, depending on temperature.
3 Magnetic Shift
The temperature dependence of the shift at different applied fields is shown in Fig. 1.
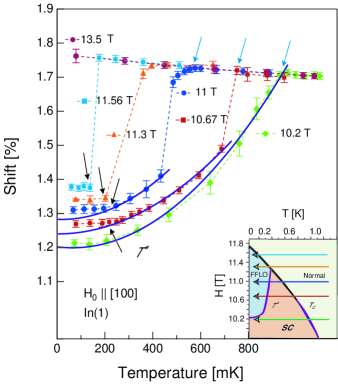
The region of the phase diagram that was scanned in these measurements is indicated by arrows in the inset to the figure. In fields ranging from 10.2 T to 12 T, the dependence of shift clearly reveals two phase transitions, at and , as indicated in Fig. 1 by the blue and black arrows, respectively. The shift is discontinuous across the first-order and varies smoothly across the second-order phase transitions [2]. Even though, the NMR measurements cannot a priori unambiguously determine the order of a phase transition, in this case the NMR shift correctly reveals the order. As was previously discussed [4], the phase transition at can be clearly associated with the transition to the uniform SC state. This conclusion comes from the observation of the strong loss of signal intensity due to RF shielding by SC currents.
Furthermore, three distinct temperature dependence of the shift are evident. Thus, the distinct variation of the shift can be interpreted as a signature of separate states stabilized in this part of the phase diagram. The normal state shift exhibits linear dependence and increases with decreasing temperature. In the SC state the temperature dependence of the shift, is expected to be quadratic, when [7, 8]. Indeed, the quadratic dependence is observed at 10.2 T, 10.67 T, and 11 T fields, as indicated by solid lines in Fig. 1. However, at 10.67 T and 11 T at low temperatures there is an obvious discrepancy, well outside the error bars, between data and the expected dependence in the SC state. We point out that the difference is particularly significant on the reduced scale as was shown in Ref. [4] Moreover, shift is temperature independent in this low temperature part of the phase diagram. We interpret this independence of as a signature of the FFLO state.
Two observations support our inference that the signature of the FFLO state is the independent shift. First, in T the transition from the normal to the FFLO state is expected to be of the first order as per specific heat measurements [2]. At T and 11.56 T, shift is temperature independent below the at which it discontinuously decreases from its normal state value. For T temperature independence of the shift onsets concomitantly with the departure from its expected behavior.
The independence of the shift supports the FFLO scenario for this phase as opposed to the magnetic one [5]. Obviously, the low temperature shift exhibits a strong field dependence. Therefore, in the magnetic scenario it would be hard to conciliate the fact that moments do not respond to temperature perturbation while the system is readily affected by the changes of .
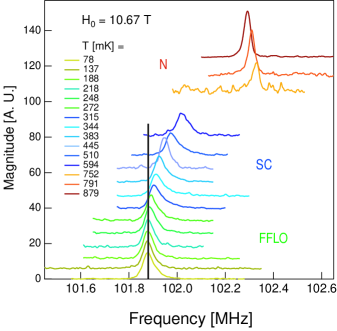
4 NMR Lineshape in the Possible FFLO State
To further address the issue of the NMR signature of the FFLO phase, we examine the NMR lineshape at 10.67 T whose temperature dependence is plotted in Fig. 2. The solid line in the figure indicates the frequency position corresponding to temperature independent shift in the FFLO state. Peak position of all green shaded spectra coincides with the line. Above mK, peak of the spectra shifts to higher frequencies with increasing temperature.
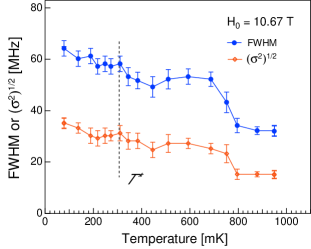
Let us now consider the dependence of the lineshape. The full width at the half maximum (FWHM) and square root of the second moment () of the spectra at 10.67 T are plotted in Fig. 3 as a function of . Since value determined from the dependence of the shift is less than , one expects that the broadening due to the vortex lattice should become temperature independent below . On the contrary, the second moment continuously increases, due to the entry in a new phase. Extra broadening in the FFLO phase is indeed expected due to the spatial modulation of magnetization in the phase. The absence of discontinuity of the second moment at is in agreement with a second order transition.
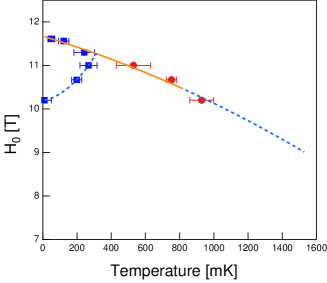
5 High field Low Temperature Phase Diagram as Determined by NMR
A phase diagram as determined by our NMR measurements is plotted in Fig. 4. It is in excellent agreement with the one determined by thermodynamic measurements of A. Bianchi et al. [2].
6 Summary
In conclusion, we measured the NMR spectra of In(1) in a single crystal sample of CeCoIn5 as a function of temperature in different magnetic fields, applied parallel to SC planes, in the vicinity of the upper critical field. Clear NMR signatures of two phase transitions at low temperatures and high magnetic fields are identified. The first order phase transitions are characterized by the sizable discontinuity of the shift. We find that a continuous second order phase transition from the superconducting to the FFLO state occurs at temperature below which the shift becomes temperature independent, i.e. the temperature dependence of the shifts departs from its characteristic behavior. Furthermore, we show that the phase transitions are accompanied by concomitant line broadening below the transition temperatures. We have compiled the first phase diagram of CeCoIn5 in the vicinity of from NMR measurements. The phase diagram is in very good agreement with the one determined by thermodynamic measurements.
7 Acknowledgement
We thank S. Krämer for his contribution. This research is supported in part by the funds from the National Science Foundation (DMR-0547938), Brown University, and the Grenoble High Magnetic Field Laboratory, under European Community contract RITA-CT-2003-505474.
References
- [1] P. Fulde and R.A. Ferrell, Phys. Rev. 135 (1964) A550; A.I. Larkin and Y.N. Ovchinnikov, Zh. Eksp. Teor. Fiz. 47 (1964) 1136.
- [2] A. Bianchi et al., Phys. Rev. Lett. 91 (2003) 187004.
- [3] C. Martin et al., Phys. Rev. B 71 (2005) 020503 .
- [4] V. F. Mitrović et al., Phys. Rev. Lett. 97 (2006) 117002.
- [5] B.-L. Young et al., Phys. Rev. Lett. 98 (2006) 036402.
- [6] Č. Petrović et al., J. Phys. Condens. Matt. 13 (2001) L337.
- [7] A. B. Vorontsov and M. J. Graf, cond-mat 0507479.
- [8] Kun Yang and S. L. Sondhi, Phys. Rev. B 57, 8566 (1998).