Permanent address: ] Department of Physics, Boston Univeristy, 590 Commonwealth Avenue, Boston, MA 02215
Coupling Between An Optical Phonon and the Kondo Effect
Abstract
We explore the ultra-fast optical response of Yb14MnSb11, providing further evidence that this Zintl compound is the first ferromagnetic, under-screened Kondo lattice. These experiments also provide the first demonstration of coupling between an optical phonon mode and the Kondo effect.
For over forty years, there has been significant interest in the screening of local moments by conduction electrons, termed the Kondo effect. Since its discovery,Kondo (1964) the Kondo effect has produced a number of surprising results, including heavy Fermion (HF) compounds where the carriers are extremely massive.Fisk et al. (1988) Kondo later proposed that the conduction electrons could also screen the motion of atoms,Kondo (1976) an effect that could also result in exotic behavior.Mitsumoto and Ono (2005); Yotsuhashi et al. (2005); Hotta (2006); Nayak et al. (2002) Despite extensive work on HF materials, there have been no observations of coupling between the Kondo effect and an optical phonon mode.
The lattice plays an important role in the 14-1-11 HF compounds, where numerous properties can be altered through iso-electronic substitutions. The 14-1-11 compounds exhibit numerous ground-states, including magnetic order, metallic or semiconducting transport,Chan et al. (1998); Fisher et al. (1999) and HF behaviorSales et al. (2005); Burch et al. (2005). Of particular interest is Yb14MnSb11, which is metallic and exhibits ferromagnetic order of the Mn d4 local moment below a Curie temperature (TC) of 53 K. A study of its optical conductivity suggested that the Mn d-shell has a fifth electron that is screened by the Kondo effect. It was argued that the coexistence of ferromagnetism and HF behavior occurs via a distortion of the MnSb4 tetrahedron;Burch et al. (2005) motivating us to search for Kondo-lattice coupling in Yb14MnSb11.
We demonstrate Kondo-phonon coupling in Yb14MnSb11 by simultaneously monitoring the electronic structure and phonon dynamics via ultra-fast optical experiments.Demsar et al. (2006); Merlin (1997) Specifically, the relaxation time and amplitude of the photo-induced response strongly increase at low temperatures (T), indicating the presence of a hybridization gap in Yb14MnSb11. Furthermore, a softening of a phonon at low T, is correlated with the development of this HF state.
The Yb14MnSb11 single crystals were grown as described elsewhere.Fisher et al. (1999); Chan et al. (1998) This compound has been well characterized by X-ray diffraction, magnetic susceptibility,Chan et al. (1998) electrical resistivity, optical conductivityBurch et al. (2005) specific-heat Fisher et al. (1999) and X-Ray Magneto Circular DichroismHolm et al. (2002). The sample in this study provided mirror like surfaces and therefore time-domain measurements were performed on the as-grown sample. The ultra-fast experiments were conducted with a cavity dumped laser producing pulse centered at with a repetition rate. Comparable results were obtained with a 250 KHz regenerative amplifier (, ) coupled to a superconducting magnet, which was used to investigate the effects of magnetic field and fluence. The pump-pulse was kept at a fluence of .
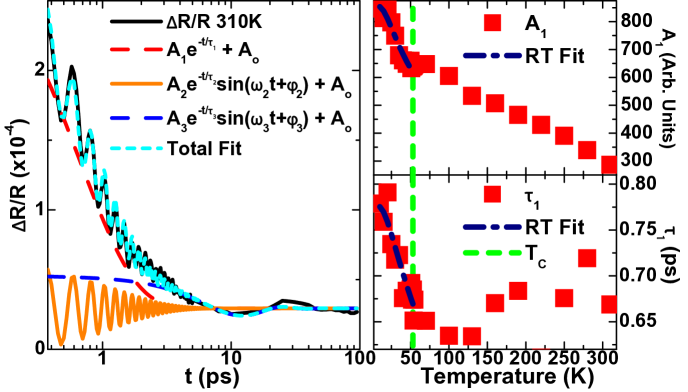
In the left panel of Fig. 1 we plot the photo-induced change in the reflectivity () as function of time with the sample at 310 K. After the pump pulse arrives an increase in indicates a rise in the temperature of the Fermi surfaceBurch et al. (2005) as electron-electron interactions bring the optically excited carriers into equilibrium.Groeneveld et al. (1995) We then observe an exponential decay and two exponentially damped oscillatory signals. The exponential decay can be attributed to the carrier and phonon baths coming into thermal equilibrium.Groeneveld et al. (1995)
To quantitatively evaluate our results we have fit the data at all temperatures to the formula:
| (1) |
The resulting and are shown in the right panels of Fig. 1. For , and follow our expectations for a normal metal. Specifically is mostly temperature independent, while the smaller relative change in T after photo-excitation results in a reduction of as the temperature is raised.Groeneveld et al. (1995) However, the decay time and amplitude increase significantly below . Similar enhancements in the and A at low temperatures have been observed in superconductorsAveritt et al. (2001); Kaindl et al. (2000); Kabanov et al. (1999) and HF compounds.Demsar et al. (2006) This low T increase is believed to indicate the opening of a gap () in the density of states. Specifically, due to the presence of a gap, the carriers can only relax via emission of high frequency phonons with energy . Since the probability for optical phonons to decay into two phonons of lower energy is fairly small (as opposed to acoustic modes that are much more susceptible to anharmonic effects), it is highly likely that the optical phonon will excite a new electron-hole pair across the gap. This phonon bottleneck significantly reduces the transmission of heat from the Fermi surface to the lattice, resulting in an increase in and A when .
The model of Rothwarf and Taylor (RT) has been very successful in describing the dynamics of superconductors and HF compounds.Rothwarf and Taylor (1967) In the RT approach the quasi-particle and phonon dynamics are described via a set of coupled nonlinear differential equations. The RT equations account for the creation and destruction of electron hole pairs via emission of high frequency phonons and bi-particle scattering as well as a reduction in the number of high frequency phonons via diffusion and anharmonic decay. Recently the RT model has been solved in a variety of cases leading to the solution:Kabanov et al. (2005)
| (2) |
| (3) |
where is the population of the thermally excited quasi-particles. The results of simultaneously fitting and with eqs. 2 & 3 are displayed in the right panels of Fig. 1. In performing these fits we used a standard form for the thermally excited quasi-particle density: , where depends on the shape of the density of states. Similar to what has been observed in many HF compoundsDemsar et al. (2006), we found and a temperature independent gap of . Interestingly, previous studies of the optical conductivity have found .Burch et al. (2005) However optical conducitivty probes the direct hybridization gap (ie: no change in momentum), whereas the present results are governed by the indirect gap, which should be smaller.Coleman and Schofield (2005); Cox and Grewe (1988); Millis and Lee (1987) Lastly, the application of a 6 T magnetic field, saturating the magnetization (M(T)), did not effect at either 10 K or TC, providing further evidence that the gap is unrelated to the ferromagnetism.
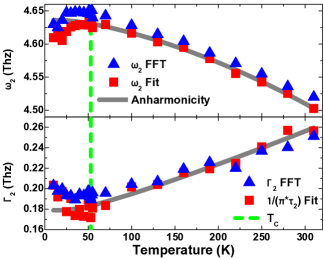
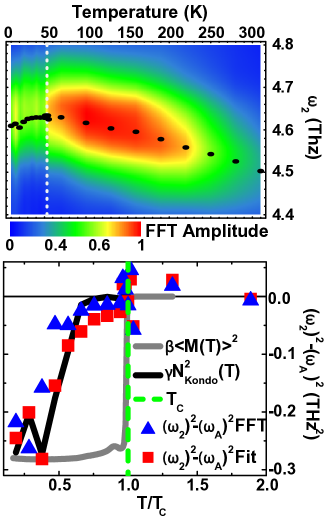
So far we have focused on the relaxation dynamics of the electronic system. However the data displayed in Fig. 1 also contains information about an optical phonon mode. Specifically, the oscillations in the data result from the coherent generation of phonons. While there are a variety of proposed mechanisms, it is generally agreed believed that such oscillations are initiated via a Raman process upon pump-pulse excitation. The optical mode is then observed via a Raman shift of the probe pulse.Merlin (1997) The oscillatory signal exponentially decays due to the de-phasing of the optical modes. As shown in Fig. 2, as the temperature is lowered, the optical mode frequency () increases while its decay rate () decreases. Whereas for , the phonon softens and broadens. As discussed later, this low temperature behavior is quite anomalous. Therefore, to confirm that this behavior is intrinsic to the sample and not an artifact of our fitting routine, we subtracted the first term of eq. 1 from the data and then performed a fast-Fourier transform (FFT). The FFT spectra in the top panel of Fig. 3 reveal the same trends shown in Fig. 2. The center frequency and broadening determined from fits of the FFT data with Lorentzian line-shapes are in superb agreement with the results of fitting (see Fig. 2).
The temperature dependence of the phonon above TC is similar to anharmonic effects observed in numerous other materials. Specifically, the optical phonon can decay into acoustic modes of lower energy, resulting in a re-normlization of its self-energy. Since the likelihood of this decay depends on the occupancy of the phonon density of states, one expects a T dependence of the form:
| (4) | |||||
| (5) | |||||
where is the intrinsic frequency from harmonic terms, is the Bose occupation function and we have assumed the phonon decays into two modes of frequency or three of frequency .Menéndez and Cardona (1984); Balkanski et al. (1983); Hart et al. (1970) As shown in Fig. 2, eqs. 4 and 5 describe and well. Furthermore the values of ,, , are comparable to what has been observed in Si.Menéndez and Cardona (1984); Balkanski et al. (1983); Hart et al. (1970) Nonetheless this does not explain the T-dependence of the phonon mode below .
| 4.65 Thz | A0 | 857 | |
|---|---|---|---|
| .17 Thz | 0.006 Thz | ||
| 2.78 | 4.94 | ||
| 3.85 | 0 | ||
| -3.49 | 46 K (32 cm-1) | ||
| -2.49 | p | 0.49 |
We now explore the origin of the behavior of the optical phonon, via the potential energy (U) for atomic displacements from equilibrium (x). The potential energy should have a form: M, where includes the anharmonic and harmonic terms (ie: ), E is the energy gained from the formation of the ferromagnetic state and M(T) . Solving for the T dependence of the phonon frequency:
| (6) |
Assuming is independent of x, we expect M(T).Matsushita (1976); Lockwood et al. (1983); Wakamura (1989) However, in Fig. 3 we observe that the phonon continues to soften down to the lowest T, whereas M(T) determined via zero-field cooled SQUID measurements, saturates close to TC.
While we only considered the effect of ferromagnetic order on the phonon, the approach outlined above can be generalized to any interaction in the system whose strength depends on x. Since the binding energy of the Kondo singlets will depend on the hybridization between the Mn and Sb, we can replace E by the Kondo binding energy (TK) and M by the relative number of singlets N. Next we estimate the number of Kondo singlets via the density of quasi-particles excited across the hybridization gap: . Consistent with the Kondo-phonon coupling theory outlined above we find (see Fig. 3).
The fact that we observe strong coupling of the optical phonon to the formation of Kondo singlets and not to the ferromagnetic state, may not be surprising for three reasons. First, T KSales et al. (2005); Burch et al. (2005) is much bigger than T K. Second, T whereas E, where J is the exchange between the carriers and the local moments and is the density of states at the Fermi energy.Doniach (1977) This implies that TK has greater sensitivity to atomic displacements than EFM. Finally, we note that the scenario proposed in ref. Burch et al., 2005 for the under-screened Kondo effect in Yb14MnSb11, required a distortion of the MnSb4 tetrahedron in order to break the degeneracy of the d5 electrons. Therefore one would expect a coupling between the lattice and the Kondo effect.
In conclusion, we explored the ultra-fast optical properties of Yb14MnSb11. Significant changes in the dynamics occur below , although they are not connected with the development of the ferromagnetic state. In particular, the amplitude and relaxation time of the electronic response grows significantly at low temperatures, but is not effected by the application of a magnetic field. Furthermore, changes in the frequency of the optical phonon are inconsistent with the temperature dependence of the magnitization. Instead we find that the low temperature enhancement of the photo-induced response and the softening of the phonon result from the development of heavy Fermions and their coupling to the lattice. As expected for a hybridization gap, quantitative analysis reveals the indirect gap probed here is smaller in magnitude than the direct gap determined via optical conductivity experimentsBurch et al. (2005). In addition, the softening of the phonon at low temperatures is correlated with the number of heavy quasi-particles. This is therefore the first demonstration of coupling between the Kondo effect and optical modes.
This work was supported by the DOE and NSF. Oak Ridge National Laboratory is managed by UT-Battelle, LLC, for the U.S. Dept. of Energy under contract DE-AC05-00OR22725. We are grateful for discussions with S. Dordevic, I. Martin, R. Merlin, S. Trugman, and Jian-Xin Zhu.
References
- Kondo (1964) J. Kondo, Progress of theoretical physics 32, 37 (1964).
- Fisk et al. (1988) Z. Fisk, D. W. Hess, C. J. Petchick, D. Pines, J. L. Smith, J. D. Thompson, and J. O. Willis, Science 239, 33 (1988).
- Kondo (1976) J. Kondo, Physica B + C 84B+C, 40 (1976).
- Mitsumoto and Ono (2005) K. Mitsumoto and Y. Ono, Physica. C, Superconductivity 426-431, 330 (2005).
- Yotsuhashi et al. (2005) S. Yotsuhashi, M. Kojima, H. Kusunose, and K. Miyake, Journal of the Physical Society of Japan 74, 49 (2005).
- Hotta (2006) T. Hotta, Phys. Rev. Lett. 96, 197201 (2006).
- Nayak et al. (2002) P. Nayak, B. Ojha, S. Mohanty, and S. N. Behera, IJMP B 16, 3595 (2002).
- Demsar et al. (2006) J. Demsar, J. L. Sarrao, and A. J. Taylor, J. Phys. Cond. Mat. 18, R281 (2006).
- Merlin (1997) R. Merlin, Solid State Communications 102, 207 (1997).
- Chan et al. (1998) J. Chan, M. Olmstead, S. Kauzlarich, and D. Webb, Chem. Mat. 10, 3583 (1998).
- Fisher et al. (1999) I. R. Fisher, T. A. Wiener, S. L. Bud’ko, P. C. Canfield, J. Y. Chan, and S. M. Kauzlarich, Phys. Rev. B 59, 13829 (1999).
- Sales et al. (2005) B. C. Sales, P. Khalifah, T. P. Enck, E. J. Nagler, R. E. Sykora, R. Jin, and D. Mandrus, Phys. Rev. B 72 (2005).
- Burch et al. (2005) K. S. Burch, A. Schafgans, N. P. Butch, T. A. Sayles, M. B. Maple, B. C. Sales, D. Mandrus, and D. N. Basov, Phys. Rev. Lett. 95, 046401 (2005).
- Holm et al. (2002) A. Holm, S. Kauzlarich, S. Morton, G. Waddill, W. Pickett, and J. Tobin, JACS 124, 9894 (2002).
- Groeneveld et al. (1995) R. H. M. Groeneveld, R. Sprik, and A. Lagendijk, Phys. Rev. B 51, 11433 (1995).
- Averitt et al. (2001) R. D. Averitt, G. Rodriguez, A. I. Lobad, J. L. W. Siders, S. A. Trugman, and A. J. Taylor, Phys. Rev. B 63, 140502 (2001).
- Kaindl et al. (2000) R. A. Kaindl, M. Woerner, T. Elsaesser, D. C. Smith, J. F. Ryan, G. A. Farnan, M. P. McCurry, and D. G. Walmsley, Science 287, 470 (2000).
- Kabanov et al. (1999) V. V. Kabanov, J. Demsar, B. Podobnik, and D. Mihailovic, Phys. Rev. B 59, 1497 (1999).
- Rothwarf and Taylor (1967) A. Rothwarf and B. N. Taylor, Phys. Rev. Lett. 19, 27 (1967).
- Kabanov et al. (2005) V. V. Kabanov, J. Demsar, and D. Mihailovic, Physical Review Letters 95, 147002 (2005).
- Coleman and Schofield (2005) P. Coleman and A. J. Schofield, Nature 433, 226 (2005).
- Cox and Grewe (1988) D. L. Cox and N. Grewe, Z. Phys. B 71, 321 (1988).
- Millis and Lee (1987) A. J. Millis and P. Lee, Phys. Rev. B 35, 3394 (1987).
- Menéndez and Cardona (1984) J. Menéndez and M. Cardona, Phys. Rev. B 29, 2051 (1984).
- Balkanski et al. (1983) M. Balkanski, R. F. Wallis, and E. Haro, Phys. Rev. B 28, 1928 (1983).
- Hart et al. (1970) T. R. Hart, R. L. Aggarwal, and B. Lax, Phys. Rev. B 1, 638 (1970).
- Matsushita (1976) M. Matsushita, J. Chem. Phys. 65, 23 (1976).
- Lockwood et al. (1983) D. J. Lockwood, R. S. Katiyar, and V. C. Y. So, Phys. Rev. B 28, 1983 (1983).
- Wakamura (1989) K. Wakamura, Sol. St. Comm. 71, 1033 (1989).
- Doniach (1977) S. Doniach, Physica B + C 91B+C, 231 (1977).