Deep optical observations of the interaction of the SS 433 microquasar jet with the W 50 radio continuum shell.
Abstract
Four mosaics of deep, continuum–subtracted, CCD images have been obtained over the extensive galactic radio continuum shell, W 50, which surrounds the remarkable stellar system SS 433. Two of these mosaics in the H[N ii] and [O iii] 5007 Å emission lines respectively cover a field of which contains all of W 50 but at a low angular resolution of 5 arcsec. The third and fourth mosaics cover the eastern (in [O iii] 5007 Å) and western (in H[N ii] 6548 & 6584 Å) filamentary nebulosity respectively but at an angular resolution of 1 arcsec. These observations are supplemented by new low dispersion spectra and longslit, spatially resolved echelle spectra. The [O iii] 5007 Å images show for the first time the distribution of this emission in both the eastern and western filaments while new H[N ii] emission features are also found in both of these regions. Approaching flows of faintly emitting material from the bright eastern filaments of up 100 km s-1 in radial velocity are detected. The present observations also suggest that the heliocentric systemic radial velocity of the whole system is 56 2 km s-1. Furthermore, very deep imagery and high resolution spectroscopy of a small part of the northern radio ridge of W 50 has revealed for the first time the very faint optical nebulosity associated with this edge. It is suggested that patchy foreground dust along the 5 kpc sightline is inhibiting the detection of all of the optical nebulosity associated with W 50. The interaction of the microquasar jets of SS 433 with the W 50 shell is discussed.
keywords:
ISM: general – ISM: supernova remnants – ISM: individual: G 39.72.0 (W 50).1 Introduction
Most of the galactic supernova remnants (SNRs) have been identified by their radio, optical and X–ray emission (Green, 2006). G 39.72.0 (W 50) was identified in radio wavelengths by Westerhout (1958) and first classified as an evolved SNR by Holden & Caswell (1969). Its radio continuum image has a complex ‘seashell’ appearance showing a main spherical shell of non–thermal emission (58 arcmin in diameter) with easterly and westerly extensions or lobes. The radio spectral index varies across the eastern, central and western areas between values of 0.4 to 0.7 and the total flux densities are 71 Jy and 160 Jy at 1465 and 327 GHz, respectively (Dubner et al., 1998). The latter authors also presented the latest Hi observations showing some evidence of an interaction between W 50 and its surrounding interstellar medium (ISM) at a velocity 76 km s-1 while a distance to W 50 of 3 kpc was also calculated. This simple SNR interpretation of W 50 is complicated by the presence at its centre of the remarkable stellar binary system SS 433 (see Fabrika 2004 for a comprehensive review) from which emission is ejected in two oppositely directed relativistic jets aligned along the same axis as the elongation of the radio lobes (see also fig.2; Dubner 2002). The two jets are also X–ray emitters (Brinkmann, Aschenbach & Kawai 1996; Safi-Harb & Ögelman 1997) showing different morphological and spectral properties. These X–ray and IRAS (Band, 1987) observations suggest that the interaction of SS 433 jets with the surrounding ISM plays an important role in the shaping of the envelope. Stirling et al. (2002) measured the distance to the jet of SS 433, hence W 50, from radio proper–motion measurements, as 4.61 0.35 kpc and Blundell & Bowler (2004) give 5.5 0.2 kpc. Here we will adopt a distance of 5 kpc.
Optical emission was first discovered by both van den Bergh (1980) and Zealey, Dopita & Malin (1980) who found two groups of faint filaments, one east and one west of SS 433 at a distance of 30 arcmin from it. Spectroscopic observations (Kirshner & Chevalier 1980; Murdin & Clark 1980; Shuder et al. 1980) show that all the optical filaments originated from shock–heated gas since the [S ii]/H2 while very strong [N ii] ([N ii] 6584 Å/H3) emission is also present. Faint [O iii] 5007 Å emission was also detected in these spectra ([O iii] 5007 Å/H0.4) but only from the eastern filaments. Mazeh et al. (1983) presented high spectral but low angular (with 120 arcsec & 200 arcsec beam diameters) resolution profiles of the [N ii] 6584 Å line from both the eastern and western optical filaments of W 50. These profiles have a complex structure and are broad (50 km s-1) and see Sect. 3.3 for further details and comparison with new line profiles.
A large number of papers have been published (see the review of Fabrika 2004 and references therein) concerning the association of W 50 with SS 433. A consensus is emerging that the SS 433 jets have punched holes in a preceding, expanding supernova shell (e.g. Velázquez & Raga 2000) though the formation of the whole structure of W 50 by the jets alone has not been completely ruled out (Fabrika 2004).
In the present paper, the first continuum–subtracted, deep CCD images of the total area of W 50 in the light of H[N ii] and [O iii] 5007 Å are presented in a mosaic which covers an area of . The major eastern and western regions of nebulosity are also imaged at higher angular resolution in the [O iii] 5007 Å and H[N ii] 6548 & 6584 Å lines respectively to reveal the fine structure of the optical filaments. Furthermore, a very deep H[N ii] 6548 & 6584 Å image of a small region of the northern ridge of radio emission has been obtained in an attempt to detect hitherto undiscovered filamentary nebulosity that would be expected if the W 50 radio shell is a supernova remnant.
The new, faint, optical emission found over W 50, together, with its comparison with a high resolution radio map, permits a better appreciation of the morphology of W 50 and its interaction with the jets of SS 433. In addition, new, deep, low–resolution and spatially–resolved, high–resolution spectra of this optical nebulosity have been obtained to advance the understanding of this interaction.
2 Observations & Results
A summary and log of our imaging and spectral observations is provided in Table 1. In the sections below, we describe the details of these observations.
2.1 Imaging
2.1.1 Wide field imagery
The wide–field imagery was taken with the 0.3 m Schmidt–Cassegrain (f/3.2) telescope at Skinakas Observatory in Crete, Greece from 27 to 30 June, 2003. A 1024 1024 SITe CCD was used which has a pixel size of 24 m resulting in a 89 89 arcmin2 field of view and an image scale of 5 arcsec per pixel.
Each of four different fields was observed for 2400 s in both filters while corresponding continuum images were also observed (180 s each) and were subtracted from those containing the emission lines to eliminate the confusing star field (see Boumis et al. 2002 for details of this technique). All fields were projected on to a common origin on the sky and were subsequently combined to create the final mosaics in H[N ii] and [O iii] 5007 Å. During the observations the ‘seeing’ varied between 0.8 to 1.2 arcsec. The image reduction was carried out using the IRAF and STARLINK packages. The astrometric solutions were calculated for each field using reference stars from the Hubble Space Telescope (HST) Guide Star Catalogue (Lasker, Russel & Jenkner, 1999). All coordinates quoted in this paper refer to epoch 2000.
The images of the nebulosity in all of the fields considered here are detected, at most, only a few times greater than the residual noise level. In these circumstances we have always chosen to display the data with a linear scale, but negatively, and at high contrast. Also we have chosen not to suppress the noise artificially, e.g. by excessive smoothing or lifting the zero level, for this often leads to detection artefacts being confused in the resultant display with real nebulous features.
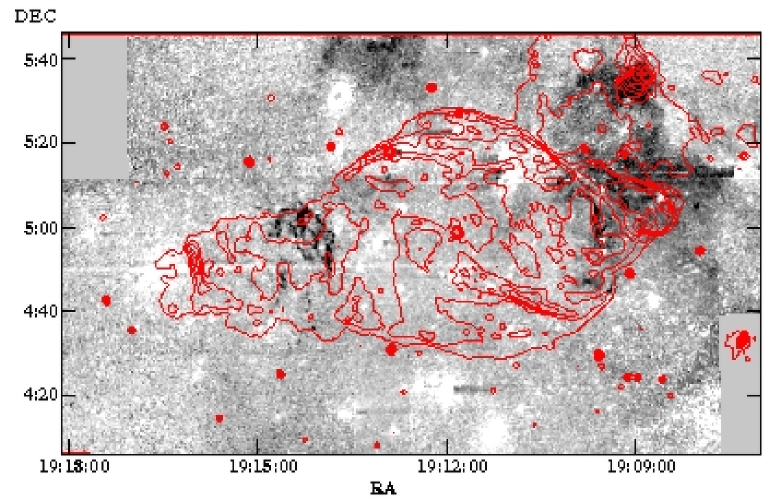
The image of W 50 with this system is shown in Fig. 1. This is a mosaic of four images taken through the H[N ii] filter. The same field was observed with the [O iii] 5007 Å emission line filter. Dubner (2002) and Dubner et al. (1998) using their high resolution radio map of W 50 made a comparison between the radio/X–ray/Hi emission. These radio continuum contours (Dubner et al. 1998) are compared in Fig. 1 with this new mosaic of H[N ii] images.
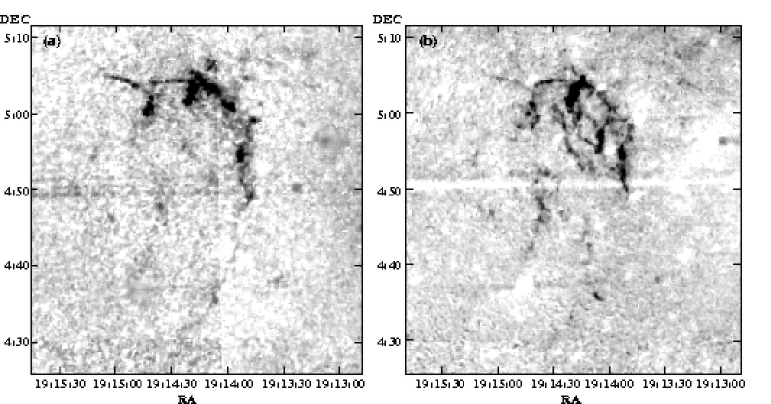
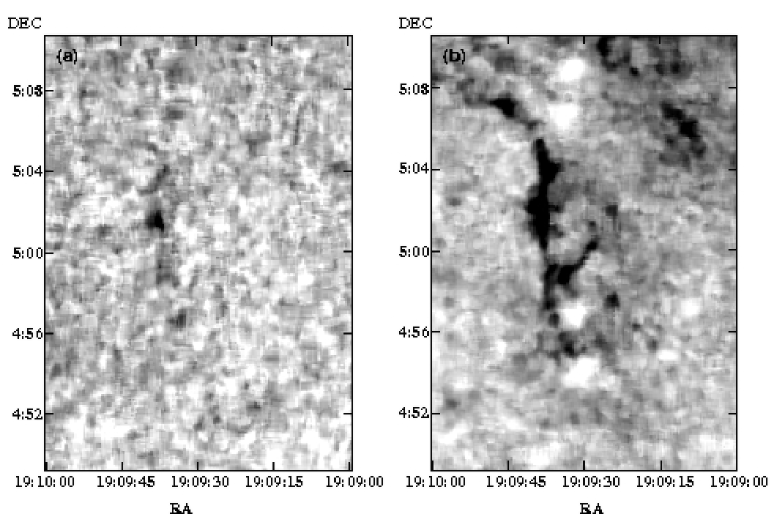
Selected areas of the eastern and western filaments seen in Fig. 1 are shown respectively in Figs. 2a & b and 3a & b in the light of [O iii] 5007 Å and H[N ii]. For the first time, deep, continuum–subtracted, CCD images in the light of H[N ii] and [O iii] 5007 Å of W 50 have been obtained. The H[N ii] mosaic of images in Fig. 1 shows new filamentary and diffuse emission while, for the first time, [O iii] 5007 Å filamentary emission from W 50 is revealed. The most striking features are the differences in the filamentary nebulosities in Figs. 2a & b. The [O iii] 5007 Å emission in Fig. 2a forms a 24 arcmin long outer arc as far as 19h14m30s, 4°30′ which contains the predominantly [N ii] 6584 Å (see Sect. 2.2.1) emitting filaments. This eastern filamentary arc is convex with respect to SS 433 whereas the [N ii] 6584 Å emitting western filamentary arc in Figs. 3a & b is concave and only has very localised [O iii] 5007 Å emitting counterparts.
Diffuse H[N ii] is present to the north–east ( 19h13m05s, 5°08′00″) and north–west ( 19h11m30s, 5°12′00″)of the main, circular radio remnant of W 50 in Fig. 1. It is also present within its western radio lobe and the possibility that it belongs to the remnant cannot be ruled out. The weak diffuse emission which is present north of W 50 ( 19h13m05s, 5°43′00″) and to the north–west (the bright, extended nebula LBN 109; Lynds 1965) is outside W 50’s radio borders and not associated with the remnant.
2.1.2 High resolution imagery of the eastern and western filaments
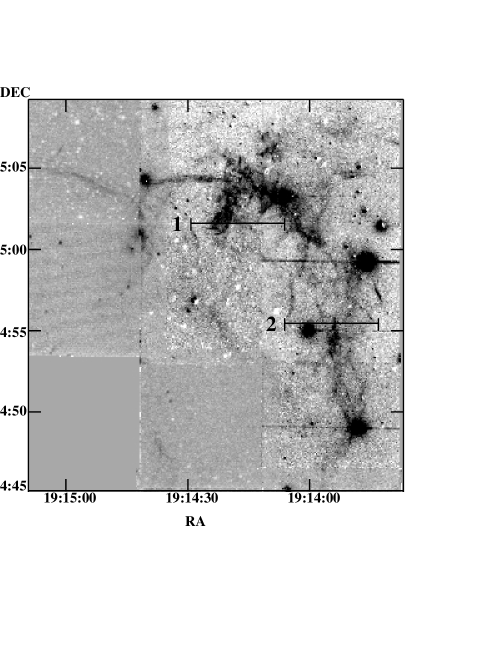
Optical images at higher angular resolution of the eastern and western filaments were also obtained with the 1.3 m (f/7.7) Ritchey-Cretien telescope at Skinakas Observatory during 2005 in September 5, 9–10 and 2006 in July 27–28 using an [O iii] 5007 Å and an H[N ii] interference filters, respectively. The detector was a 10241024 SITe CCD with a field of view of 8.5 8.5 arcmin2. Ten exposures through the [O iii] 5007 Å filter each of 2400 s duration and ten corresponding exposures in the continuum, each of 180 s, were taken of the eastern filaments, and similarly two H[N ii] 6548 & 6584 Å and continuum images of the western filaments were obtained. The continuum subtracted mosaics of these images are shown in Fig. 4 & 5 respectively. The fine filamentary nature of the eastern nebulosity is revealed in Figs. 4 & 5. At a distance of 5 kpc the finest [O iii] 5007 Å filaments are 7 1016cm ( 1″) wide.
2.1.3 Deep, high resolution imagery of the northern radio ridge
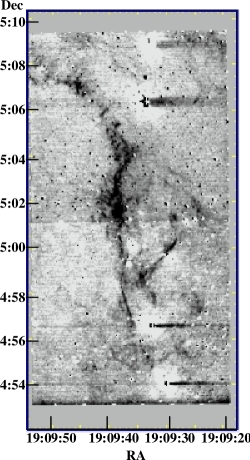
The H[N ii] 6548 & 6584 Å image in Fig. 6 was obtained on the 1 May 2003 on one position of the extensive northern ridge of radio emission (Dubner et al. 1998 and shown here in Fig. 1). For this purpose the Manchester echelle spectrometer (MES–SPM; Meaburn et al. 1984, 2003) in its imaging mode was combined with the 2.1–m San Pedro Martir (Mexico) telescope (see Sect 2.2.2 for plate scale). The integration time was 2400 s and a SITe CCD (22 binned) was the detector. Faint nebular filaments parallel to the radio ridge, can be seen for the first time. No star subtraction was possible in this case for a continuum image was not obtained.
2.2 Spectroscopy
2.2.1 Low dispersion - eastern and western filaments
Low dispersion long–slit spectra were obtained with the 1.3 m telescope at Skinakas Observatory in June 14, 2004 and September 6–7, 2005. The 1300 line mm-1 grating was used in conjunction with a 2000800 SITe CCD (1515 m2 pixels) resulting in a scale of 1 Å pixel-1 and covers the range of 4750 Å – 6815 Å. The spectral resolution is 8 pixels and 11 pixels full width at half maximum (fwhm) for the red and blue wavelengths, respectively. The slit width is 7.7 arcsec and in all cases was oriented in the south–north direction; the slit length is 7.9 arcmin. The spectrophotometric standard stars HR5501, HR7596, HR9087, HR718, and HR7950 (Hamuy et al., 1994) were observed to calibrate the spectra.
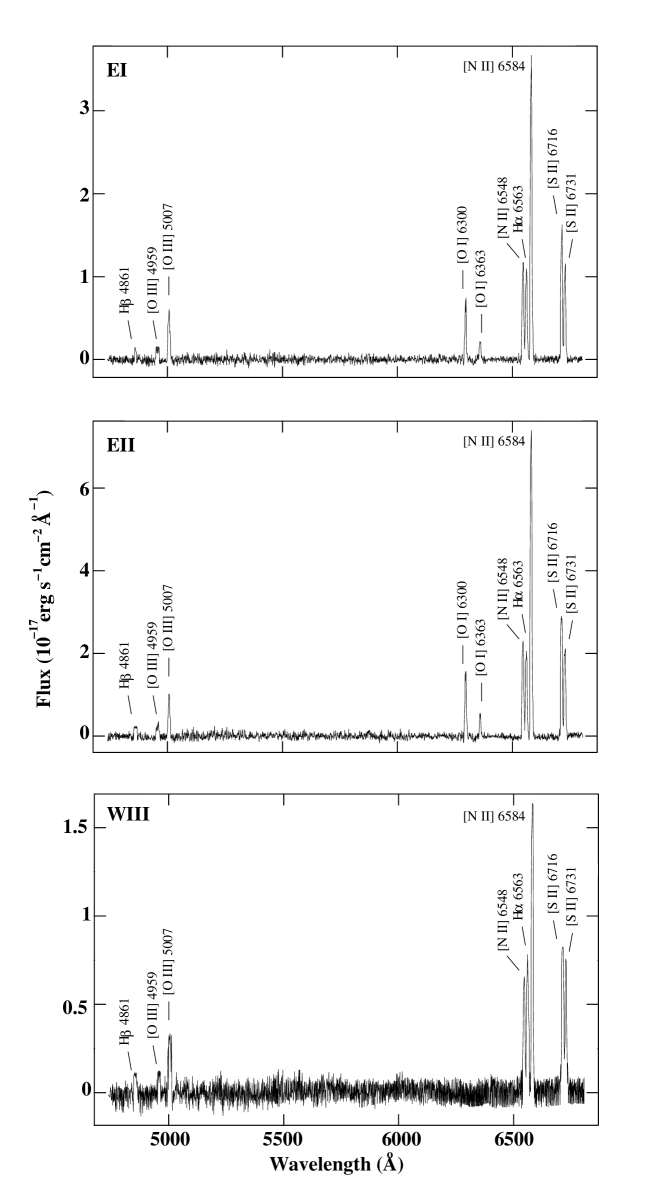
The deep low resolution spectra were taken on the relatively bright optical filament in the eastern and western parts of W 50 (their exact positions are given in Table 1). In Table 2, we present the relative line fluxes taken from three different apertures (I, II and III) along each slit. In particular, apertures I, II and III have an offset (see Table 1) north or south of the slit centre which were selected because they are free of field stars in an otherwise crowded field and they include sufficient line emission to permit an accurate determination of the observed line fluxes. The background extraction aperture was taken towards the northern end or the southern ends of the slits depending on the slit position. The signal to noise ratios presented in Table 2 do not include calibration errors, which are less than 10 percent. Typical spectra from the eastern and western filaments are shown in Fig. 7.
Interstellar reddening was derived from the H/H ratio (Osterbrock, 1989), using the interstellar extinction law by Fitzpatrick (1999) and R. Therefore, the interstellar logarithmic extinction coefficient c(H) can be derived by using the relationship
| (1) |
where, 0.348 is the relative logarithmic extinction coefficient for H/H and 2.85 the theoretical value of F(H)/F(H). Here we have used the ratio of 2.85 though Hartigan et al. (1987) suggests 3.0 which could be more appropriate when some collisional excitation is present. The observational reddening in magnitude EB-V was also calculated using the relationship (Seaton, 1979)
| (2) |
where the extinction parameter X 3.615 (Fitzpatrick, 1999).
The errors on the measurements of c(H) and EB-V were calculated through standard error propagation of equations (1) and (2). Consequently, c was found to be between 0.53 and 2.00 (to give AV of 1.1 to 4.2) and EB-V between 0.4 and 1.4.
2.2.2 High dispersion - eastern and western filaments
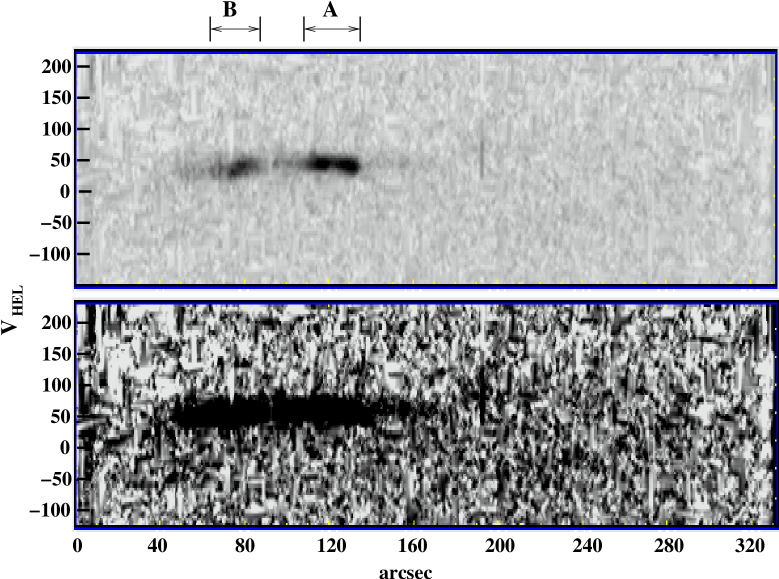
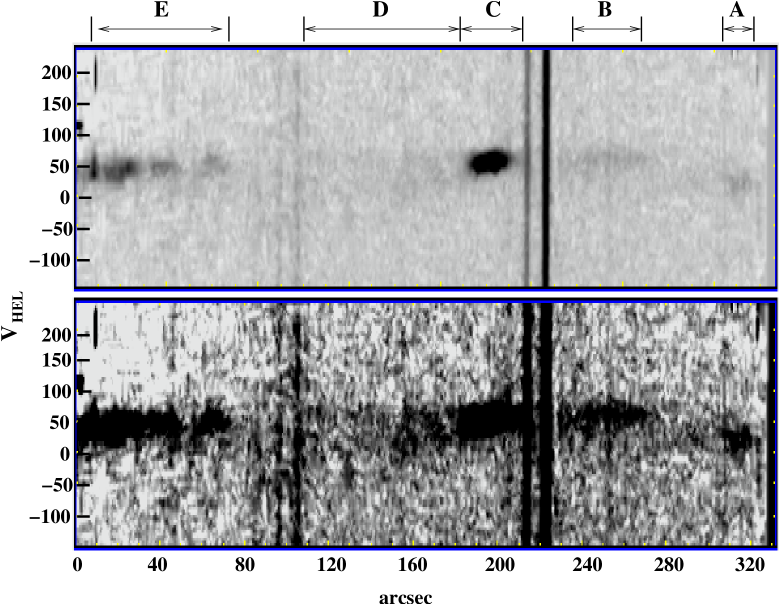
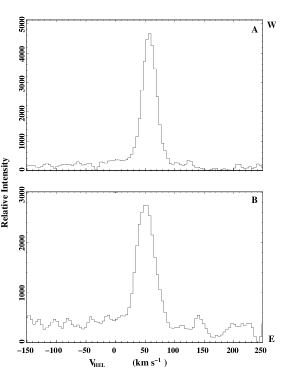
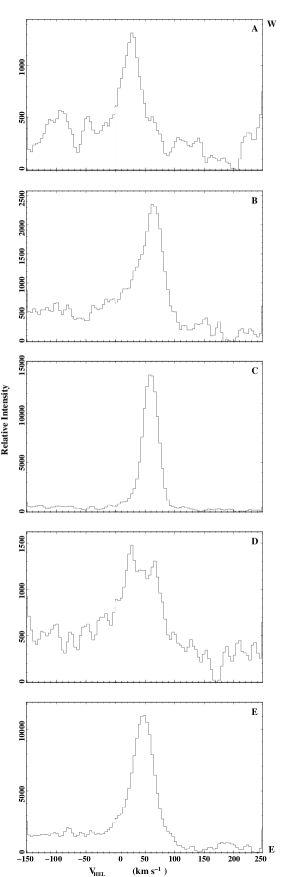
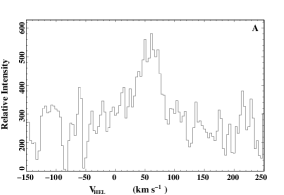
Spatially resolved, longslit spectra were obtained of the eastern filamentary nebulosity on 2–4 August, 2005 with the Manchester echelle spectrometer (MES–SPM; Meaburn et al. 1984, 2003) combined with the 2.1–m San Pedro Martir (Mexico) telescope. The slit, orientated EW, was 300 m wide ( 3.9 arcsec and 20 km s-1). The 512 increments of the 22 binned SITe CCD detector, each 0.624 arcsec long, give a total projected slit length of 5.32 arcmin on the sky. In this spectroscopic mode MES–SPM has no cross–dispersion consequently, for the present observations, a filter of 90-Å bandwidth was used to isolate the 87th echelle order containing the H and [N ii] 6548, 6584 Å nebular emission lines. Integration of 1800 s and 3600 s were obtained respectively for slit positions 1 and 2 marked in Fig. 4. The position–velocity (pv) arrays of [N ii] 6584 Å line profiles from slit positions 1 & 2 are shown in Figs. 8 & 9 respectively. The [N ii] 6584 Å line profiles from the incremental lengths marked in Figs. 8 & 9 are shown in Figs. 10 & 11 respectively.
It can be seen in Figs. 7–11 that the brightest filaments (section A in Figs. 8 & 10 and section C in Figs. 9 & 11) emit 22 km s-1 wide profiles when corrected for instrumental broadening, both centered on = 56 km s-1. This value is significantly different from 40 which is the mean of the estimation of 28 km s-1 from the Hi measurements of Dubner et al. (1998) and 52 km s-1 from optical profiles of the eastern and western filaments (Figs 2 & 3) given by Mazeh et al (1983). In the present paper it has been assumed that for W 50, = - 14.3 km s-1.
However, the fainter [N ii] 6584 Å emitting regions between the bright eastern filaments exhibit approaching radial velocities of up to 100 km s-1 with respect to = 56 km s-1. These faint but extensive high–speed regions are particularly prominent for the sections D and B in Fig. 9 whose profiles are shown in Fig. 11.
These high dispersion spectral observations of the eastern filamentary nebulosity were obtained in non-photometric conditions and were not therefore compared photometrically with a standard star.
2.2.3 High dispersion – northern ridge
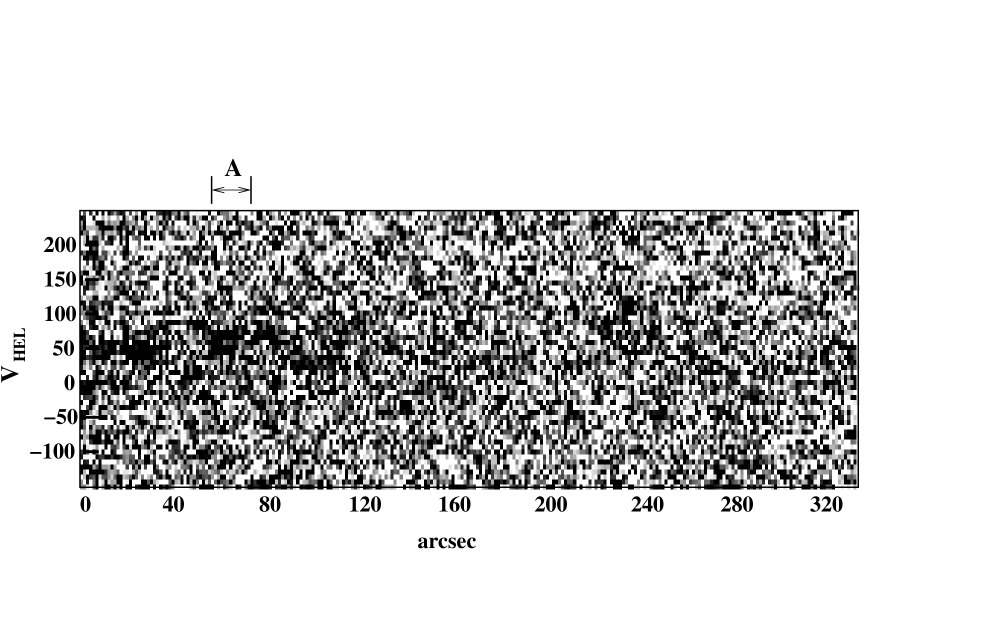
Nearly the same instrumental setup and data analysis as described in Sect. 2.2.2 was employed on 1 May 2003 for the longslit spectroscopy of the northern nebulosity shown in Fig. 6. Here the slit was now 150 m wide ( 1.9 arcsec and 9 km s-1), orientated NS and centred on RA 19h 11m 00.72s, DEC 05∘ 19 16 (J2000). The integration time was 4200 s. The position velocity (pv) array of [N ii] 6584 Å profiles obtained in this way are shown in Fig. 12 and the line profile for the section marked A in Fig. 12 is shown in Fig. 13.
This spectral observation was calibrated photometrically against the slitless spectrum of the standard star Feige 56 to give a value, uncorrected for interstellar extinction, for the total emission in this [N ii] 6584 Å profile of 1.910-17 erg s-1 cm-2 arcsec-2 to 20 percent accuracy. This is 29 times fainter in the [N ii] 6584 Å line than the brightest filament in the eastern nebulosity as listed in Table 1. The [N ii] 6584 Å profile is centred on = 56 2 km s-1 and 36 km s-1 wide when simulated by a single Gaussian. When corrected for instrumental broadening this width reduces to 35 km s-1.
3 Discussion
3.1 Location of optical emission
The H/H ratios listed in Table 2 strongly indicates that heavy and patchy absorption of optical emission occurs over W 50. This is to be expected for a distance of 5 kpc along the Galactic plane and for a Galactic latitude of only -2.27°. This possibility is further supported by the ISOCAM infrared emission map of the vicinity of the western filaments obtained by Moldowan et al. (2005). One patch of infrared emission coincides closely with the visible western filaments (Fig. 3a & b and Fig. 5) but a larger region of infrared emission has no optical counterpart in our images. It is therefore probable that only parts of the shock–excited optical emission from W 50 is being observed in Figs. 2–5 with considerable parts heavily obscured by the foreground dust.
This patchiness by foreground dust as the cause of the limited detection of the whole of the W 50 optical filaments, which would be expected if this is indeed a supernova remnant, could be confirmed by the optical detection in Figs. 6, 12 & 13 for the first time of the northern radio ridge. Although the latter’s optical emission is very much fainter than that observed from the eastern and western optical filaments the [N ii] 6584 Å profile from it in Fig. 13 is centred on = 56 km s-1. This matches closely the values in Figs. 10 & 11 for the brightest and narrowest profiles of the eastern filamentary nebulosity. It is suggested that in all of these regions the motions of the emitting gas are nearly perpendicular to the sight–line and that = 56 km s-1 could be the best value of the systemic heliocentric radial velocity, for the whole SS 433 and W 50 complex. In these circumstances the optical emission from the northern radio ridge would have to be heavily obscured by the patchy dust. One complication to this patchy dust interpretation is that the relativistic jet of SS 433 has injected 2 1051 erg into the surrounding medium over its lifetime and could have affected the recombinations rates of the shocked W 50 gas in inpredictable ways.
3.2 Morphology of the eastern and western optical filaments
Taken as a whole, the new optical imagery in Figs. 2–5 reveals that the eastern filaments trace a broad arc that is convex with respect to the central source and follows the large scale helical morphology of the W 50 boundary in this vicinity as revealed by radio continuum maps (Dubner et al. 1998; see their more detailed maps to appreciate this structure). Interestingly, the western filaments seem to curve in an identical sense despite being on the opposite side of SS 433 (at all wavelengths the morphology of the western ‘ear’ is most likely distorted by a strong interaction with a dense portion of the local ISM).
The bi–polar relativistic jet from SS 433 appears to have broken through diametrically opposite boundaries of the W 50 supernova remnant assuming that this is the origin of large circular region of radio emission in Fig. 1. The bright optical emission (Figs. 2 – 5) then lies at these breakout regions. In an idealised case, a breakout region should take the form of a ring of emission where the expanding jet envelope shocks the dense shell of swept up and compressed material at the supernova remnant boundary. Optical emission from this interaction is not expected elsewhere because the interior is too hot and rarefied and the ambient medium is too low density ahead of the jet. The observed arc morphology i.e. eastern and western arcs, could be simply the result of heavy, patchy foreground interstellar absorption (see Sect. 3.1) combined with the jet axis being tilted so that the eastern tip is pointing towards the observer and western tip away (see references in Fabrika 2004 that confirm this jet orientation); the rings of optical emission become partial ellipses with only localised portions on their nearsides with respect to the observer being visible. However, the interaction is likely to be much more complex than described above not least because the jet close to SS 433 has a ‘corkscrew’ structure. Also Velázquez & Raga (2000) have numerically modelled the W 50/SS 433 system which in their simulations results in reflected and secondary shocks as well as the filling and acceleration of the whole supernova remnant by the jet cocoon. Nonetheless the breakout region remains a distinct zone in the simulations.
3.3 The shocked emission
All of the spectra in Table 2 show clearly that the observed optical emission originates in shock heated gas, since the [S ii] 6717 & 6731 Å/H 1.5. The [O iii] 5007 Å emission detected in both spectra suggests a shock velocity greater than 100 km s-1 (Cox & Raymond 1985). The absolute H flux covers a range of values from 1.4 to 2.6 erg s-1 cm-2 arcsec-2 and 5.8 to 16.3 erg s-1 cm-2 arcsec-2 for the western and eastern nebulosities, respectively. The [S ii] ratio which was found to be between 1.1 and 1.4. Using ‘temden’ in the nebular package in IRAF (Shaw & Dufour, 1995) the electron densities of 50 cm-3 and 700 cm-3 are measured for the eastern and western filaments, respectively. A comparison to shock models shows that the densities are different (east to west) by a factor of 10 or more, while the shock velocities are nearly the same. Hence, either there is a huge pressure differential between the two sides (nTpressure) or there is something incorrect with this interpretation. Furthermore, H emission was detected in both areas (but with low S/N) to give [O iii] 5007 Å/H ratios of between 5.6 (area EI) and 15.7 (area WII). Theoretical models of Cox & Raymond (1985) and Hartigan, Raymond & Hartmann (1987) suggest that for shocks with complete recombination zones the expected [O iii] 5007 Å/H ratio is 6, while this limit is exceeded in the case of a shock with incomplete recombination zones (Raymond et al., 1988). Our measured values suggest in the western nebulosity that shocks with incomplete recombination zones are present while in the eastern nebulosity the presence of shocks with complete recombination zones could not be ruled out. A combination therefore of the present observations with the theoretical predictions suggests that shock velocities are 100 km s-1 and 120 km s-1 for the eastern and western nebulosities respectively, though this difference may not be real when uncertainties in the data are considered.
3.4 Velocity of the optical filaments
The previous optical spectra of Mazeh et al. (1983) at very low angular resolution of the eastern and western filaments suggest that the average heliocentric radial velocities () are, respectively, 65 and 40 km s-1 (where the LSR and heliocentric radial velocities are related by -14.3 km s-1). This is in apparent contradiction with the orientation of the jet, which has the eastern portion directed towards the observer. The radio morphology also indicates that the axis of the elongated lobes of the W 50 shell is tilted to the plane of the sky with the eastern side nearest the observer.
The present spectral observations, with their higher spatial resolution, show that the brightes regions of the eastern filaments (Figs. 8–11) emit the narrowest lines centred on = 56 km s-1 but with extensive fainter regions, flowing off the filaments (Fig. 9), composed of high–velocity gas approaching the observer with radial velocities continuously up to 100 km s-1 from the bright filament value. It remains possible that similar high spatial resolution observations of the western filaments will show similar complex motions and eliminate this discrepancy which could only be a consequence of the low angular resolution employed in the early measurements. However, the appropriate flows emitting faintly in the eastern filaments are consistent with eastern side of W 50 pointing towards the observer.
Also, as noted above, the expected local shock velocities that give rise to the optical filaments are of order 100 km s-1 and the expansion of the remnant as a whole is estimated by Dubner et al (1998) to be 75 km s-1. Thus the measured difference in radial velocity between the bright optical filaments is small compared with the expected velocity range ( 100 km s-1). Any residual difference could be explained easily by patchy dust absorption hiding the full extent of the optical emission.
Also the contradiction only exists if it is assumed that the optical emission is tracing directly the outflow from the star. However, the optical emission much more likely traces the interaction between the jet cocoon and the shell of the W 50 SNR. Expansion of this shocked optically emitting gas could result in localised flows towards and/or away from the star (cf. simulations of Velázquez & Raga 2000, their figure 3). In the case of the eastern filaments, the curved morphology could then be a result of an expansion back towards SS 433 whereas the western filaments could be a result of an expansion away from or stationary with respect to SS 433. The optical emission then, is concentrated at the “rims” of the breakout region.
Broader, competing, possibilities should also be considered for it has been suggested as above that these elongated breakout features in the radio map are the microquasar jets currently penetrating through the shell of the W 50 SNR (Dubner et al., 1998). Alternatively, these eastern and western radio lobes of the SNR may simply be revealing the imprint of the precessing jets of SS 433, created early in the object’s evolution after the explosion of the supernova, and which have inflated along with the rest of the SNR as it expanded. The faint 100 km s-1 outflows from the eastern filaments around this lobe’s apparent breakout region would favour the first possibility.
Acknowledgements
The authors would like to thank the referee for contructive comments that have improved the paper considerably. We also thank G. Dubner who kindly provided us the radio image of W 50 in FITS format and the staff at Skinakas and SPM Observatories for their excellent support during these observations. JA and SA acknowledge funding by the European Union and the Greek Ministry of Development in the framework of the programme ‘Promotion of Excellence in Research Institutes (2nd Part)’. JAL acknowledges financial support from UNAM grants IN 112103, 108406 and 108506. Skinakas Observatory is a collaborative project of the University of Crete, the Foundation for Research and Technology-Hellas and the Max-Planck-Institut für Extraterrestrische Physik.
References
- Band (1987) Band D. L., 1987, PASP, 99, 1269.
- Boumis et al. (2002) Boumis P., Mavromatakis F., Paleologou E. V. & Becker W., 2002, A&A, 396, 225.
- Blundell & Bowler (2004) Blundell K. M. & Bowler, M. G., 2004, ApJ, 616, L159.
- Brinkmann, Aschenbach & Kawai (1996) Brinkmann W., Aschenbach B. & Kawai N., 1996, A&A, 312, 306.
- Cox & Raymond (1985) Cox D. P., & Raymond J. C., 1985, ApJ, 298, 651.
- Dubner et al. (1998) Dubner G. M., Holdaway M., Goss W. M. & Mirabel I. F., 1998, AJ, 116, 1842.
- Dubner (2002) Dubner G., 2002, in IAU Symp. 199, The Universe at Low Radio Frequencies, ed. A. Pramesh Rao, G. Swarup & Gopal-Krishna, p.284.
- Fabrika (2004) Fabrika, S., 2004, ApSPh Rev., 12, 1.
- Fitzpatrick (1999) Fitzpatrick E. L., 1999, PASP, 111, 63.
- Green (2006) Green D. A., 2006, A Catalog of Galactic Supernova Remnants (2006 April version), Mullard Radio Astronomy Observatory Cambridge.
- Hamuy et al. (1994) Hamuy M., Suntzeff N. B., Heathcote S. R., Walker A. R., Gigoux P. & Phillips M. M. 1994, PASP, 106, 566.
- Hartigan, Raymond & Hartmann (1987) Hartigan P., Raymond J. & Hartmann L., 1987, ApJ 316, 323.
- Holden & Caswell (1969) Holden D. J. & Caswell J. L., 1969, MNRAS, 143, 407.
- Kirshner & Chevalier (1980) Kirshner R. P. & Chevalier R. A., 1980, ApJ, 242, L77.
- Lasker, Russel & Jenkner (1999) Lasker B. M., Russel J. N. & Jenkner H., 1999, in the HST Guide Star Catalog, version 1.1-ACT, The Association of Universities for Research in Astronomy, Inc.
- Lynds (1965) Lynds B. T., 1965, ApJS, 12, 163.
- Mazeh et al. (1983) Mazeh T., Aguilar L. A., Treffers R. R., Königl A. & Sparke L. S., 1983, ApJ, 265, 235.
- Meaburn et al. (1984) Meaburn J., Blundell B., Carling R., Gregory D. F., Keir D., & Wynne C. G. 1984, MNRAS, 210, 463.
- Meaburn et al. (2003) Meaburn J., López J. A., Gutiérrez L., Quiróz F., Murillo J. M., Valdéz J. & Pedrayez M., 2003, RMAA, 39, 185.
- Moldowan et al. (2005) Moldowan A., Safi-Harb S., Fuchs Y. & Dubner G., 2005, AdSpR, 35, 1062
- Murdin & Clark (1980) Murdin P. & Clark D. H., 1980, MNRAS, 190, L65.
- Osterbrock (1989) Osterbrock D. E., 1989, Astrophysics of gaseous nebulae, eds. W. H. Freeman & Company.
- Raymond et al. (1988) Raymond J. C., Hester J. J., Cox. D., Blair W. P., Fesen R. A. & Gull T. R. 1988, ApJ 324, 869.
- Safi-Harb & Ögelman (1997) Safi-Harb S. & Ögelman H., 1997, ApJ, 483, 868.
- Seaton (1979) Seaton M. J., 1979, MNRAS, 187, L73.
- Shaw & Dufour (1995) Shaw R. A. & Dufour R. J., 1995, PASP, 107, 896.
- Shuder et al. (1980) Shuder J. M., Hatfield B. F. & Cohen R. D., 1980, PASP, 92, 259.
- Stirling et al. (2002) Stirling A. M., Jowett F. H., Spencer R. E., Paragi Z., Ogley R. N. & Cawthorne T. V., 2002, MNRAS, 337, 657.
- van den Bergh (1980) van den Bergh S., 1980, ApJ, 236, L23.
- Velázquez & Raga (2000) Velázquez P. F. & Raga A. C., 2000, A&A, 362, 780.
- Westerhout (1958) Westerhout G., 1958, Bull.astr.Insts Neth.,14, 215.
- Zealey, Dopita & Malin (1980) Zealey W. J., Dopita M. A. & Malin D. F., 1980, MNRAS, 192, 731.
| IMAGING | ||||||
| Filter | Exp. time | Area | Observatory | |||
| () | () | (sec) | ||||
| H[N ii] 6548 & 6584 Å | 6570 | 75 | 2400 | W50 total (4)a | 0.3m Skinakas | |
| [O iii] 5007 Å | 5005 | 28 | 2400 | W50 total (4) | 0.3m Skinakas | |
| Cont blue | 5470 | 230 | 180 | W50 total (4) | 0.3m Skinakas | |
| Cont red | 6096 | 134 | 180 | W50 total (4) | 0.3m Skinakas | |
| [O iii] 5007 Å | 5005 | 28 | 2400 | East (10) | 1.3m Skinakas | |
| Cont blue | 5470 | 230 | 180 | East (10) | 1.3m Skinakas | |
| H[N ii] 6548 & 6584 Å | 6570 | 75 | 2400 | West (2) | 1.3m Skinakas | |
| Cont red | 6096 | 134 | 180 | West (2) | 1.3m Skinakas | |
| H[N ii] 6548 & 6584 Å | 6580 | 90 | 2400 | North (1) | 2.1m SPM | |
| SPECTROSCOPY | ||||||
| Area | Slit centres | Exp. time | Offsetb | Aperture lengthc | Observatory | |
| (sec) | (arcsec) | (arcsec) | ||||
| East I (EI) | 19h14m20s | 05°03′41″ | 3900 | 112 S | 12 | 1.3m Skinakas |
| East II (EII) | 19h14m20s | 05°03′41″ | 3900 | 94 S | 26 | 1.3m Skinakas |
| East III (EIII) | 19h14m20s | 05°03′41″ | 3900 | 61 S | 66 | 1.3m Skinakas |
| East IV (EIV) | 19h14m24s | 05°04′49″ | 3900 | 58 S | 30 | 1.3m Skinakas |
| East V (EV) | 19h14m38s | 04°45′40″ | 3900 | 4 N | 24 | 1.3m Skinakas |
| West I (WI) | 19h09m39s | 05°02′34″ | 3900 | 89 S | 36 | 1.3m Skinakas |
| West II (WII) | 19h09m39s | 05°02′34″ | 3900 | 50 S | 43 | 1.3m Skinakas |
| West III (WIII) | 19h09m39s | 05°02′34″ | 3900 | 193 N | 44 | 1.3m Skinakas |
| East slit 1 | 19h14m18s | 05°02′00″ | 1800 | 0d | 300e | 2.1m SPM |
| East slit 2 | 19h13m57s | 04°55′30″ | 3600 | 0d | 300e | 2.1m SPM |
| North slit | 19h11m01s | 05°19′16″ | 4200 | 90d | 150e | 2.1m SPM |
a Numbers in parentheses represent the total number of different fields.
b Spatial offset from the slit centre in arcsec: N(North), S(South).
c Aperture lengths for each area in arcsec.
d Slit position angle (PA) in degrees.
e Slit width in m.
| East | |||||||||||||||
| Area EI | Area EII | Area EIII | Area EIV | Area EV | |||||||||||
| Line (Å) | Fa | Ib | S/Nc | F | I | S/N | F | I | S/N | F | I | S/N | F | I | S/N |
| H 4861 | 16 | 35 | (7) | 11 | 35 | (6) | 15 | 35 | (5) | 7 | 35 | (1) | 23 | 35 | (4) |
| [O iii] 4959 | 25 | 52 | (9) | 23 | 68 | (13) | 22 | 49 | (8) | ||||||
| [O iii] 5007 | 66 | 134 | (27) | 61 | 174 | (31) | 84 | 181 | (25) | 157 | 488 | (28) | 70 | 103 | (14) |
| [O i] 6300 | 67 | 74 | (38) | 78 | 90 | (61) | 87 | 97 | (38) | 34 | 40 | (13) | 44 | 46 | (19) |
| [O i] 6363 | 17 | 18 | (15) | 22 | 25 | (22) | 26 | 28 | (16) | 45 | 47 | (20) | |||
| [N ii] 6548 | 106 | 107 | (70) | 116 | 117 | (90) | 105 | 106 | (61) | 75 | 76 | (29) | 101 | 102 | (43) |
| H 6563 | 100 | 100 | (65) | 100 | 100 | (81) | 100 | 100 | (55) | 100 | 100 | (38) | 100 | 100 | (41) |
| [N ii] 6584 | 343 | 340 | (154) | 377 | 373 | (210) | 370 | 367 | (159) | 228 | 225 | (78) | 316 | 315 | (109) |
| [S ii] 6716 | 128 | 121 | (80) | 139 | 128 | (110) | 172 | 162 | (88) | 50 | 46 | (24) | 140 | 136 | (56) |
| [S ii] 6731 | 89 | 84 | (61) | 98 | 90 | (81) | 122 | 114 | (63) | 33 | 30 | (15) | 102 | 99 | (41) |
| Absolute H fluxd | 16.3 | 14.7 | 5.8 | 2.9 | 4.9 | ||||||||||
| [S ii]/H | 2.170.06 | 2.360.05 | 2.930.09 | 0.830.06 | 2.420.11 | ||||||||||
| F(6716)/F(6731) | 1.430.11 | 1.420.03 | 1.410.04 | 1.490.18 | 1.380.06 | ||||||||||
| [O iii]/H | 5.270.49 | 6.830.46 | 6.500.73 | 13.744.03 | 2.910.62 | ||||||||||
| c(H) | 0.980.12 | 1.450.13 | 1.060.15 | 1.570.37 | 0.530.17 | ||||||||||
| EB-V | 0.680.08 | 1.000.09 | 0.730.10 | 1.090.26 | 0.370.12 | ||||||||||
| West | |||||||||||||||
| Area WI | Area WII | Area WIII | |||||||||||||
| Line (Å) | F | I | S/N | F | I | S/N | F | I | S/N | ||||||
| H 4861 | 14 | 35 | (2) | 7 | 35 | (2) | 14 | 35 | (3) | ||||||
| [O iii] 4959 | 28 | 66 | (2) | 23 | 104 | (3) | 37 | 88 | (4) | ||||||
| [O iii] 5007 | 89 | 204 | (6) | 87 | 373 | (9) | 159 | 364 | (10) | ||||||
| [N ii] 6548 | 79 | 80 | (10) | 87 | 88 | (18) | 75 | 76 | (10) | ||||||
| H 6563 | 100 | 100 | (12) | 100 | 100 | (20) | 100 | 100 | (12) | ||||||
| [N ii] 6584 | 257 | 255 | (29) | 275 | 271 | (52) | 301 | 298 | (33) | ||||||
| [S ii] 6716 | 82 | 77 | (11) | 120 | 107 | (25) | 112 | 105 | (14) | ||||||
| [S ii] 6731 | 74 | 69 | (10) | 92 | 81 | (20) | 107 | 100 | (14) | ||||||
| Absolute H flux | 1.4 | 2.6 | 1.4 | ||||||||||||
| [S ii]/H | 1.560.27 | 1.860.19 | 2.120.33 | ||||||||||||
| F(6716)/F(6731) | 1.11 0.23 | 1.310.14 | 1.210.16 | ||||||||||||
| [O iii]/H | 7.642.32 | 13.401.81 | 12.782.40 | ||||||||||||
| c(H) | 1.150.67 | 2.010.76 | 1.150.65 | ||||||||||||
| EB-V | 0.800.46 | 1.390.52 | 0.800.45 | ||||||||||||
a Observed fluxes normalised to F(H)=100 and uncorrected for interstellar extinction.
b Intrinsic fluxes normalised to F(H)=100 and corrected for interstellar extinction.
c Numbers in parentheses represent the signal to noise ratio of the quoted fluxes.
d In units of erg s-1 cm-2 arcsec-2.
Listed fluxes are a signal to noise weighted average of two fluxes.
The emission line ratios [S ii]/H, F(6716)/F(6731) and [O iii]/H are calculated using the corrected for interstellar extinction values.
The errors of the emission line ratios, c(H) and EB-V are calculated through standard error propagation.