Measurement of the mass at KLOE.
Abstract
An integrated luminosity of 410 pb-1,
corresponding to 17 million of events, has been analyzed to measure the mass using the decay
. The measurement is insensitive to the calorimeter energy calibration
and the systematic error on the measurement is dominated by the uniformity of the detector response.
As a cross check of the method the mass from the decay has been measured and it is in agreement with the most accurate previous determinations.
The result obtained is MeV, that is today best measurement of the mass.
B. Di Micco, dimicco@fis.uniroma3.it - Università degli Studi di Roma Tre, via della Vasca Navale, 84 - 00146 Roma, Italy.
1 Introduction
The KLOE experiment is performed at the Frascati factory DANE[1]. DANE is a high luminosity , collider working at MeV, corresponding to the meson mass. In the whole period of data taking () KLOE has collected an integrated luminosity of 2.5 fb-1, corresponding to about 8 billions of produced and millions of mesons through the electromagnetic decay .
The KLOE detector consists of a large cylindrical drift chamber [2], DC, surrounded by a lead/scintillating-fiber sampling calorimeter [3], EMC, both immersed in a solenoidal magnetic field of 0.52 T with the axis parallel to the beams, in the following. The DC momentum resolution for charged particles is =0.4%. The calorimeter is divided into a barrel and two endcaps, and covers 98 of the total solid angle. Photon energies and arrival times are measured with resolutions and , respectively. Photon-shower centroid positions are measured with an accuracy of along the fibers, and 1 cm in the transverse direction. A photon is defined as a cluster of energy deposits in the calorimeter elements that is not associated to a charged particle. We require the distance between the cluster centroid and the nearest entry point of extrapolated tracks be greater than 3, where is the azimuthal angle.
The trigger [4] uses information from both the calorimeter and the drift chamber. The EMC trigger requires two local energy deposits above threshold ( MeV in the barrel, MeV in the endcaps). The trigger has a large time spread with respect to the time distance between consecutive beam crossings. It is however synchronized with the machine radio frequency divided by four, =10.85 ns, with an accuracy of 50 ps. For the 2001-2002 data taking, the bunch crossing period was =5.43 ns. The time () of the bunch crossing producing an event is determined offline during event reconstruction.
2 Measurement of the mass.
The value of the mass has been recently measured with high precision by two collaborations NA48[5] ( MeV/c2) and GEM[6] ( MeV/c2) using different techniques and production reactions. The two measurements differ by more than eight standard deviations from each other. The GEM measurement is in agreement with the older ones[7] while the NA48 measurement is higher. For this reason it is interesting to provide a further measurement of comparable precision in order to clarify the experimental situation.
3 Measurement method.
We measure the mass studying the decay . A kinematic fit is performed imposing the 4 constraints given by the energy-momentum conservation. Sing there are three photons and there are 4 constraints, the fit overconstrains the energies of the photons that are, practically, determined by the position of the clusters in the calorimeter. The inputs of the fit are the energy, the position and the time of the calorimeter clusters, the mean position of the interaction point, the total four-momentum of the colliding pair. Each of these variables is determined run by run using events ( almost 90000 events for each run, allowing a very precise determination of the relevant parameters).
4 Selection.
The events are selected by requiring at least three energy deposits in the barrel with a polar angle , not associated to a charged track. A kinematic fit imposing energy-momentum conservation and time of flight of photons equal to the velocity of light is done for all 3 ’s combination of N detected photons. The combination with the lowest is chosen as a candidate event if . The events surviving the cuts are shown in fig.1, where the Dalitz plot is shown. Three bands are clearly visible. The band at low is given by the , while the other two bands are events.
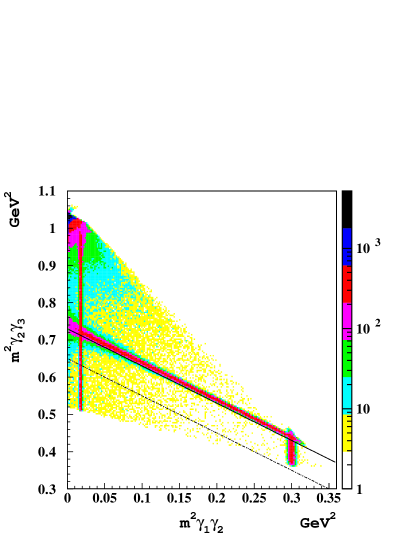
With the cut shown in the Dalitz plot we select a pure sample of events. The resulting spectrum (fig.2) can be fitted well with a single gaussian of .

In order to determine the systematic error we have evaluated the uncertainities on all the quantities used in the kinematic fit
and the effect on the fitted value.
A sample of events has been used to check the mean position of the interaction point, the energy response of the calorimeter and the alignment of the calorimeter with the Drift Chamber. The
mean position of the interaction point, determined run by run using the events, has been compared with the reconstructed vertex. The difference between this two values has been computed run by run and the spread of the distribution is used for the systematic error on the determination of the I.P mean position.
Since the I.P position is determined with the tracks reconstructed in the Drift Chamber, small displacement between the DC and the calorimeter can affect position measurement of this point in the calorimeter reference frame. To check disalignment between the calorimeter and the Drift Chamber, the and tracks of the events were extrapolated to the calorimeter and the closest approach point to the cluster centroid was determined. The difference in the position were determined and the spread of these values are taken as systematic error on DC-Calo allignment. A small correction of 1.1 mm in the Calorimeter position along the direction, the vertical, and 2 mm along the direction (the direction of the beam axis) was applied.
The absolute energy scale of the calorimeter and the linearity of the energy response was checked using the
events and the events. The energy of the can be determined using the
two charged tracks in the Drift Chamber and then compared to the reconstructed cluster energy. A linearity better than 2 % was found while
the absolute scale was found to be calibrated at better than 1 %. These systematic uncertainties result in just 4 keV for the scale
and 4 keV for the linearity on the value of the reconstructed mass. The measurement shows very small sensitivity to the calorimeter calibration because, as explained before, the kinematic fit overconstraints the photon energy with the cluster positions.
For this reason it is important to evaluate the systematic error due to the misalignment of single modules in the calorimeter. This has been done evaluating the value of the mass as a functon of the position of the photons in the calorimeter. A spread of about 10-15 keV was found and assumed as systematic error.
Systematics due to the particular choice of the cut on the Dalitz plot shown in fig.1 was also determined to be 12 keV, while the cut on the pratically doesn’t have any effect on the value of the mass (0.7 keV).
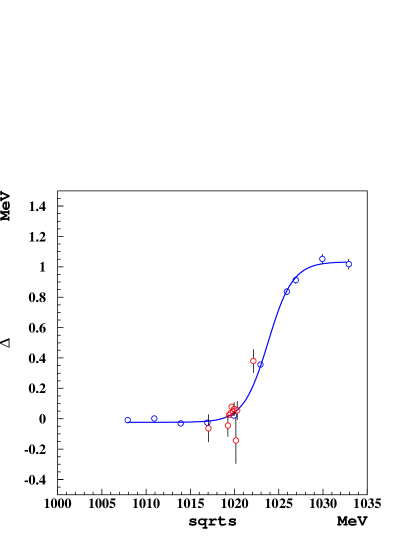
The measured value of the mass is, instead, very sensitive to the energy in the center of mass of the system. Due to initial state radiation emission (ISR) the available center of mass energy is a bit lower than
the of the beams measured using events. A variation of 100 keV of the measured mass value is predicted by the MC simulation. Since this correction is realtively large we have checked the simulation of ISR emission in the MC in the following way:
-
•
the correction to apply to the fitted value in order to obtain the real value of the mass has been determined as a function of and shown in fig.3;
-
•
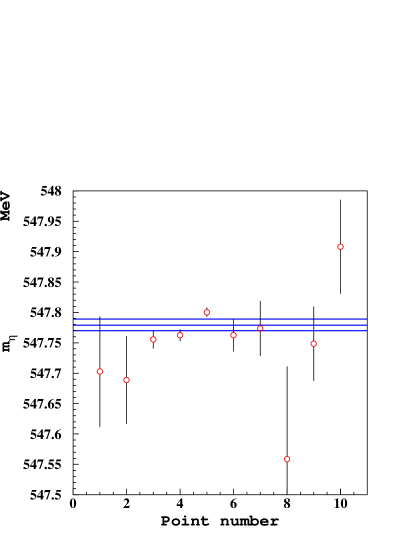
the whole data taking has been devided in ranges of using 8 points for the on peak data and two off-peak points at 1017 MeV and 1022 MeV;
-
•
the value of the mass obtained for each value of has been corrected according the MC prediction;
-
•
the residual spread of these points has been taken as systematic error (8 keV) (see fig. 4).
All these studies have been done also for the mass using the events. The ratio of the two masses has also been studied. All the contributions to the systematic error are summarized in table 1.
| systematic effect | (keV) | (keV) | |
| Calorimeter energy scale | 4 | 1 | 5.6 |
| Calorimeter not linearity | 4 | 11 | 31 |
| Vertex position | 4 | 6 | 19 |
| Angular uniformity | 15 | 12 | 37 |
| Angular uniformity | 10 | 44 | 120 |
| ISR effect | 8 | 9 | 28 |
| Dalitz plot cut slope | 12 | 4 | 15 |
| Dalitz plot cut constant | 12 | 1.9 | 10 |
| cut | 0.7 | 4 | 13 |
| overall | 27 | 49 | 136 |
Finally stability versus run conditions are checked dividing the whole period of DATA taking 2001-2002 in 8 sub-periods and determining the
value of , and as a function of the acquisition period. The results are shown in fig. 5.
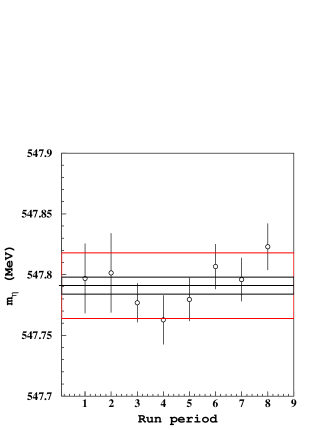
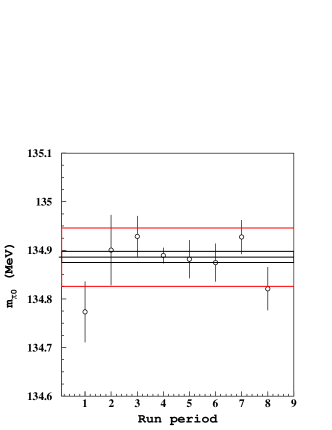
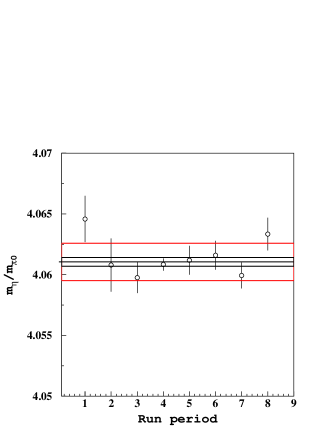
The values shown in the figure have been fitted with a constant and the results of the fits are shown in tab. 2.
| Fit results | ||||
|---|---|---|---|---|
| Value | Error | C.L | ||
| 547791 keV | 7 keV | 6.9/7 | 45% | |
| 134886 keV | 12 keV | 7.7/7 | 34% | |
| 4.0610 | 0.0004 | 8.9/7 | 26% | |
5 Computation of the final result.
We have two different ways to extract the value of the mass. We can use the ratio obtaining:
from which using the PDG2006 [7] value of the mass ( = 134976.6 0.6 keV) we obtain:
keV.
Alternatively we can use directly the value of coming from the fit. For this purpose we need to calibrate
the with high precision ( is in fact independent while the two values of and
are fully correlated with the measuremnt). The absolute scale has been calibrated using the value measured by CMD-2 [8]. To this pourpose the cross section has been measured as a function of the using the two off-peak points at and MeV together with the on-peak data. The resonance curve has been fitted using the CMD-2 parametrization that takes in account ISR and threshold effect in production. The central value of the mass has been measured obtaining MeV [9]. The difference respect to the CMD-2 value sets our absolute calibration.
This means that our measurements can be regarded as a measurement of the ratio and :
and
We can extract the and mass using the value of CMD-2 obtaining:
where the statistical and sytematic error have been independently summed in quadrature.
The mass is in agreement at 1.4 level with the PDG06 value, validating the whole procedure.
The value of the mass obtained here has been compared with the previous measurements in fig. 6. This result confirms the measured value of the NA48 at , with an error reduced by a factor 2 and is 11 away from the GEM result, it is also compatible, at level, with less accurate CLEO result [10].

References
- [1] S. Guiducci, Proc. of the 2001 Particle Accelerator Conf., P. Lucas, S. Webber (Eds.), Chicago, IL, U.S.A. (2001)
- [2] KLOE Coll., M. Adinolfi et al., Nucl. Instrum. Meth. A488 (2002) 51.
- [3] KLOE Coll., M. Adinolfi et al., Nucl. Instrum. Meth. A482 (2002) 363.
- [4] KLOE Coll., M. Adinolfi et al., Nucl. Instrum. Meth. A492 (2002) 134.
- [5] A. Lai et al., Phys. Lett. B533, 196 (2002)
- [6] M. Abdel-Bary et al., Phys. Lett. B619, 281 (2005)
- [7] W.-M. Yao et al., Journal of Physics G33, 1 (2006)
- [8] R.R.Akhmetshin et al., Phys. Lett. B578, 285 (2004)
- [9] M. Antonelli, M. Dreucci, KLOE note n. 181, (2002)
- [10] D.H. Miller et al., arXiv:0707.1810v1