Characterising Web Site Link Structure
Abstract
The topological structures of the Internet and the Web have received considerable attention. However, there has been little research on the topological properties of individual web sites. In this paper, we consider whether web sites (as opposed to the entire Web) exhibit structural similarities. To do so, we exhaustively crawled 18 web sites as diverse as governmental departments, commercial companies and university departments in different countries. These web sites consisted of as little as a few thousand pages to millions of pages. Statistical analysis of these 18 sites revealed that the internal link structure of the web sites are significantly different when measured with first and second-order topological properties, i.e. properties based on the connectivity of an individual or a pairs of nodes. However, examination of a third-order topological property that consider the connectivity between three nodes that form a triangle, revealed a strong correspondence across web sites, suggestive of an invariant. Comparison with the Web, the AS Internet, and a citation network, showed that this third-order property is not shared across other types of networks. Nor is the property exhibited in generative network models such as that of Barabási and Albert.
Index Terms – Hypertext systems, Topology, Modeling.
1 Introduction
The Web has become a global tool for sharing information. It can be represented as a huge graph which consists of billions of hypertext web pages connected by hyperlinks pointing from one web page to another [4, 11]. Each web page is part of a larger web site, which is loosely defined as a group of web pages whose URL addresses use the same domain name, such as cs.ucl.ac.uk and ieee.org.
Studying and understanding the Web’s topological structure is important as it may lead to improved techniques for information retrieval. Link structure of the Web has been used in algorithms like Pagerank [16] and HITS [9] to estimate the importance of web pages, and in [8, 3, 10] for community discovery and clustering. These algorithms do not typically use the internal link structure within a web site, but rather, rely on external links between web sites. Nevertheless, the internal structure of a web site is important. For example the statistical property of web site link structure may be used as an informative measure of web site quality, e.g. navigability [20].
There is surprisingly little study of the structural properties of web sites in general. Certainly, it is well known that examination of the graph structure of an individual web site can be used to calculate the mean diameter of the web site, and other metrics, that can then be used to infer properties regarding the navigability of the web site. However, we are unaware of prior work that provides a statistical topological characterization of all web sites. As such, web sites, as opposed to the Web, are often considered to exhibit an arbitrary statistical topological structure.
However, this study reveals that the topology of web sites is not arbitrary. In fact, examination of the triangle coefficient (the number of triangles of a node) as a function of degree (the number of links of the node) reveals a very strong correlation across web sites, suggestive of a possible invariant of web site link structure. Moreover, this third-order property varies across other networks, such as the Web, the Internet and citation networks. Thus, it appears to strongly characterise web sites.
This paper is organised as follows. In Section 2 we introduce a number of topological metrics which have been used to characterise and compare network structures. In Section 3 we introduce the datasets used in this study. These consist of 18 web sites which vary in size from a few thousand pages to millions of pages. The web sites cover a broad range of entities: 9 government sites from various countries, 3 commercial sites, 3 educational sites and 3 very large sites, (IEEE, Wikipedia, Yahoo!). In Section 4 we present our statistical results and discuss the implications. In addition to comparing data across web sites, we also compare with (i) subsets of the Web, (ii) a citation network, (iii) the AS-level Internet network, and (iv) the generative model of Barabási and Albert [2]. Section 5 summarises the key results and discusses how this work can be used to improve generative models of hypertext networks.
2 Definition of Topological Properties
We briefly review and define the following topological properties, which are grouped into three orders according to the scope of information required to compute them [12]. These are (i) the -order properties, e.g. degree distribution, (ii) the -order properties, e.g. degree correlation and rich-club connectivity, and (iii) the -order properties, e.g. triangle coefficient and clustering coefficient.
2.1 The -Order Properties
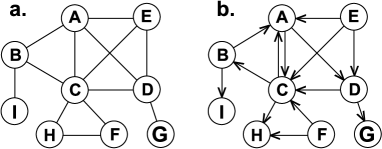
The link structure of a web site can be described as an undirected graph on which a node represents a web page and a link denotes the existence of at least one hyperlink connection between two nodes. The connectivity, or degree , of a node is defined as the number of links, or neighbours, the node has. For example in Figure 1a, node has four neighbours , , and , and its degree . A web site can also be described as a directed graph on which each link has a direction pointing from one node to another. The in-degree of a node is then defined as the number of incoming links and the out-degree the number of outgoing links. For example in Figure 1b, node has three incoming links from nodes , and , i.e. , and two outgoing links to nodes and , i.e. . This paper studies web sites link structure as undirected graphs unless specifically stated.
The degree of a node measures a node’s local connectivity. Topological properties calculated by using the degree of individual nodes are classified as -order properties, e.g. the average degree of nodes in a network.
2.1.1 Degree Distribution
The most studied topological property for large networks is the degree distribution , which is defined as the probability that a randomly selected node has degree . A random graph [7] is characterised by a Poisson degree distribution where the distribution peaks at the network’s average degree. It has been reported that a number of networks [2] follow a power-law degree distribution,
| (1) |
This means that most nodes have very few links, while a few nodes have a very large number of links.
2.2 The -Order Properties
Topological properties are classified as -order properties if they are based on the degree information of the two end nodes of a link, such as the joint degree distribution [6], which is the probability that a randomly selected link connects a node of degree with a node of degree . The -order properties provide a more complete description of a network’s structure than the -order properties. For example the degree distribution can be obtained from the joint degree distribution: .
2.2.1 Degree Correlation
The nearest-neighbours average degree, , of -degree nodes [17, 22], is a projection of the joint degree distribution, given by
| (2) |
A network is called an assortative network if increases with , which means nodes tend to attach to similar nodes, i.e. high–degree nodes to high–degree nodes and low–degree nodes to low–degree nodes (‘assortative mixing’). Many social networks are assortative networks. A network is a disassortative network if decreases with , i.e. high–degree nodes tend to connect with low–degree nodes and vice versa (‘disassortative mixing’). This is the case for most information and communications networks.
A network’s degree correlation, or mixing pattern, can be summarised by a single scalar called the assortative coefficient [14, 15],
| (3) |
where is the number of links and , are degrees of the end nodes of the th link with . The value of is in the range of . For assortative networks and for disassortative networks .
2.2.2 Rich-Club Connectivity
The rich-club connectivity [26, 5] measures how tightly the high-degree nodes, rich nodes, interconnect with themselves. If is the number of nodes with degrees large than and they share links between themselves, the rich-club connectivity is defined as
| (4) |
where is the maximum possible number of links that the nodes can have. For example in Figure 1a, there are five nodes (, , , and ) with degrees larger than 2 and they have 8 links between them, thus , which means the 5 best-connected nodes are 80% fully interconnected. The rich–club connectivity is a -order property because whether a link belongs to depends on the degrees of the link’s two end nodes.
The rich–club connectivity is a different projection of the joint degree distribution,
| (5) |
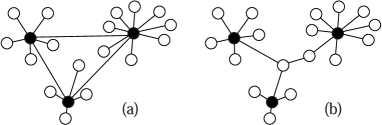
where is the total number of nodes and is the maximum degree in a network. The rich–club connectivity does not trivially relate with the degree correlation [24]. For example the two graphs shown in Figure 2 are both disassortative networks, but for the 3 best-connected nodes in Figure 2a, , and in Figure 2b, .
2.3 The -Order Properties
The -order properties are based on connectivity information between three nodes that form a triangle.
2.3.1 Triangle Coefficient
The triangle coefficient is defined as the number of triangles a node shares, which is equivalent to the number of links among the node’s neighbours [25]. Triangle is the basic unit for network redundancy. The more triangles, the more alternative paths between nodes.
In-triangle and out-triangle coefficients
On a directed graph, a node’s neighbours can be divided into two groups: in-neighbours, which are connected with incoming links; and out-neighbours, which are connected with outgoing links. An in-triangle of a node consists of the node and two of its in-neighbours, and an out-triangle consists of the node and two out-neighbours. For example in Figure 1b, node has two in-triangles and and one out-triangle , therefore node ’s in-triangle coefficient is 2 and out-triangle coefficient is 1.
2.3.2 Clustering Coefficient
A more widely studied -order property is the clustering coefficient , which is defined as the ratio of actual links among a node’s neighbours to the maximal possible number of links they can share [23]. The clustering coefficient of a node can be given as a function of a node’s degree and its triangle coefficient,
| (6) |
Two nodes with different triangle coefficients can have the same clustering coefficient. For example in Figure 1a, node has three neighbours and one triangle and node has six neighbours and five triangles (, , , and ). However, their clustering coefficients are the same:
Therefore one should use the triangle coefficient to infer the clustering information of nodes with different degrees.
3 Datasets
Here we briefly summarise the various datasets used in this study.
| Web Site | Number | Number | Average | Assortative | Average | |
| Dataset | domain name | of nodes | of links | degree | coefficient | triangle coef. |
| AO-CA | cac.gc.ca | 12,730 | 120,485 | 15.94 | -0.35 | 159.78 |
| AO-IT | corteconti.it | 32,614 | 200,516 | 11.96 | -0.40 | 186.11 |
| AO-UK | nao.gov.uk | 4,027 | 25,453 | 11.84 | -0.36 | 89.40 |
| AO-US | gao.gov | 19,625 | 223,998 | 21.69 | -0.63 | 289.37 |
| FO-AU | dfat.gov.au | 29,140 | 791,039 | 53.25 | -0.78 | 1,066.30 |
| FO-CZ | mzv.cz | 31,246 | 778,163 | 45.23 | -0.13 | 1,134.06 |
| FO-DE | auswaertiges-amt.de | 46,219 | 2,234,535 | 94.10 | -0.56 | 4,439.89 |
| FO-JP | mofa.go.jp | 52,206 | 493,861 | 17.11 | -0.37 | 177.23 |
| FO-UK | fco.gov.uk | 33,280 | 694,255 | 36.29 | -0.16 | 884.54 |
| COM-HSBC | hsbc.co.uk | 51,043 | 68,454 | 2.62 | -0.05 | 7.97 |
| COM-NEXT | next.co.uk | 74,989 | 557,466 | 14.11 | -0.47 | 182.55 |
| COM-SKODA | skoda-auto.com | 49,341 | 727,119 | 28.39 | -0.30 | 292.12 |
| EDU-AUCK | arts.auckland.ac.nz | 12,457 | 129,870 | 17.64 | -0.21 | 258.13 |
| EDU-UCB | haas.berkeley.edu | 100,025 | 373,521 | 6.90 | -0.09 | 84.85 |
| EDU-UCL | cs.ucl.ac.uk | 36,554 | 229,711 | 10.81 | -0.15 | 70.34 |
| LARGE-IEEE | ieee.org | 1,977,923 | 5,614,610 | 5.54 | -0.05 | 57.92 |
| LARGE-WIKI | zh.wikipedia.org | 1,913,510 | 8,249,248 | 8.12 | -0.13 | 64.54 |
| LARGE-YAHOO | yahoo.com | 3,448,289 | 12,039,165 | 6.72 | -0.08 | 81.69 |
| Web | – | 43,425 | 173,696 | 7.96 | -0.12 | 38.43 |
| Citation network | – | 244,864 | 897,170 | 7.33 | -0.08 | 4.20 |
| AS Internet | – | 9,200 | 28,957 | 6.30 | -0.24 | 21.37 |
| BA model | – | 10,000 | 30,000 | 6.00 | -0.02 | 0.16 |
3.1 Web sites
We exhaustively crawled the 18 web sites of the organisations listed in Table 1: 1) the national audit office or equivalent of Canada (AO-CA), Italy (AO-IT), the United Kingdom (AO-UK) and the United States (AO-US); 2) the foreign office or equivalent of Australia (FO-AU), the Czech Republic (FO-CZ), German (FO-DE), Japan (FO-JP) and the UK (FO-UK); 3) commercial web sites, such as HSBC bank in the UK (COM-HSBC), the UK retailer NEXT (COM-NEXT) and the automobile company SKODA (COM-SKODA); 4) educational web sites, such as the Faculty of Arts at the University of Auckland, New Zealand (EDU-AUCK), the Haas School of Business at the University of California at Berkeley (EDU-UCB), and the Department of Computer Science at University College London (EDU-UCL); and 5) three very large web sites with millions of web pages, such as the IEEE (LARGE-IEEE), Wikipedia in the language of Simplified Chinese (LARGE-WIKI) and Yahoo! (LARGE-YAHOO).
We used the Nutch 1.6.0 crawler (http://lucene.apache.org/nutch). Each crawl was started from a web site’s homepage and was restricted to the web site’s domain as listed in Table 1. The crawler was configured to allow for complete site acquisition and collected all web pages up to a depth of 18. The default parameters were a 5-second delay between requests to the same host, and 10,000 attempts to retrieve pages that fail with a ‘soft’ error [20]. We discarded hyperlinks pointing to web pages outside the web site’s domain and removed self-loops and duplicated hyperlinks.
We are aware of a number of available data sources of the Web. We did not extract web sites data from them because they aim to sample the entire Web and contain very incomplete information of the internal link structure of individual web sites. For example the Stanford WebBase data (http://dbpubs.stanford.edu:8091/~testbed/doc2/WebBase) contains only 400 web pages with NASA’s domain name (nasa.org).
3.2 Web
WT10g is a mega dataset of the Web proposed by the annual international Text REtrieval Conference (TRECs, http://trec.nist.gov). WT10g is constructed from more than 320 gigabytes of archived data containing 1.7M web pages and hyperlinks between them. It is reported that WT10g retains properties of the larger Web [21] and has been used as a data resource for research on Web retrieval and modelling. We randomly sampled 10 subsets of WT10g, each of which contains 50,000 web pages and links between those pages. In this paper we use the average properties of the 10 WT10g subsets as an approximation of the Web’s link structure.
3.3 Citation Network
The citation network [19] data was extracted from the online computer science publication database CiteSeer (http://citeseer.ist.psu.edu/). The CiteSeer data contain 575K entries, from which we extracted 244,864 records having at least one reference (outgoing link) or citation (incoming link).
3.4 AS Internet
The Internet topology at the autonomous systems (AS) level has been extensively studied in recent years [18, 25, 13, 12]. On the AS Internet, nodes represent Internet service providers and links represent connections between them. In this paper we use the AS Internet dataset ITDK0304 collected by CAIDA [1].
3.5 Barabási-Albert Model
The Barabási and Albert (BA) model [2] has been widely used in the study of complex networks. This model shows that a power-law degree distribution can be produced by two mechanisms: growth, where the network “grows” from a small random graph by attaching new nodes to old nodes in the existing system; and preferential attachment, where a new node is attached preferentially to nodes that are already well connected.
4 Results
Here we summarise our experimental findings. We examine a variety of first, second and third-order topological properties and compare them across the various web sites. We then compare the topological properties of web sites with other networks, specifically, the Web, AS network, a citation network, and the generative network of Barabási and Albert.
4.1 Comparison between the web sites
4.1.1 The And -Order Properties
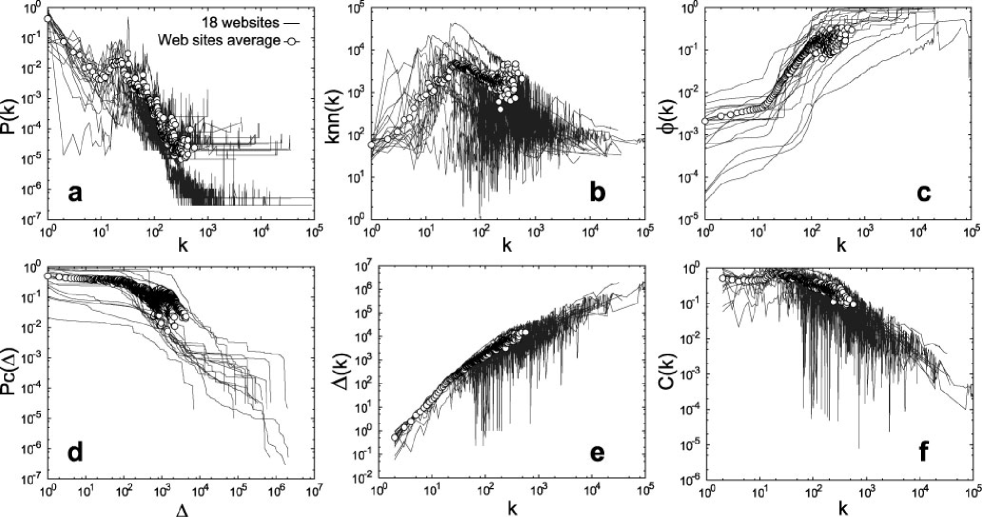
As shown in Table 1, the size and the average degree of the web sites vary significantly. The foreign office web sites have very large average degrees, whereas the three large web sites with millions of web pages have very small average degrees. Figure 3a, b and c illustrate the degree distribution , the degree correlation , and the rich-club connectivity of the 18 web sites on a log-log scale. Also shown are their average properties, depicted by circles111 The average degree distribution is obtained as such: for a given , if at least of the 18 web sites have , then where . Other average properties are calculated in similar ways. . It is clear that the and -order properties of the web sites exhibit huge variations over several orders of magnitudes. Thus, the web sites cannot be well characterised by the average of these properties. For example, in Figure 3c, some web sites with nodes of degree are almost fully interconnected with themselves, i.e. , whereas in other web sites the interconnectedness is much looser, with less than 0.001.
4.1.2 The -Order Properties
Figure 3d shows the complementary cumulative distribution of the triangle coefficient , which is the probability that a node’s triangle coefficient is larger than . Figure 3e shows the relationship between triangle coefficient and degree , i.e. the average triangle coefficient of -degree nodes. Although the web sites do not show an agreement on , they do exhibit a clear correspondence on . Some web sites have sharp spikes on their curves. These spikes reflect the existence of star-like subgraphs in these web sites, e.g. a web page with a long list of hyperlinks pointing to documents or images. Compared to the large number of web pages contained in a web site, the limited number of such spikes are not statistically significant.
The average over all the web sites of the triangle coefficient as a function of degree is also depicted in Figure 3e, see circles, and is a smooth curve, which well represents all the web sites. This is suggestive of a structural invariant of web sites.
Figure 3f shows the web sites show a similar correspondence on the relationship between clustering coefficient and degree . Note that the average clustering coefficient, depicted by circles, is not a monotonic function of degree. This is because the clustering coefficient is itself a function of the degree and triangle coefficient. In the following we do not consider further, as the triangle coefficient, , contains all information provided by .
4.2 Comparison with other networks
Here we compare the topological properties of the average over all web sites, with those of other networks, specifically the Web, a citation network, the AS Internet, and the BA model.
4.2.1 Degree Distribution
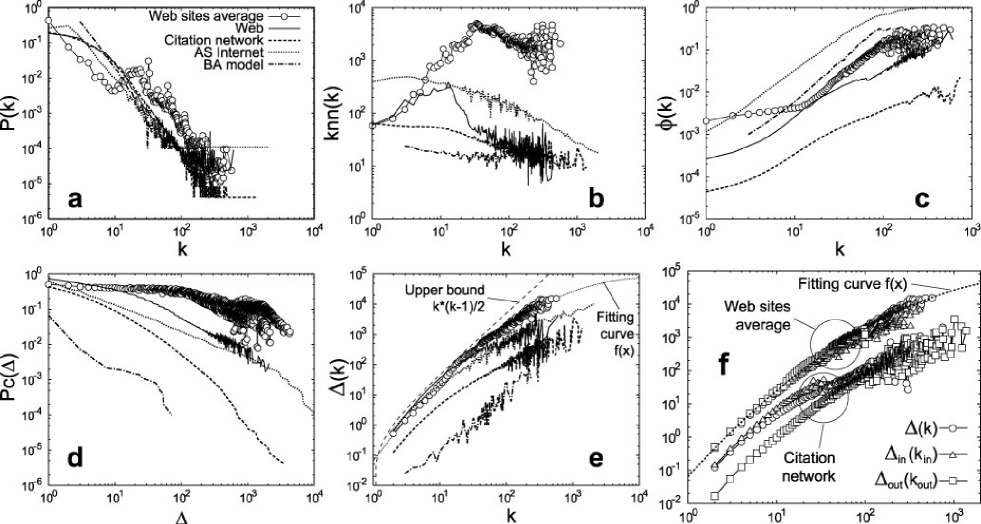
Figure 4a shows that the degree distribution of the Web, the citation network, the AS Internet and the BA model can be well described as a power-law with . However the average degree distribution of the web sites is very different: for or , it can be described as a power-law; but for , the distribution increases exponentially with degree.
4.2.2 Degree Correlation
Figure 4b shows that the citation network and the AS Internet are typical disassortative networks where decreases monotonically with . The BA model is an example of a neutral network where does not change with . For the average of the web sites, and the Web, first increases and then decreases with , and peaks at and respectively. For large degrees, the average of the web sites is significantly larger than all other networks.
4.2.3 Rich-Club Connectivity
Figure 4c shows that the AS Internet has the highest rich-club connectivity, with a fully interconnected core, i.e. , for . The citation network has the lowest rich-club connectivity. Although the BA model is very different from the web sites when measured by , the two exhibits similar rich-club connectivity for .
4.2.4 Distribution of Triangle Coefficient
Figure 4d shows that the web sites contain significantly more triangles than all other networks. The high density of triangles ensures the navigability of the web sites.
4.2.5 Triangle Coefficient as a Function of Degree
Figure 4e shows that, in general, all the networks exhibit a positive correlation between triangle coefficient and degree. This is because the larger the degree of a node, the more neighbours a node has, and thus the higher the chance of forming triangles. As discussed in Section 4.1.2, all the web sites exhibit a very similar relationship between triangle coefficient and degree, that is well characterised by the average over all the web sites. The average correlation between triangle coefficient and degree of the web sites can be closely fitted by a function given as
or
It is clear that the relationship between triangle coefficient and degree is different from the other networks. The BA model exhibits the lowest number of triangles as a function of node degree, followed by the citation network, and then the AS Internet. For degree , the Web data closely follows that of the average over web sites, but diverges thereafter.
4.2.6 In-Triangle and Out-Triangle
Figure 4f examines the three relationships of (i) triangle coefficient versus degree , (ii) in-triangle coefficient versus in-degree , and (iii) out-triangle coefficient versus out-degree , for the citation network and the average over all 18 web sites. That is, here, we consider the networks as directed graphs.
For the web sites, these three relationships closely overlap one another. This means the probability of forming triangles with a web page’s in-neighbours or with its out-neighbours are the same. However, for the citation network, is one order of magnitude larger than for the same degrees. This means the probability of a paper forming triangles with its citations (in-neighbours) is significantly larger than it forming triangles with its references (out-neighbours).
This structural difference between web sites and the citation network may reflect their different evolution dynamics. For a citation network, when a paper is published all its references existed before the publication of the paper and, of course, cannot be changed. However, a paper can always acquire new citations, and these citations may reference other citations (thus continuing to form triangles). In contrast, for a web site, web pages and their associated hyperlinks can be added, deleted or revised at any time. For web sites, there is no equivalent to a reference to a page that remains static and unable to be changed in the future.
5 Conclusion
We examined a number of topological properties of hyperlink data crawled from 18 diverse web sites. Our empirical results showed that the link structures of the web sites are significantly different when measured with 1st and 2nd-order topological properties. This is probably to be expected since the web sites are designed for different purposes and developed independently. However we observed that web sites share a common 3rd-order topological property, the relationship between triangle coefficient and degree. This common relationship is unexpected and suggestive of a topological invariant for web sites. Comparison with the Web, the AS Internet, a citation network and the Barabási-Albert model showed that this third-order property is not shared across other types of networks. Thus, this property appears to strongly characterise web sites. The physical meaning of this 3rd-order property is that given the number of hyperlinks to and from a particular web page, we can statistically estimate how the web page’s neighbouring pages are interlinked; and this statistical estimation is valid for all web sites.
Further evaluation on a wider variety of web sites is needed to verify that this 3rd-order property is an invariant. If so, then the fundamental question is why? Possible explanations include standardised web site designing principles, popular web site developing tools, or universal evolution dynamics which fundamentally reflect the common nature and function of web sites as a way of organising and disseminating information. The answer to this question may prove valuable for research on a number of issues, such as modelling web site and other document networks, recommendations for building web sites in the future, optimizing search engine algorithms, and understanding the fundamental principles governing the evolution of the Web.
6 Acknowledgments
This work is partly supported by the UK Nuffield Foundation grant NAL/01125/G and a grant from the Cambridge-MIT Institute.
References
- [1] The Cooperative Association For Internet Data Analysis. http://www.caida.org/.
- [2] A. Barabási and R. Albert. Emergence of scaling in random networks. Science, 286:509, 1999.
- [3] K. Bharat, B.-W. Chang, M. Henzinger, and M. Ruhl. Who links to whom: Mining linkage between web sites. In Proc. of IEEE Intl. Conf. on Data Mining (ICDM), 2001.
- [4] A. Broder, R. Kumar, F. Maghoul, S. R. P. RaghavanRajagopalan, S., and A. Tomkins. Graph structure in theweb: Experiments and models. In WWW’00: Proc.of the 9th Intl. Conf. on World Wide Web, 2000.
- [5] V. Colizza, A. Flammini, M. A. Serrano, and A. Vespignani. Detecting rich-club ordering in complex networks. Nature Physics, 2:110–115, 2006.
- [6] S. N. Dorogovtsev and J. F. F. Mendes. Evolution of networks. Adv. Phys., 51(1079), 2002.
- [7] P. Erdős and A. Rényi. On the evolution of random graphs. Publ. Math. Inst. Hung. Acad. Sci., 5:17, 1960.
- [8] X. He, H. Zha, C. Ding, and H. Simon. Web document clustering using hyperlink structures. Computational Statistics and Data Analysis, 41(1):19–45, 2001.
- [9] J. Kleinberg. Authoritative sources in a hyperlinked environment. Journal of the ACM, 46(5):604–632, 1999.
- [10] R. Kumar, P. Raghavan, S. Rajagopalan, and A. Tomkins. Trawling the web for emerging cyber-communities. Computer Networks, 31(11-16):1481–1493, 1999.
- [11] M. Levene. An Introduction to Search Engines and Web Navigation. Pearson Education, 2005.
- [12] P. Mahadevan, D. Krioukov, K. Fall, and A. Vahdat. Systematic topology analysis and generation using degree correlations. In Proc. of SIGCOMM’06, pages 135–146. ACM Press, New York, 2006.
- [13] P. Mahadevan, D. Krioukov, M. Fomenkov, B. Huffaker, X. Dimitropoulos, K. Claffy, and A. Vahdat. The Internet AS-level Topology: Three Data Sources and One Definitive Metric. Comput. Commun. Rev., 36(1):17–26, 2006.
- [14] M. E. J. Newman. Assortative mixing in networks. Phys. Rev. Lett., 89(208701), 2002.
- [15] M. E. J. Newman. Mixing patterns in networks. Phys. Rev. E, 67(026126), 2003.
- [16] L. Page, S. Brin, R. Motwani, and T. Winograd. The pagerank citation ranking: Bringing order to theweb. Technical report, Stanford Digital Library Technologies Project, 1998.
- [17] R. Pastor-Satorras, A. Vázquez, and A. Vespignani. Dynamical and correlation properties of the internet. Phys. Rev. Lett., 87(258701), 2001.
- [18] R. Pastor-Satorras and A. Vespignani. Evolution and Structure of the Internet - A Statistical Physics Approach. Cambridge University Press, Cambridge, 2004.
- [19] V. Petricek, I. J. Cox, H. Han, I. Councill, and C. L. Giles. A comparison of on-line computer science citation databases. In ECDL’2005: Proc. of the 9th European Conf. on Research and Advanced Technology for Digital Libraries. Springer, 2005.
- [20] V. Petricek, T. Escher, I. J. Cox, and H. Margetts. The web structure of e-government - developing a methodology for quantitative evaluation. In WWW’06: Proc.of the 15th Intl. Conf. on World Wide Web, 2006.
- [21] I. Soboroff. Does wt10g look like the web? In ACM SIGIR’02, pages 423–425, 2002.
- [22] A. Vázquez, M. Boguñá, Y. Moreno, R. Pastor-Satorras, and A. Vespignani. Topology and correlations in structured scale-free networks. Phys. Rev. E, 67(046111), 2003.
- [23] D. J. Watts and S. H. Strogatz. Collective dynamics of ‘small-world’ networks. Nature, 393:440, 1998.
- [24] S. Zhou and R. Mondragón. Structural constraints in complex networks. New J. of Physics, 9(173), 2007.
- [25] S. Zhou and R. J. Mondragón. Accurately modelling the Internet topology. Phys. Rev. E, 70(066108), 2004.
- [26] S. Zhou and R. J. Mondragón. The rich-club phenomenon in the Internet topology. IEEE Comm. Lett., 8(3):180–182, 2004.