Proper Motions of OH Masers and Magnetic Fields in Massive Star-Forming Regions
Abstract
We present data of proper motions of OH masers in the massive star-forming regions ON 1, K3-50, and W51 Main/South. OH maser motions in ON 1 are consistent with expansion at approximately km s-1, likely tracing the expanding ultracompact H II region. Motions in K3-50 are faster and may be indicating the final stages of OH maser emission in the source, before the OH masers turn off as the H II region transitions from the ultracompact to the compact phase. W51 South shows indications of aspherical expansion, while motions in W51 Main are more difficult to interpret. Nevertheless, it appears that the relative projected separation between W51 Main and W51 South is decreasing, corresponding to an estimate of enclosed mass of at least , consistent with estimates derived from millimeter-wavelength dust emission. We confirm the mG magnetic fields previously seen in W51 Main, which may represent the upper end of the density range allowable for 1665 MHz maser emission. Magnetic field strengths and directions, obtained from Zeeman splitting, in each source are consistent with values obtained in the first epoch four to nine years ago.
Subject headings:
masers — ISM: kinematics and dynamics — ISM: molecules — magnetic fields — radio lines: ISM — stars: formation1. Introduction
Maser proper motion observations are a useful tool for understanding the environment of nascent high-mass stars. Masers serve as bright, pointlike tracers of the conditions in the surrounding molecular material, and detecting proper motions allows the observer to determine the characteristics of the velocity field on small scales. Water maser proper motions have been observed for a quarter century (Genzel et al., 1981a, b), and methanol masers are increasingly being observed for proper motion experiments as well (e.g., Moscadelli et al., 1999; Minier et al., 2001). Hydroxyl (OH) masers are common in massive star-forming regions (SFRs), but proper motions of the ground-state OH transitions at cm are more difficult to detect because the angular resolution of a radio array scales inversely with wavelength. For this reason, only a few massive SFRs have observed OH maser proper motions: W3(OH) (Bloemhof et al., 1992; Wright et al., 2004) and W75 N (Fish & Reid, 2007) using very long baseline interferometric (VLBI) techniques, and the nearby sources Orion (Migenes, 1989) and Cepheus A (Migenes et al., 1992) using connected-element interferometry. When available, VLBI observations are preferred due to the much smaller synthesized beam size, which allow for more precise positional measurements and reduced blending of maser spots within the synthesized beam.
Of these sources, the best studied is W3(OH). Bloemhof et al. (1992) clearly established that the OH masers are expanding at 3–5 km s-1, which is also the expansion rate of the ultracompact H II region with which they are associated (Kawamura & Masson, 1998). The maser locations and slow expansion support the Elitzur & de Jong (1978) model in which OH masers form between the ionization front of an H II region and the shock front ahead of it. Later observations by Wright et al. (2004) confirm the expansion and detect a rotational component to the motion as well, which is supported by VLBI observations of the 6.0 GHz excited-state OH masers in W3(OH) (Fish & Sjouwerman, 2007).
This work is motivated by the question of whether expansion, as seen in W3(OH), is the dominant mode of OH maser motions. A recent VLBA survey of the OH masers in massive SFRs provides an adequate starting point and a first epoch of positional data for a larger sample of proper motion measurements (Fish et al., 2005a). An analysis of the proper motions in one source, W75 N, has already been published (Fish & Reid, 2007). In this article we present proper motions determined from a second epoch of observations of the three sources with the simplest proper motions: ON 1, K3-50, and W51 Main/South.
It is important to know the distance to a source in order to convert proper motions, measured in angle units, into velocities. Distance measurements toward some sources span a wide range of values. We have adopted a distance of 3.0 kpc to ON 1 (Araya et al., 2002), although values quoted in the literature range up or down from this value by about a factor of 2 (e.g., Genzel & Downes, 1977; Israel & Wootten, 1983). For K3-50 we have assumed a distance of 8.7 kpc; quoted distances range from less than 8.0 to 9.0 kpc (Harris 1975 and references therein). We assume a distance to W51 of 7.0 kpc (Genzel et al., 1981b) for consistency with previous work, although more recent observations of H2O maser kinematics suggest a distance of kpc (Imai et al., 2002), which is also consistent with this distance. Since velocities and lengths (in physical rather than angular units) scale linearly with distance, these quantities can be easily adjusted to correspond to better distance determinations in the future.
2. Observations and Data Analysis
| Epoch 1 | Epoch 2 | ||||
|---|---|---|---|---|---|
| Epoch 1 | Epoch 2 | Freq. | Beam | Beam | |
| Source | Date | Date | (MHz) | (mas) | (mas) |
| ON 1 | 2000 Nov 22/2001 Jan 06 | 2004 Sep 16/19 | 1665 | ||
| 1667 | |||||
| K3-50 | 2000 Nov 22/2001 Jan 06 | 2004 Sep 16/19 | 1665 | ||
| 1667 | |||||
| W51 | 1996 Mar 01/02 | 2005 May 15 | 1665 | ||
| 1667 | |||||
| 1720 |
Note. — Results from the first epoch are already published in Fish et al. (2005a).
Three sources were observed with the VLBA: ON 1 (G69.5400.976), K3-50 (G70.2931.601), and W51 Main/South (G49.4880.387). Both the 1665.40184 and 1667.35903 MHz main-line (-conserving), ground-state () transitions of OH were observed. In the first epoch, ON 1 and K3-50 were observed on two days with complementary -coverage (experiment BF064). Naturally-weighted images made from the combined data have previously been published by Fish et al. (2005a). The observations were taken with 125 kHz bandwidth divided into 128 spectral channels, for a velocity width of 0.176 km s-1 per channel. A second epoch of data (BF079) were obtained with identical observational parameters, with the exception that the LSR velocity was shifted by 3 km s-1 for all sources due to an error in observe file preparation. This was corrected in post-correlation calibration. As for the first epoch, the data from the two days of the second epoch were combined before imaging. Observing parameters are summarized in Table 1.
In the first epoch of data for W51 (BR039), a 250 kHz bandwidth was used instead in order to cover the larger velocity range of OH maser features in this source. Data for the second epoch (BF085) were taken using the same bandwidth but with twice the velocity resolution, providing a velocity width of 0.176 km s-1 per channel. In the second epoch, observations of the calibrator J1922+1530 were included for phase referencing. A cycle between the calibrator and source consisted of 80 seconds dwell time on the calibrator and 200 seconds dwell time on W51. The 1720.52998 MHz () line of OH was also observed in the second epoch.
The data were reduced as described in the appendix of Fish et al. (2005a). Images were self-calibrated using the brightest maser feature in one circular polarization of one transition, and this calibration was applied to both polarizations. Additionally, calibration at 1665 MHz was applied to the 1667 MHz transition. Therefore, the relative positions of masers in different polarizations in the 1665 and 1667 MHz transitions within the same epoch are extremely well known. The absolute positions of maser features in each epoch, and therefore the absolute motions of maser features between epochs, are unknown. However, we were able to obtain absolute coordinates for the masers in W51 in the second epoch.
In W51, a bright maser channel was used at 1667 MHz LCP and 1720 MHz RCP to phase reference the calibrator source J1922+1530. Periods of poor phase stability or large fringe rates were flagged, and images of J1922+1530 were made from the remaining data. The offset of J1922+1530 from the position in the VLBA calibrator list111http://www.vlba.nrao.edu/astro/calib/vlbaCalib.txt was used to determine the absolute positions of the reference maser features as well as the relative alignment between the 1665/1667 and 1720 MHz maser data.
Maser spot positions were determined by fitting Gaussians to the brightest channel of emission for each feature. An alternate method of determining maser positions in each epoch is to use a flux-weighted average of the position across all spectral channels for a maser spot. However, the small advantage gained from the increased positional accuracy due to a larger integrated flux is offset by position wander across the line profile and by inclusion of weaker channels in the line wings, whose apparent positions are more apt to be affected by blending with nearby maser spots. As a test, maser positions in ON 1 and K3-50 were determined in both epochs using both methods. Within an epoch, individual maser positions obtained from the two methods agreed nearly always to better than 1 mas and frequently to better than 0.2 mas. Larger deviations were usually due to contamination in a line wing due to blending with a nearby ( beam widths) maser spot. Since the brightest-channel method is simpler and less susceptible to contamination, this method was preferred. In any case, proper motion maps produced by the brightest-channel method were qualitatively similar to those produced by the total-flux method.
Maser motions were identified by aligning the two epochs of data and finding masers that matched closely in position, velocity, and dominant circular polarization. Source-scale motions can introduce offsets that differ with location in a map but are similar for groups of maser spots; these motions are of particular interest in this work. Velocity tolerances were typically about a channel width, with greater tolerance for particularly broad masers or weak masers whose line width could not be determined (usually due to lack of detection in three consecutive channels or spatial blending with another feature). Maser “echoes” (a weak detection at the same position and velocity but opposite circular polarization as a stronger feature; see Fish et al. (2006a)) were excluded, as were any spots that could not be unambiguously identified with a single spot in the other epoch.
3. Results
3.1. ON 1
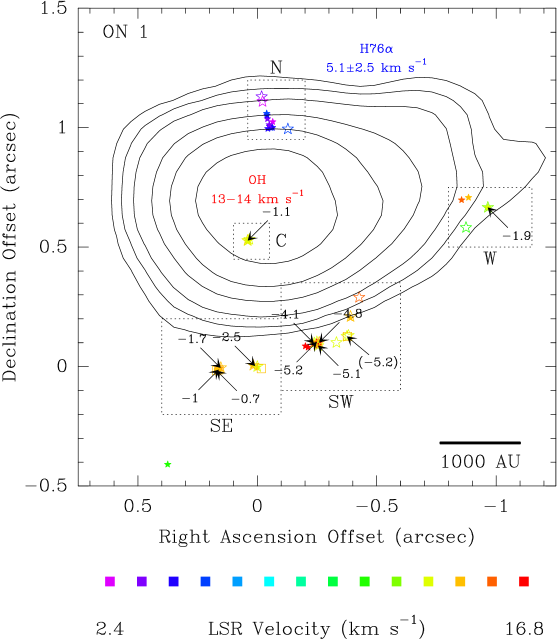
Detected masers are listed in Table 2 and shown in figure 1. Our map agrees with that obtained from MERLIN data by Nammahachak et al. (2006). We find masers near all but one of their features brighter than 610 mJy, although some of the masers in the western and southern parts of ON 1 are marginal detections (i.e., too weak to be detected above 7 in three consecutive channels) in our data. We recover 8 of the 11 Zeeman pairs detected in the first epoch and one component in each of the remaining three pairs (see Figure 19 of Fish et al., 2005a). In two Zeeman pairs, the weaker component would be near or below our detection threshold in the second epoch, assuming the flux density did not change between epochs. We also find a new Zeeman pair at 1665 MHz ( RA = mas RCP and LCP) and another at 1667 MHz (169.53 RCP and 170.54 LCP) that were not present in our data from the first epoch. Magnetic field strengths are consistent to within 0.3 mG between epochs, with six Zeeman pairs indicating magnetic field strengths consistent to within 0.1 mG or better.
A reanalysis of data from the first epoch uncovers several spots missed in Fish et al. (2005a). The far western region was not imaged; spots detected in this area in the first epoch reanalysis include an LCP feature at and two RCP features at and , where spatial offsets are in milliarcseconds from the reference feature in the first epoch and LSR velocities indicate the velocity of the peak channel of emission in kilometers per second. Additionally, a very weak (76 mJy beam-1) LCP feature is found in a single channel to the southeast at . This feature did not meet our detection criteria since it does not appear in two consecutive channels, but it does correspond to an identical feature detected in the second epoch, also very weak and only detected in one channel, and in the MERLIN observations by Nammahachak et al. (2006).

Figure 2 shows the recovered maser spectra for ON 1. In each spectral channel, the fitted maser emission is summed and displayed. This is different from total power spectra in that only emission recovered from fitting is summed; for instance, the recovered emission in a channel with no detected masers is identically zero. The spectra are qualitatively similar to those found in Argon et al. (2000), noting their different flux convention and an erroneous 1 km s-1 shift in their spectra for this source only. Differences in the spectra are likely due to maser variability, although the Argon et al. (2000) spectra may underestimate total flux density when multiple masing regions are seen at the same LSR velocity (see their §5).
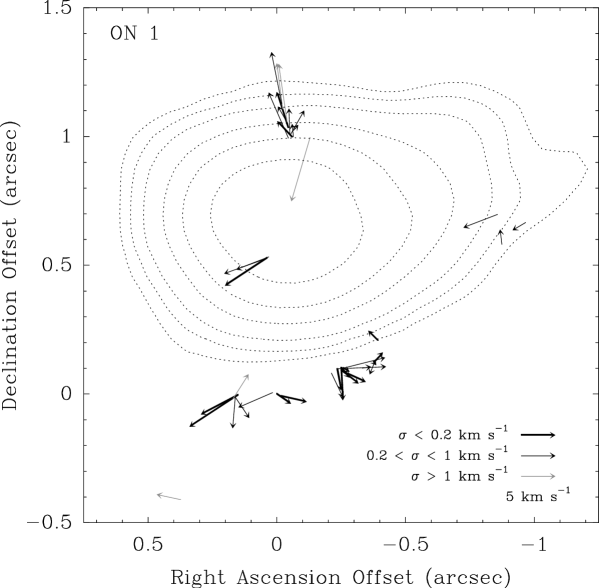
Figure 3 shows a map of motions of maser spots detected in both epochs. Arrow weight and color indicate the random errors in velocity determination based on the signal-to-noise ratio in each epoch. There is also an absolute positional error associated with the registration of maser positions between epochs. As described in §2, our data are consistent with any map that differs from that shown by the addition of a single constant vector to all motions. Since our data were not phase-referenced, we do not know the absolute locations of our reference maser feature in each epoch (which is equivalent to the constant vector of motion of the reference feature). In Figure 3, the constant vector has been chosen to minimize the total length of all vectors, weighted by the square of the effective brightness of each maser spot. This vector corresponds to a motion of km s-1 toward the East and km s-1 toward the North, in a frame in which the reference maser spot at the origin is stationary. The constant vector is not highly sensitive to the weighting used; weighting by the first power of the effective brightness or using constant (equal) weights for all maser spots results in similar maps to within km s-1.
In order to minimize confusion, it is useful to clearly define several terms that will be used henceforth to quantify maser motions. Consider two maser spots, and , each detected in epochs 1 and 2. The separation of the two maser spots is defined to be , where the subscript refers to the epoch (1 or 2) and the superscript identifies the maser spot. This quantity has units of angle (milliarcseconds). The change in separation of the pair of maser spots is defined to be . The pairwise expansion velocity (measured in km s-1) of spots and is , where is the distance to the source and is the time between the two epochs of observations. The pairwise expansion velocity is positive if the change in separation is positive, i.e., if the two masers have moved apart from each other.
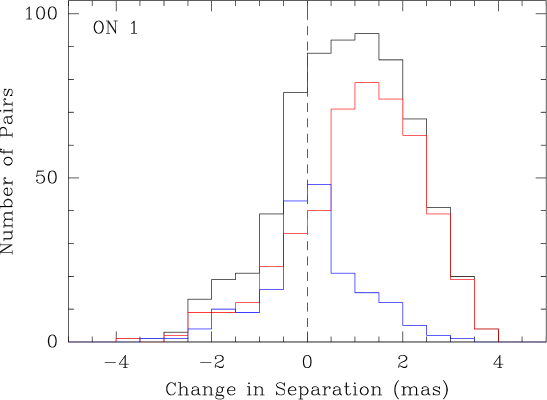
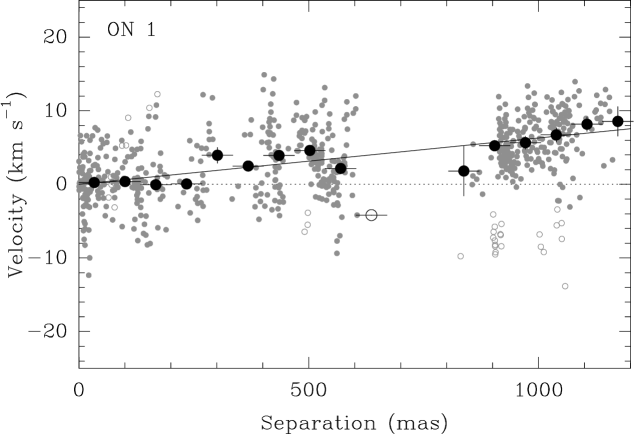
Figure 4 shows a histogram of the change in pairwise separation () of maser spots in ON 1 in groups N, C, SW, and SE. As discussed in Bloemhof et al. (1992), this allows a model-independent and non-parametric test for expansion or contraction. The distribution is biased toward positive shifts, indicating that net expansion is occurring. The expansion is even more noticeable when pairs containing two maser spots in the same group are excluded. The distribution of the change in separation of pairs containing two maser spots within the same group is centered near zero. This suggests that motions within a group are coherent, while expansion dominates on larger scales. A plot of this expansion is presented in Figure 5, which shows the expansion velocity of pairs of maser spots as a function of their separation for pairs of maser spots and . The line of best fit gives an expansion rate of km s-1 mas-1 (D = 3.0 kpc), or km s-1 pc-1. Assuming that the motion of the masers near the southern limb of ON 1 is mostly in the plane of the sky, this suggests that the expansion velocity of the masers is 4 – 5 km s-1, comparable to a typical maser motion in ON 1 (Fig. 3) as well as the expansion velocity of the OH masers in W3(OH) (Bloemhof et al., 1992).
Approximately 83% of maser motions are consistent with expansion (i.e., oriented in a semicircle away from the expansion center), with the remainder consistent with contraction. However, this is not a robust statistic, as the percentages depend on the constant vector of motion, which is not known a priori.
The H76 recombination line velocity of the H II region is km s-1 (Zheng et al., 1985). This seems to suggest that the southern and central masers in ON 1 are redshifted with respect to the H II region and the northern masers are slightly blueshifted (Figure 5). From the relative LSR velocities of the OH masers and the H II region, Zheng et al. (1985) concluded that the OH masers are still undergoing infall toward the central (proto)star. Indeed, the LSR velocity of the central group of masers is 13.1–13.9 km s-1, which is redshifted compared to the central condensation. This maser cluster is probably located in front of the H II region, the core of which may be optically thick in continuum emission (Zheng et al., 1985). (While the northern group and possibly some masers in the southern group appear to be projected atop the H II region as well, possible registration errors of a few tenths of an arcsecond between the maser and continuum maps prevent a definitive determination of their location along the line of sight with respect to the H II region.) However, optical depth effects may dominate determination of the systemic velocity from hydrogen recombination lines (Berulis & Ershov, 1983; Welch & Marr, 1987; Keto et al., 1995). Indeed, the velocity as determined from ammonia observations is 11.6 km s-1 (Harju et al., 1993). It is otherwise difficult to reconcile the net expansion we observe in the maser motions with the contraction that Zheng et al. (1985) deduce from their recombination line velocity. The difference in LSR velocity between the northern maser group and the rest of the masers can be explained if, for instance, large-scale rotation contributes to the maser motions as well.
The scatters in the proper motions in Right Ascension and Declination () are mas and mas, respectively. At a source distance of 3.0 kpc, these correspond to a velocity scatter of km s-1 and km s-1. The scatter in the distribution of the LSR velocities of the same set of masers is km s-1, a value that does not change when the velocities of the central and southern clusters of masers are corrected for the effects of Zeeman splitting (i.e., “demagnetized”). This high scatter is almost entirely due to the fact that ground-state OH maser LSR velocities in ON 1 appear in disjoint velocity ranges centered near 4 km s-1 and 14 km s-1, with no masers at intermediate velocities.
It is not surprising that , since the observed OH maser clumps are preferentially distributed in the north-south (Declination) direction. In any case, the uncertainty in the distance to the source corresponds to a factor of two uncertainty in and , precluding any conclusive determination of whether the expansion velocity of the masers along the line of sight is significantly different from that in either transverse direction.
3.2. K3-50
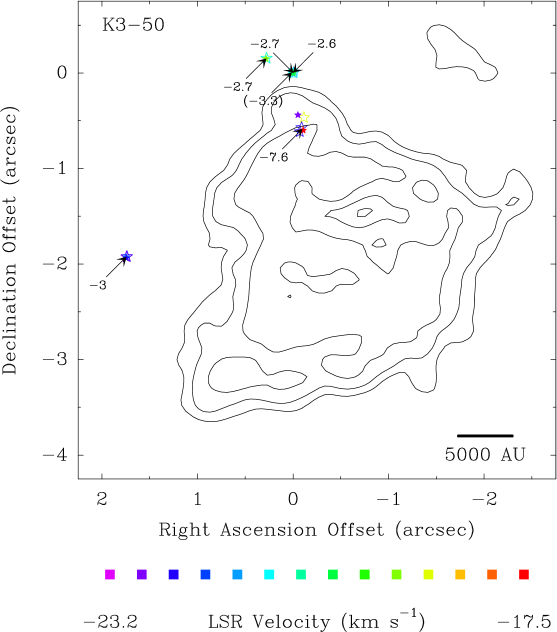
Detected masers in K3-50 are listed in Table 3 and shown in Figure 6. The magnetic fields derived from Zeeman splitting have not changed since the first epoch of observations. We recover five of the six Zeeman pairs detected in the first epoch (see Figure 21 of Fish et al., 2005a). The magnetic field strengths obtained in the second epoch agree with those obtained in the first epoch to 0.1 mG or better. This is within the errors in determining the central velocity of the -components of a Zeeman pair from our data. Magnetic field values are in excellent agreement with Zeeman pairs obtained from VLA observations in 1993 (Argon et al., 2000; Fish et al., 2003). The recovered maser spectrum (Fig. 7) also closely matches the VLA spectrum of Argon et al. (2000).
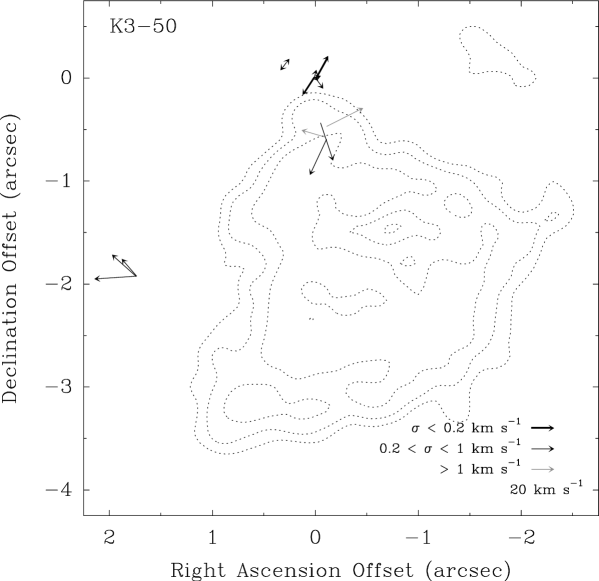
Proper motions of the OH masers in K3-50 are shown in Figure 8. As for ON 1, we have chosen the constant vector to minimize the total of proper motion vector lengths, weighted by the square of the effective brightness. Figure 9 shows a histogram of the change in pairwise separation of maser spots in K3-50. As with ON 1, there is a general trend for maser separations to increase with time, indicative of expansion, although the magnitude of the motions is larger. About 60% of the motions are consistent with expansion (with the large caveat noted in § 3.1).

A major limitation of the analysis is that masers are found only at or near the northern limb of the H II region and offset to the east of the H II region. With such small areal coverage, it is difficult to draw conclusions as to the large-scale motions around the H II region. Nevertheless, it does appear that the motion of the eastern clump of masers is directed away from the H II region.
The environment of K3-50 A is complicated and energetic. From continuum and radio recombination line data, de Pree et al. (1994) report a high-velocity bipolar outflow at position angle with a velocity gradient of 6 km s-1 arcsec-1 across K3-50 A increasing from the southeast to the northwest. Hofmann et al. (2004) find evidence of at least ten stars in K3-50 A, including at least seven in the central square arcsecond. Mid-infrared imaging indicates that there may be three ionizing sources in the H II region, although none are coincident with the OH maser locations (Okamoto et al., 2003).

3.3. W51
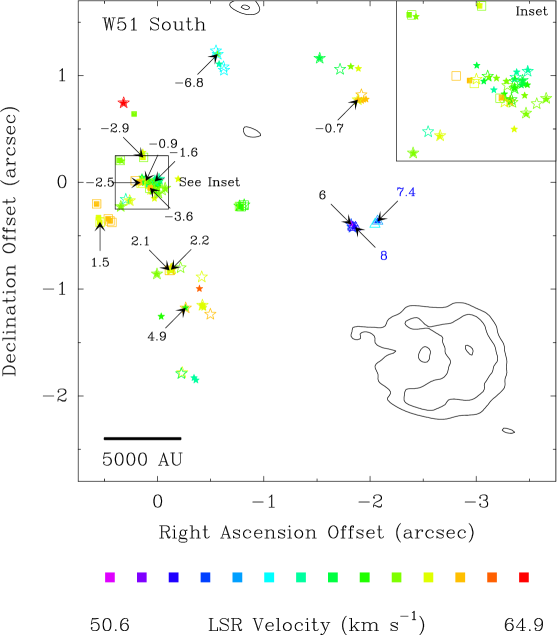
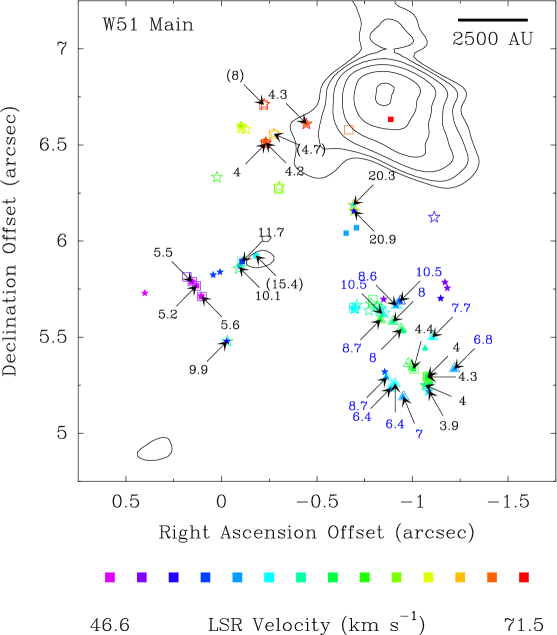
Detected maser spots in W51 South and Main are listed in Tables 4 and 5 and shown in Figures 10 and 11, respectively. The relative positions of the 1665/1667 MHz and 1720 MHz frames were determined by analysis of the offsets from the calibrator source J1922+1530. The brightest maser in 1667 MHz LCP was used to phase reference the 1665/1667 MHz data because its spectral channel is free from other significant emission. The brightest maser at 1720 MHz RCP was used to determine the absolute positions of the 1720 MHz data. Zero right ascension and declination offsets in Tables 4 and 5 and Figures 10 and 11 corresponds to (J2000). Formal errors in determining the positions of the calibrator and maser spot are on the order of 1 mas, although ionospheric effects and possible source structure in the calibrator likely limit accuracy to approximately 10 mas.
The relative alignment of the 1720 MHz data with respect to the main-line masers closely matches that of Gaume & Mutel (1987) and is broadly consistent with the alignment determined by Benson et al. (1984). Our data indicate that the 1720 MHz masers are likely located several hundred milliarcseconds south of their locations in Argon et al. (2000) relative to the main-line masers. Our positions are also slightly south of the coordinates obtained by Gaume & Mutel (1987) after epoch precession.
The distribution of masers at 1720 MHz is unlike the distribution of main-line masers. Only six relatively weak (brightest 2.19 Jy beam-1) 1720 MHz masers are seen in W51 South, all in the west of the source. Magnetic field values are similar to, though slightly higher than, the magnetic field value obtained from the 1665 MHz Zeeman pair in this cluster. In contrast, there are numerous strong 1720 MHz masers in W51 Main, all located in the southwestern group of maser spots, with six masers brighter than 10 Jy beam-1. All 12 1720 MHz Zeeman pairs indicate a stronger magnetic field than any of the 5 main-line Zeeman pairs in the region. We have used a Zeeman splitting coefficient of 0.654 kHz mG-1 to obtain magnetic field strengths at 1720 MHz since only components produce detectable masers (Fish et al., 2006a).
The large ( mG) magnetic fields seen in the 1665 MHz masers in W51 Main (see Figure 18 of Fish et al., 2005a) persist in the second epoch. Small changes in the magnetic field strength estimates of these two Zeeman pairs ( and mG) may not be significant due to the coarse velocity resolution used in the first epoch. We also identify a second cluster of maser spots in which the magnetic field strength exceeds 10 mG. The magnetic fields we derive in W51 Main and W51 South from the second epoch of data are qualitatively similar to those obtained from the first epoch. Zeeman pairings are occasionally ambiguous in the crowded cluster near the origin, but the pairs we identify agree in sign and approximate magnitude with features in the first epoch.
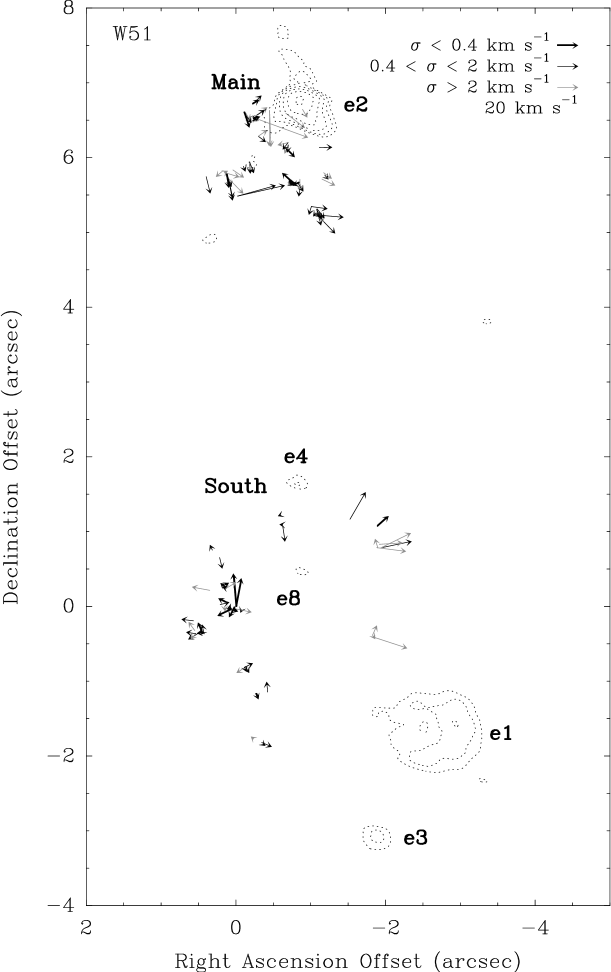
The W51 South region contains several continuum sources, including e1, e4, and e8 (discovered respectively by Scott, 1978; Gaume et al., 1993; Zhang et al., 1998). The strongest continuum source, e1, is offset from the maser emission to the southwest. Source e4 is located north of all masers in W51 South. The only 6035 MHz OH masers detected with VLBI techniques in W51 are a mG Zeeman pair located near source e4 (Desmurs & Baudry, 1998). Their total-power spectrum is suggestive of the existence of several other 6035 MHz masers, although it is unclear whether these would be associated with W51 d, W51 Main, or W51 South (see also Baudry et al., 1997). Source e8 is located approximately 2″ northeast of source e1, near the center of the distribution of OH maser spots in W51 South. Based on their detection of source e8 at cm but not at cm, Zhang & Ho (1997) speculate that the continuum flux is dominated by dust emission heated from a newly-formed massive star, a conclusion supported by its high flux density at mm (Lai et al., 2001) compared to centimeter-wave values. A very rare ammonia (NH3) maser is also seen near source e8 (Pratap et al., 1991). This indicates that the e8 region is very energetic, since it is believed that ortho-NH3 masers are pumped via vibrationally-excited states (Mauersberger et al., 1988; Brown & Cragg, 1991), located about 1000 K above the ground states.


Main-line OH maser motions are shown in Figure 12. The OH maser motions in W51 South are strongly suggestive of expansion (Figure 13), possibly of a shell centered near source e8. This contrasts with NH3 observations of source e1, which indicate radial contraction (Ho & Young, 1996). Zhang et al. (1998) claim that the material around the e8 core is contracting at a speed of 3.5 km s-1 based on line asymmetries in CS and CH3CN, although sources e1 and e8 are barely resolved by their beam. They also find evidence of rotation in the e8 core. To complicate matters further, Imai et al. (2002) find evidence of a bipolar outflow traced by H2O masers in W51 South but find that the source of the outflow is offset from sources e1, e4, and e8. Phillips & van Langevelde (2005) also find a 6668 MHz methanol maser located approximately halfway between sources e1 and e8.
The W51 Main region is associated with source e2, although most OH masers are detected to the east and south of this region. Source e2 appears to be contracting and rotating (Ho & Young, 1996; Zhang & Ho, 1997; Zhang et al., 1998; Sollins et al., 2004). While source e2 is the only identified continuum source in W51 Main, it is offset from the NH3 emission and OH masers located 1″ to the northeast and the H2O masers located 2″ to the north (Ho et al., 1983; Gaume et al., 1993). W51 Main also hosts an NH3 (9,6) maser (Madden et al., 1986; Wilson & Henkel, 1988; Pratap et al., 1991). As to the OH masers, the distribution of the change of separations peaks near zero but has a larger tail toward negative changes, nominally suggestive of contraction (Figure 14). Nevertheless, it is difficult to reconcile these two features of the distribution in terms of a single kinematic mode. It is probable that there exist several massive stars or protostellar condensations driving the masers (see Imai et al., 2002), and the disparity between the distributions of the 1720 MHz and main-line masers suggests that physical conditions vary significantly in W51 Main.
It appears that the relative separation between W51 Main and W51 South is decreasing. Figure 15 shows the change in separations between pairs of maser spots such that one spot is in W51 Main and the other is in W51 South. The distribution is peaked at less than zero. This can also be seen in Figure 12, in which the reference frame has been chosen to minimize the total motion in W51 South. In this frame, the motions of the masers in W51 Main are clearly biased toward W51 South.

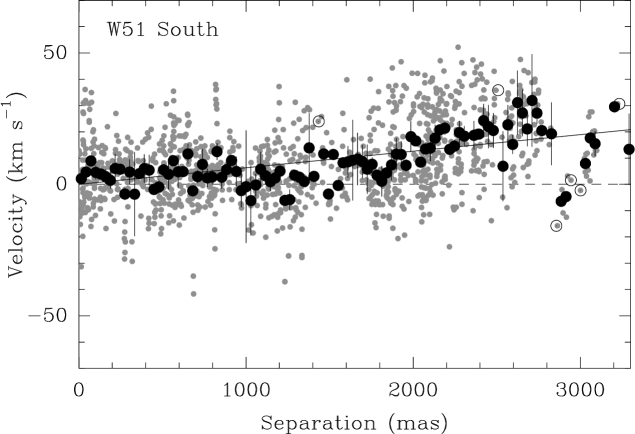


The plot of the relative pairwise expansion velocities of the masers in W51 South is shown in Figure 16. Interestingly, the proportionality constant between radius and expansion velocity is almost exactly the same as for ON 1. But the shell of masers in W51 South is larger than in ON 1, and the expansion velocities are correspondingly higher. The line of best fit corresponds to a velocity gradient of km s-1 pc-1. About two-thirds of maser motions are consistent with expansion (with the caveat noted in § 3.1).
The recovered maser emission in W51 is shown in Figure 17. As with ON 1 and K3-50, the recovered maser spectra are qualitatively similar to those of Argon et al. (2000). The range of maser LSR velocities is much greater in W51 Main than in W51 South, especially at 1667 MHz. The scatter in the distribution of the LSR velocities of the masers in W51 South is only km s-1 in W51 South, as compared to km s-1 in W51 Main. Although the magnetic fields in W51 Main are larger than in the typical interstellar OH maser source, drops only to km s-1 when maser velocities are demagnetized, indicating that the LSR velocity scatter is due almost exclusively to dynamical (rather than magnetic) effects.
In contrast, the scatter in changes in position of the masers in W51 South and W51 Main are almost identical. In W51 South the scatter in the change in Right Ascension is mas and the scatter in the change in Declination is mas; in W51 Main, mas and mas. At a distance of 7.0 kpc, this corresponds to km s-1 and km s-1 for both W51 South and W51 Main. In W51 Main, , an effect noted in W3(OH) as well (Bloemhof et al., 1992). But in W51 South, . It is probable that the expansion of the masers in W51 South is not spherical. For example, Imai et al. (2002) note from water maser proper motions the possibility of a bipolar outflow in W51 South. An expanding shell model with maser emission only from the limbs could also produce , although the LSR velocities of the masers in W51 South, especially the blueshifted 1720 MHz masers, argue against this interpretation.
4. Discussion
4.1. Proper Motions
A matter of great importance is whether observed maser proper motions are due to motions of the masing material or due to nonkinematic effects, such as travelling excitation waves or random coherence in a turbulent medium. In the former case, masers can be used as point tracers of the motions of the material surrounding the central condensation of a massive SFR. But if masers arise from travelling excitation phenomena, their apparent motions do not necessarily correlate with material motions.
Several lines of evidence support the kinematic interpretation of maser proper motions. First, proper motions and radial velocities have been used to estimate source distances () from internal dynamics with great success (e.g., Genzel et al., 1981b). This requires that, on average, , indicating that motions of brightness peaks are intrinsically related to Doppler shifts. Second, proper motions of OH masers in W3(OH) show an organized, large-scale expansion and rotation (Bloemhof et al., 1992; Wright et al., 2004). If masers are merely chance lines of velocity coherence in a turbulent medium, large-scale organization would not be expected. Third, maser spots in W3(OH) are observed to preserve their shape over time, suggesting that the masers are physically distinct regions of material (Bloemhof et al., 1996; Moscadelli et al., 2002). Fourth, measurements of excited-state OH absorption in several massive star-forming regions suggest that the magnetic field of gas traced by OH masers is stronger than that traced by absorption (Fish et al., 2005b, 2006b). Since the density scales approximately as (e.g., Fiebig & Güsten, 1989; Crutcher, 1999), this implies that masers are denser than the surrounding, non-masing gas. This in turn suggests that masers are physically distinct entities whose observed motions are real material motions.
In both ON 1 and K3-50, the pairwise separation between maser spots is increasing. The same phenomenon is seen in W3(OH) (Bloemhof et al., 1992; Wright et al., 2004). All of these sources have mature ultracompact H II regions, which are probably in expansion. Indeed, the expansion of the UCH II region in W3(OH) has been detected directly from multiepoch observations of the continuum emission (Kawamura & Masson, 1998), and the expansion speed is comparable to that determined from OH maser proper motions. This is consistent with models in which OH masers are located in the heated neutral gas between the ionization and shock fronts of an H II region (Baldwin et al., 1973; Elitzur & de Jong, 1978), a picture supported by multiple lines of observational evidence (e.g., Fish & Reid, 2006). As the H II region expands, the masers expand with it.
Maser proper motions in K3-50 appear to be faster than in ON 1, even accounting for the large uncertainty in the distance to the latter. The continuum source K3-50A is much larger than the H II region in ON 1, indicating that K3-50 is more evolved. In fact, the diameter of the continuum region is approximately 0.15 pc, which is comparable to the size of a hot ammonia core (Vogel et al., 1987; Hüttemeister et al., 1993; de Pree et al., 1995). This is approximately the size limit (0.1–0.15 pc) beyond which ultracompact H II regions, which often have OH masers, become compact H II regions, which do not (Habing & Israel, 1979). The proper motions of the masers in K3-50 are approximately twice the speed of sound in a typical H II region ( km s-1; Shu 1992), indicating that the ionization front may be nearly R-critical. As this front continues expanding outward into a less dense medium, it will accelerate, transitioning from a D-type shock (with shocked neutral gas between the ionization and shock fronts) to an R-type shock (in which the ionization and shock fronts are coincident), thereby destroying the OH masers. It is possible that this has already happened on the south and west sides of the H II region K3-50A, where no OH masers are found. Of course, we cannot rule out that the masers in K3-50 may be powered by younger, undetected hypercompact H II regions instead.
In the expansion velocity plots of ON 1 and W51 South (Figures 5 and 16), OH maser proper motions imply a velocity gradient on the order of several hundred km s-1 pc-1. Relative motions of the northern and eastern clusters of masers in K3-50 imply a velocity gradient of similar magnitude. Gradients in LSR velocity in ON 1 and W51 Main are also several hundred km s-1 pc-1. For comparison, the escape velocity is km s-1 , where is the enclosed mass in solar masses and is the radius of the region in parsecs. For reasonable values in a massive star-forming region ( in 0.06 pc for W51 e2 Zhang & Ho, 1997) the expected velocity gradient is km s-1 pc-1 for . On larger scales, the velocity gradient decreases provided that the enclosed mass grows more slowly than , while the velocity gradient increases on smaller scales.
The relative proper motion of W51 Main and South, km s-1 at a projected separation of pc, yields a minimum enclosed mass estimate of , assuming that the two sources are gravitationally bound. This is in line with estimates from millimeter-wavelength dust emission. Rudolph et al. (1990) obtain mass estimates of and for W51 e1 and e2, respectively, from their dust emission at mm, assuming clump temperatures of 100 K and a dust emissivity of 1.5 (emission ) based on millimeter and submillimeter observations of W51 e2. Interestingly, the 1.3 mm flux density of the e1/e2 region (20.8 Jy from dust, Lai et al., 2001) corresponds to a minimum () mass estimate of , using the formulation of Hildebrand (1983) and Ward-Thompson et al. (1995) and the dust absorption cross section of Beckwith et al. (1990). These results suggest that maser proper motion measurements may in some cases provide confirming mass estimates independent of those obtained from (sub)millimeter dust emission.
It is unclear what the expected a priori functional form of the expansion velocity plots should be. For organized expansion, the relative pairwise expansion velocity should increase as the separation between the two masers increases, as is observed. The functional form depends on such factors as the geometry and thickness of the maser region as well as the acceleration (or deceleration) of the expansion. The large scatter of points on these plots prevents a detailed analysis of these expansion parameters. Even on the largest scales, the scatter in pairwise expansion velocities is comparable to the regular component, indicating that the motions of masers in SFRs are affected by a large random component in addition to an organized kinematic mode such as expansion. Random motions are seen to be quite large in comparison with maser proper motions, as is noted in water maser motions as well in some sources, including W51 Main (e.g., Genzel et al., 1981b; Gwinn, 1994; Imai et al., 2002). Despite these limitations, it is clear that the data indicate a component of expansion, rather than contraction, and that this expansion can only be seen clearly on large scales. Notably, the data do not show expansion for pairwise separations on the order of cm, the clustering scale of OH masers in star-forming regions (Reid et al., 1980; Fish & Reid, 2006). If expanding at a typical neutral sound speed of km s-1, a cluster would double in size in less than 1000 years. The data suggest that the size of an OH maser cluster remains fairly stable over time.
4.2. Magnetic Fields
Magnetic field strengths imply reasonable densities for OH maser production. In molecular clouds, the magnetic field strength is seen to vary with H2 number density as , where (Crutcher, 1999). Taking a line-of-sight magnetic field strength mG at cm-3, typical full magnetic field strengths of less than about 5 mG correspond to densities less than cm-3 assuming random magnetic field orientations (in which case statistically). This density is comfortably within the range in which ground-state OH masers are predicted to appear (e.g., Pavlakis & Kylafis, 1996; Cragg et al., 2002). Our largest magnetic field strength of 20.9 mG would thus be expected to correspond to a density of several times cm-3, with an uncertainty of a factor of several due to the uncertainty in as well as the natural scatter of data points as seen in Figure 1 of Crutcher (1999). The highest density that can produce a detectable 1665 MHz maser depends on other parameters (such as gas and dust temperatures) but is approximately cm-3 in the Cragg et al. (2002) models. The scarcity of OH masers indicating magnetic fields of 20 mG or larger constitutes evidence in support of an upper limit of cm-3 for OH maser production. Confirmation of the previously-noted large magnetic field in W51 Main (Fish & Reid, 2006) is therefore an important result of the present work.
We find no evidence that the magnetic field strengths in ON 1 or K3-50 are changing with time over the 4-year baseline of our observations. Observations of Cep A over a span of more than 20 years have shown that the magnetic field strengths in two Zeeman pairs are decreasing with time (Cohen et al., 1990; Bartkiewicz et al., 2005). Cohen et al. speculate that the decrease in magnetic field strength is due to the expansion of the gas around the central star. Based on the rate of field decay, they estimate an expansion age of 500 yr for Cep A, which agrees with the 1000 yr age estimate for the young massive stars in Cep A by Hughes (1985). Both ON 1 and K3-50 are much older SFRs, with dynamical ages over 1000 and 5000 yr, respectively, based on the OH maser motions obtained in this work (and also reflected in the size of their H II regions). Thus it is not surprising that the magnetic field strengths in our sources are not observed to vary. As for W51 Main and South, Zeeman pairings are occasionally ambiguous due to the clustering of maser spots. However, the magnetic field strengths and directions we obtain are consistent with those deduced from the first epoch of observations 9 years previously.
References
- Argon et al. (2000) Argon, A. L., Reid, M. J., & Menten, K. M. 2000, ApJS, 129, 159
- Araya et al. (2002) Araya, E., Hofner, P., Churchwell, E., & Kurtz, S. 2002, ApJS, 138, 63
- Baldwin et al. (1973) Baldwin, J. E., Harris, C. S., & Ryle, M. 1973, Nature, 241, 38
- Bartkiewicz et al. (2005) Bartkiewicz, A., Szymczak, M., Cohen, R. J., & Richards, A. M. S. 2005, MNRAS, 361, 623
- Baudry et al. (1997) Baudry, A., Desmurs, J. F., Wilson, T. L., & Cohen, R. J. 1997, A&A, 325, 255
- Beckwith et al. (1990) Beckwith, S. V. W., Sargent, A. I., Chini, R. S., & Güsten, R. 1990, AJ, 99, 924
- Benson et al. (1984) Benson, J. M., Mutel, R. L., & Gaume, R. A. 1984, AJ, 89, 1391
- Berulis & Ershov (1983) Berulis, I. I., & Ershov, A. A. 1983, Soviet Astronomy Letters, 9, 341
- Bloemhof et al. (1992) Bloemhof, E. E., Reid, M. J., & Moran, J. M. 1992, ApJ, 397, 500
- Bloemhof et al. (1996) Bloemhof, E. E., Moran, J. M., & Reid, M. J. 1996, ApJ, 467, L117
- Brown & Cragg (1991) Brown, R. D., & Cragg, D. M. 1991, ApJ, 378, 445
- Carral et al. (1997) Carral, P., Kurtz, S. E., Rodríguez, L. F., de Pree, C., & Hofner, P. 1997, ApJ, 486, L103
- Churchwell et al. (1990) Churchwell, E., Walmsley, C. M., & Cesaroni, R. 1990, A&AS, 83, 119
- Cohen et al. (1990) Cohen, R. J., Brebner, G. C., & Potter, M. M. 1990, MNRAS, 246, 3P
- Cragg et al. (2002) Cragg, D. M., Sobolev, A. M., & Godfrey, P. D. 2002, MNRAS, 331, 521
- Crutcher (1999) Crutcher, R. M. 1999, ApJ, 520, 706
- de Pree et al. (1994) de Pree, C. G., Goss, W. M., Palmer, P., & Rubin, R. H. 1994, ApJ, 428, 670
- de Pree et al. (1995) de Pree, C. G., Rodríguez, L. F., & Goss, W. M. 1995, Rev. Mexicana Astron. Astrofis., 31, 39
- Desmurs & Baudry (1998) Desmurs, J. F., & Baudry, A. 1998, A&A, 340, 521
- Eisner et al. (2002) Eisner, J. A., Greenhill, L. J., Herrnstein, J. R., Moran, J. M., & Menten, K. M. 2002, ApJ, 569, 334
- Elitzur & de Jong (1978) Elitzur, M., & de Jong, T. 1978, A&A, 67, 323
- Fiebig & Güsten (1989) Fiebig, D., & Güsten, R. 1989, A&A, 214, 333
- Fish et al. (2006a) Fish, V. L., Brisken, W. F., & Sjouwerman, L. O. 2006a, ApJ, 647, 418
- Fish & Reid (2006) Fish, V. L., & Reid, M. J. 2006, ApJS, 164, 99
- Fish & Reid (2007) Fish, V. L., & Reid, M. J. 2007, ApJ, 656, 952
- Fish et al. (2003) Fish, V. L., Reid, M. J., Argon, A. L., & Menten, K. M. 2003, ApJ, 596, 328
- Fish et al. (2005a) Fish, V. L., Reid, M. J., Argon, A. L., & Zheng, X.-W. 2005a, ApJS, 160, 220
- Fish et al. (2005b) Fish, V. L., Reid, M. J., & Menten, K. M. 2005b, ApJ, 623, 269
- Fish et al. (2006b) Fish, V. L., Reid, M. J., Menten, K. M., & Pillai, T. 2006b, A&A, 458, 485
- Fish & Sjouwerman (2007) Fish, V. L., & Sjouwerman, L. O. 2007, ApJ, in press, arXiv: 0706.3314
- Gaume et al. (1993) Gaume, R. A., Johnston, K. J., & Wilson, T. L. 1993, ApJ, 417, 645
- Gaume & Mutel (1987) Gaume, R. A., & Mutel, R. L. 1987, ApJS, 65, 193
- Genzel & Downes (1977) Genzel, R., & Downes, D. 1977, A&AS, 30, 145
- Genzel et al. (1981a) Genzel, R., Reid, M. J., Moran, J. M., & Downes, D. 1981a, ApJ, 244, 884
- Genzel et al. (1981b) Genzel, R., et al. 1981b, ApJ, 247, 1039
- Gwinn (1994) Gwinn, C. R. 1994, ApJ, 429, 241
- Habing & Israel (1979) Habing, H. J., & Israel, F. P. 1979, ARA&A, 17, 345
- Harju et al. (1993) Harju, J., Walmsley, C. M., & Wouterloot, J. G. A. 1993, A&AS, 98, 51
- Harris (1975) Harris, S. 1975, MNRAS, 170, 139
- Hildebrand (1983) Hildebrand, R. H. 1983, QJRAS, 24, 267
- Ho et al. (1983) Ho, P. T. P., Das, A., & Genzel, R. 1983, ApJ, 266, 596
- Ho & Young (1996) Ho, P. T. P., & Young, L. M. 1996, ApJ, 472, 742
- Hofmann et al. (2004) Hofmann, K.-H., Balega, Y. Y., Preibisch, T., & Weigelt, G. 2004, A&A, 417, 981
- Hofner & Churchwell (1996) Hofner, P., & Churchwell, E. 1996, A&AS, 120, 283
- Hughes (1985) Hughes, V. A. 1985, ApJ, 298, 830
- Hüttemeister et al. (1993) Hüttemeister, S. Wilson, T. L., Henkel, C., & Mauersberger, R. 1993, A&A, 276, 445
- Imai et al. (2002) Imai, H., Watanabe, T., Omodaka, T., Nishio, M., Kameya, O., Miyaji, T., & Nakajima, J. 2002, PASJ, 54, 741
- Israel & Wootten (1983) Israel, F. P., & Wootten, H. A. 1983, ApJ, 266, 580
- Kawamura & Masson (1998) Kawamura, J. H., & Masson, C. R. 1998, ApJ, 509, 720
- Keto et al. (1995) Keto, E. R., Welch, W. J., Reid, M. J., & Ho, P. T. P. 1995, ApJ, 444, 765
- Kurtz & Franco (2002) Kurtz, S., & Franco, J. 2002, Rev. Mexicana Astron. Astrofis. Ser. Conf., 12, 16
- Lai et al. (2001) Lai, S.-P., Crutcher, R. M., Girart, J. M., & Rao, R. 2001, ApJ, 561, 864
- Madden et al. (1986) Madden, S. C., Irvine, W. M., Matthews, H. E., Brown, R. D., & Godfrey, P. D. 1986, ApJ, 300, L79
- Mauersberger et al. (1988) Mauersberger, R., Henkel, C., & Wilson, T. L. 1988, A&A, 205, 235
- Mehringer (1994) Mehringer, D. M. 1994, ApJS, 91, 713
- Migenes (1989) Migenes, V. 1989, Ph.D. Thesis
- Migenes et al. (1992) Migenes, V., Cohen, R. J., & Brebner, G. C. 1992, MNRAS, 254, 501
- Minier et al. (2001) Minier, V., Booth, R. S., Ellingsen, S. P., Conway, J. E., & Pestalozzi, M. R. 2001, Proceedings of the 5th European VLBI Network Symposium, Chalmers University of Technology, Gothenburg, Sweden, eds. J.E. Conway, A.G. Polatidis, R.S. Booth, Y. Pihlström, 178
- Moscadelli et al. (1999) Moscadelli, L., Menten, K. M., Walmsley, C. M., & Reid, M. J. 1999, ApJ, 519, 244
- Moscadelli et al. (2002) Moscadelli, L., Menten, K. M., Walmsley, C. M., & Reid, M. J. 2002, ApJ, 564, 813
- Nammahachak et al. (2006) Nammahachak, S., Asanok, K., Hutawarakorn Kramer, B., Cohen, R. J., Muanwong, O., & Gasiprong, N. 2006, MNRAS, 371, 619
- Okamoto et al. (2003) Okamoto, Y. K., Kataza, H., Yamashita, T., Miyata, T., Sako, S., Takubo, S., Honda, M., & Onaka, T. 2003, ApJ, 584, 368
- Pavlakis & Kylafis (1996) Pavlakis, K. G., & Kylafis, N. D. 1996, ApJ, 467, 309
- Phillips & van Langevelde (2005) Phillips, C. J., & van Langevelde, H. J. 2005, Ap&SS, 295, 225
- Pratap et al. (1991) Pratap, P., Menten, K. M., Reid, M. J., Moran, J. M., & Walmsley, C. M. 1991, ApJ, 373, L13
- Reid et al. (1980) Reid, M. J., Haschick, A. D., Burke, B. F., Moran, J. M., Johnston, K. J., & Swenson, G. W., Jr. 1980, ApJ, 239, 89
- Rudolph et al. (1990) Rudolph, A., Welch, W. J., Palmer, P., & Dubrulle, B. 1990, ApJ, 363, 528
- Scott (1978) Scott, P. F. 1978, MNRAS, 183, 435
- Shepherd et al. (1997) Shepherd, D. S., Churchwell, E., & Wilner, D. J. 1997, ApJ, 482, 355
- Shu (1992) Shu, F. H. 1992, Physics of Astrophysics, Vol. II (Sausalito, CA: University Science Books)
- Sollins et al. (2004) Sollins, P. K., Zhang, Q., & Ho, P. T. P. 2004, ApJ, 606, 943
- Vogel et al. (1987) Vogel, S. N., Genzel, R., & Palmer, P. 1987, ApJ, 316, 243
- Ward-Thompson et al. (1995) Ward-Thompson, D., Chini, R., Krügel, E., André, P., & Bontemps, S. 1995, MNRAS, 274, 1219
- Welch & Marr (1987) Welch, W. J., & Marr, J. 1987, ApJ, 317, L21
- Wilson & Henkel (1988) Wilson, T. L., & Henkel, C. 1988, A&A, 206, L26
- Wright et al. (2004) Wright, M. M., Gray, M. D., & Diamond, P. J. 2004, MNRAS, 350, 1253
- Zhang & Ho (1997) Zhang, Q., & Ho, P. T. P. 1997, ApJ, 488, 241
- Zhang et al. (1998) Zhang, Q., Ho, P. T. P., & Ohashi, N. 1998, ApJ, 494, 636
- Zheng et al. (1985) Zheng, X. W., Ho, P. T. P., Reid, M. J., & Schneps, M. H. 1985, ApJ, 293, 522
| R.A. | Decl. | aaLSR velocity, line width, and brightness are fitted quantities when available. When a maser has not been detected in at least three channels including at least one channel on either side of the peak, no line width is given, and the brightness and LSR velocity refer to the channel of brightest emission. | aaLSR velocity, line width, and brightness are fitted quantities when available. When a maser has not been detected in at least three channels including at least one channel on either side of the peak, no line width is given, and the brightness and LSR velocity refer to the channel of brightest emission. | BrightnessaaLSR velocity, line width, and brightness are fitted quantities when available. When a maser has not been detected in at least three channels including at least one channel on either side of the peak, no line width is given, and the brightness and LSR velocity refer to the channel of brightest emission. | Feature | |
|---|---|---|---|---|---|---|
| (mas) | (mas) | Pol. | (km s-1) | (km s-1) | (Jy beam-1) | NumberbbCorresponding maser feature number in Fish et al. (2005a). |
| 1665 MHz | ||||||
| 965.68 | 666.00 | R | 11.89 | 0.28 | 0.72 | ccSee §3.1. |
| 965.25 | 665.92 | L | 11.88 | 0.29 | 0.66 | |
| 964.88 | 665.67 | L | 13.04 | 0.11 | ||
| 884.60 | 707.53 | L | 13.75 | 0.12 | ||
| 874.06 | 581.81 | R | 11.64 | 0.43 | ccSee §3.1. | |
| 855.70 | 697.28 | L | 15.15 | 0.28 | 0.36 | ccSee §3.1. |
| 426.68 | 289.73 | R | 15.31 | 0.34 | 0.11 | |
| 390.64 | 209.47 | R | 14.16 | 0.44 | 26.47 | 2 |
| 390.18 | 203.01 | L | 14.27 | 0.37 | 8.72 | 2 |
| 382.13 | 130.66 | R | 13.57 | 0.56 | 3 | |
| 375.09 | 126.11 | R | 13.61 | 0.29 | 3.90 | 4 |
| 331.65 | 100.54 | R | 13.32 | 0.30 | 0.42 | 6 |
| 259.45 | 100.83 | R | 13.92 | 0.39 | 10 | |
| 258.85 | 100.60 | L | 16.73 | 0.80 | 9 | |
| 255.25 | 87.59 | R | 13.45 | 0.33 | 2.35 | 12 |
| 255.13 | 88.20 | L | 16.47 | 0.31 | 5.37 | 11 |
| 249.72 | 103.36 | R | 13.68 | 0.29 | 3.98 | 13 |
| 249.24 | 102.42 | L | 16.73 | 1.35 | 14 | |
| 238.90 | 98.32 | R | 13.70 | 0.29 | 0.61 | 15 |
| 235.05 | 96.69 | L | 16.10 | 0.38 | 4.63 | |
| 233.76 | 97.58 | L | 16.35 | 0.46 | 4.13 | 16 |
| 212.69 | 80.57 | L | 15.86 | 0.48 | 19 | |
| 201.74 | 85.70 | L | 15.88 | 0.45 | 0.85 | |
| 128.22 | 994.63 | R | 5.95 | 0.40 | 0.37 | 22 |
| 64.88 | 1024.65 | L | 3.10 | 0.29 | 0.42 | 23 |
| 64.20 | 1000.55 | L | 4.95 | 0.34 | 0.71 | 24 |
| 57.36 | 999.58 | L | 6.08 | 0.32 | 1.33 | 25 |
| 52.13 | 1006.29 | L | 4.61 | 0.34 | 27 | |
| 50.68 | 1012.23 | L | 3.90 | 0.62 | 28 | |
| 44.39 | 995.89 | L | 4.67 | 0.43 | 0.37 | 29 |
| 42.84 | 1037.19 | L | 3.49 | 0.30 | 18.03 | 30 |
| 41.37 | 1052.15 | L | 5.31 | 0.19 | 31 | |
| 39.74 | 1059.39 | L | 5.66 | 0.11 | 33 | |
| 22.44 | 1109.70 | R | 2.48 | 0.32 | 0.15 | 34 |
| 18.44 | 1129.78 | R | 3.50 | 0.27 | 0.49 | 35 |
| 0.06 | 1.22 | L | 12.85 | 0.44 | 0.27 | 36 |
| 0.02 | 0.02 | R | 12.82 | 0.32 | 39.59 | 36 |
| 16.49 | 5.23 | R | 14.29 | 0.28 | 0.64 | |
| 18.03 | 4.86 | L | 14.31 | 0.27 | 1.15 | 37 |
| 32.64 | 532.38 | R | 13.14 | 0.40 | 0.71 | 39 |
| 38.86 | 526.62 | L | 13.36 | 0.45 | 0.39 | |
| 39.19 | 527.41 | R | 13.21 | 0.48 | 0.47 | 40 |
| 40.34 | 526.99 | L | 13.88 | 0.65 | 1.08 | 41 |
| 40.40 | 527.71 | R | 13.85 | 0.40 | 0.32 | |
| 152.31 | 4.82 | R | 14.02 | 0.30 | 4.39 | 43 |
| 154.58 | 6.23 | L | 15.05 | 0.36 | 1.43 | 44 |
| 156.30 | 6.62 | L | 14.11 | 0.39 | 0.92 | |
| 162.13 | 7.20 | L | 14.80 | 0.40 | ||
| 374.87 | 409.70 | L | 11.64 | 0.07 | ccSee §3.1. | |
| 1667 MHz | ||||||
| 377.57 | 125.65 | R | 14.22 | 0.28 | 1.60 | 45 |
| 17.04 | 8.24 | R | 13.84 | 0.28 | 1.22 | 46 |
| 160.68 | 13.49 | R | 14.29 | 0.37 | 0.20 | 47 |
| 161.92 | 13.37 | L | 14.64 | 0.33 | 0.56 | 48 |
| 169.53 | 16.79 | R | 14.38 | 0.35 | 0.15 | 49 |
| 170.54 | 16.96 | L | 14.62 | 0.34 | ||
| R.A. | Decl. | Brightness | Feature | |||
|---|---|---|---|---|---|---|
| (mas) | (mas) | Pol. | (km s-1) | (km s-1) | (Jy beam-1) | Number |
| 1665 MHz | ||||||
| 113.57 | 467.50 | R | 18.84 | 0.43 | 0.24 | 1 |
| 105.41 | 599.80 | L | 17.52 | 0.32 | 1.17 | 2 |
| 89.63 | 572.22 | R | 22.00 | 0.36 | 3 | |
| 72.04 | 614.53 | R | 22.18 | 0.21 | ||
| 50.69 | 440.19 | L | 22.43 | 0.33 | 0.85 | 4 |
| 6.12 | 1.20 | R | 21.32 | 0.48 | 3.25 | 5 |
| 0.00 | 0.00 | L | 19.75 | 0.37 | 8.16 | 6 |
| 15.41 | 3.29 | L | 20.39 | 0.41 | 2.70 | 7 |
| 276.37 | 155.04 | R | 19.51 | 0.38 | 1.03 | 8 |
| 277.41 | 152.77 | R | 20.92 | 0.68 | 0.28 | 9 |
| 282.44 | 149.67 | L | 19.31 | 0.34 | 0.77 | 10 |
| 1739.20 | 1921.46 | R | 22.18 | 0.77 | 11 | |
| 1743.47 | 1925.42 | R | 23.19 | 1.07 | 0.93 | 12 |
| 1745.09 | 1937.14 | L | 22.00 | 0.65 | ||
| 1745.44 | 1925.10 | L | 21.43 | 1.31 | 0.79 | 13 |
| 1667 MHz | ||||||
| 0.35 | 3.03 | R | 21.04 | 0.50 | 1.38 | 15 |
| 0.49 | 2.11 | L | 20.12 | 0.38 | 1.85 | 16 |
| 10.71 | 4.19 | L | 20.78 | 0.55 | 1.70 | 17 |
| R.A. | Decl. | Brightness | Feature | |||
|---|---|---|---|---|---|---|
| (mas) | (mas) | Pol. | (km s-1) | (km s-1) | (Jy beam-1) | Number |
| 1665 MHz | ||||||
| 1962.34 | 778.46 | L | 62.62 | 0.58 | 0.52 | 2 |
| 1940.65 | 776.89 | L | 62.50 | 0.35 | 0.27 | 3 |
| 1921.10 | 765.50 | L | 62.46 | 0.25 | ||
| 1918.49 | 820.74 | R | 62.11 | 0.17 | 5 | |
| 1891.66 | 774.78 | L | 61.77 | 0.49 | 0.30 | 7 |
| 1890.21 | 1065.91 | L | 60.87 | 0.41 | 2.02 | 8 |
| 1886.06 | 773.72 | R | 61.70 | 0.49 | 0.22 | 9 |
| 1884.54 | 773.16 | L | 62.11 | 0.27 | ||
| 1835.12 | 420.83 | R | 54.02 | 0.35 | 11 | |
| 1822.81 | 390.73 | L | 50.68 | 0.21 | 12 | |
| 1821.88 | 394.92 | R | 54.20 | 0.25 | 13 | |
| 1818.79 | 1084.92 | L | 59.82 | 0.17 | ||
| 1717.81 | 1059.05 | R | 58.42 | 0.63 | ||
| 1525.78 | 1162.25 | R | 57.79 | 0.38 | 0.66 | 18 |
| 1524.80 | 1163.29 | L | 57.79 | 0.33 | 0.79 | 18 |
| 814.99 | 210.36 | R | 59.61 | 0.43 | 3.15 | |
| 770.25 | 222.97 | L | 59.75 | 0.47 | 0.29 | |
| 769.59 | 221.27 | R | 59.74 | 0.46 | 0.64 | |
| 624.12 | 1049.92 | R | 56.13 | 0.28 | 19 | |
| 619.48 | 1081.61 | R | 56.65 | 0.53 | 0.47 | 20 |
| 578.14 | 1108.77 | L | 57.71 | 0.20 | ||
| 565.42 | 1199.88 | R | 55.92 | 0.43 | 1.04 | 21 |
| 562.75 | 1201.05 | L | 59.91 | 0.65 | 0.23 | |
| 548.58 | 1231.79 | R | 56.49 | 0.28 | 0.41 | |
| 495.74 | 1235.36 | R | 62.78 | 0.36 | 0.48 | |
| 432.63 | 1172.43 | L | 61.47 | 0.85 | 0.33 | |
| 421.34 | 1151.00 | R | 61.23 | 0.32 | 24 | |
| 420.06 | 1151.32 | L | 61.21 | 0.30 | 0.44 | 24 |
| 415.15 | 885.46 | R | 61.58 | 0.15 | ||
| 392.77 | 995.12 | L | 63.16 | 0.53 | ||
| 359.43 | 1851.60 | L | 57.13 | 0.32 | 1.59 | 26 |
| 342.14 | 1829.88 | L | 56.75 | 0.56 | 1.17 | 28 |
| 263.84 | 1176.27 | R | 62.15 | 0.32 | 1.88 | 29 |
| 261.66 | 1174.74 | L | 59.28 | 0.30 | 0.46 | |
| 230.97 | 1781.71 | R | 61.58 | 0.18 | 30 | |
| 221.88 | 1790.79 | R | 58.59 | 0.88 | ||
| 215.40 | 799.30 | R | 60.35 | 0.15 | ||
| 192.30 | 31.61 | L | 61.05 | 0.17 | ||
| 136.49 | 809.77 | L | 61.72 | 0.39 | 0.85 | |
| 136.34 | 808.96 | R | 61.69 | 0.36 | 0.93 | |
| 128.68 | 817.75 | L | 62.76 | 0.79 | 0.11 | |
| 126.58 | 817.46 | R | 62.89 | 0.57 | 0.25 | 33 |
| 124.10 | 816.70 | L | 61.61 | 0.41 | 1.79 | 34 |
| 123.69 | 815.99 | R | 61.58 | 0.43 | 1.24 | 35 |
| 69.84 | 54.33 | R | 60.11 | 0.45 | 0.71 | 36 |
| 69.48 | 56.34 | L | 60.07 | 0.41 | 0.88 | 36 |
| 40.19 | 70.98 | R | 59.82 | 0.26 | ||
| 32.75 | 1255.39 | L | 59.12 | 0.26 | ||
| 12.66 | 33.67 | L | 57.71 | 0.48 | ||
| 11.80 | 30.08 | R | 57.53 | 0.53 | 0.66 | |
| 10.76 | 12.29 | L | 59.30 | 0.51 | ||
| 6.68 | 103.27 | L | 60.63 | 0.63 | 0.24 | |
| 6.49 | 100.55 | R | 60.74 | 0.54 | 0.19 | |
| 2.36 | 45.31 | L | 60.56 | 0.56 | 0.23 | 38 |
| 1.64 | 9.35 | L | 58.94 | 0.50 | 8.12 | |
| 4.22 | 1.35 | L | 58.47 | 0.40 | 20.77 | 40 |
| 4.37 | 1.70 | R | 58.33 | 0.53 | 87.63 | 39 |
| 6.83 | 857.03 | R | 60.39 | 0.55 | 0.22 | |
| 7.71 | 13.36 | L | 58.40 | 0.49 | 10.57 | |
| 8.54 | 857.50 | L | 60.33 | 0.48 | 0.23 | |
| 22.69 | 27.99 | L | 57.54 | 0.38 | ||
| 26.15 | 11.42 | R | 57.43 | 0.43 | 1.91 | |
| 28.50 | 1.21 | R | 59.72 | 0.56 | 1.87 | |
| 29.26 | 5.01 | L | 58.37 | 0.37 | 4.64 | |
| 29.37 | 23.97 | R | 58.81 | 0.40 | 4.67 | |
| 29.46 | 23.42 | L | 58.92 | 0.58 | 19.20 | 41 |
| 29.65 | 21.53 | L | 59.12 | 8.68 | ||
| 30.53 | 150.64 | L | 61.23 | 0.15 | ||
| 36.24 | 66.80 | R | 60.77 | 0.38 | 1.72 | |
| 39.00 | 58.09 | R | 58.79 | 0.39 | 18.21 | 44 |
| 42.96 | 56.92 | L | 58.93 | 0.36 | 3.98 | |
| 43.40 | 64.55 | L | 62.45 | 0.37 | 0.56 | |
| 43.96 | 64.28 | R | 62.48 | 0.37 | 0.21 | |
| 51.90 | 14.37 | R | 60.35 | 0.17 | ||
| 55.38 | 0.95 | L | 60.02 | 0.45 | 0.72 | |
| 58.70 | 55.33 | L | 59.82 | 0.30 | ||
| 61.30 | 66.28 | R | 61.23 | 0.28 | ||
| 61.74 | 40.83 | L | 59.50 | 0.47 | 0.97 | |
| 86.16 | 8.48 | L | 60.07 | 0.42 | 0.46 | |
| 94.45 | 27.96 | L | 57.54 | 0.32 | 0.65 | 45 |
| 109.52 | 11.38 | L | 59.80 | 0.93 | 0.36 | |
| 113.85 | 14.92 | R | 59.26 | 0.64 | 0.28 | |
| 126.04 | 0.85 | L | 58.73 | 0.44 | 3.95 | |
| 140.12 | 237.55 | L | 61.70 | 0.31 | 2.65 | 47 |
| 140.63 | 281.62 | L | 61.49 | 0.39 | 1.76 | 48 |
| 148.16 | 48.45 | L | 57.76 | 0.61 | 1.52 | 49 |
| 149.25 | 5.37 | R | 60.88 | 0.46 | ||
| 263.20 | 170.93 | R | 60.88 | 0.26 | ||
| 264.15 | 172.06 | L | 60.88 | 0.33 | 0.51 | |
| 300.88 | 158.62 | R | 57.73 | 0.46 | 1.28 | |
| 320.58 | 744.94 | R | 64.86 | 0.33 | 1.07 | 51 |
| 321.54 | 743.94 | L | 64.86 | 0.36 | 0.77 | 51 |
| 339.04 | 201.10 | L | 59.82 | 0.17 | ||
| 347.71 | 225.22 | L | 59.97 | 0.31 | 0.51 | |
| 347.91 | 225.07 | R | 60.00 | 0.58 | ||
| 1667 MHz | ||||||
| 815.34 | 213.27 | R | 59.65 | 0.23 | ||
| 785.81 | 228.73 | R | 59.63 | 0.58 | 1.26 | |
| 785.54 | 229.00 | L | 59.59 | 0.54 | 0.69 | |
| 769.05 | 225.89 | L | 59.88 | 0.54 | 0.53 | |
| 768.42 | 225.04 | R | 59.84 | 0.51 | 1.03 | |
| 419.86 | 1155.51 | L | 61.76 | 0.27 | ||
| 110.62 | 822.13 | R | 61.35 | 0.32 | 0.77 | |
| 110.15 | 823.11 | L | 61.37 | 0.33 | 0.98 | 65 |
| 109.60 | 823.86 | R | 62.11 | 0.82 | 66 | |
| 70.35 | 51.67 | L | 61.96 | 0.41 | 2.52 | 69 |
| 74.82 | 53.80 | R | 60.68 | 0.41 | 1.13 | 71 |
| 133.05 | 234.23 | R | 60.18 | 0.16 | 73 | |
| 139.20 | 234.27 | L | 61.21 | 0.28 | 0.53 | 74 |
| 155.91 | 8.29 | R | 61.62 | 0.69 | 0.16 | 75 |
| 170.67 | 1.26 | L | 62.51 | 0.48 | 0.23 | |
| 212.82 | 15.67 | R | 62.59 | 0.46 | 0.45 | 79 |
| 221.73 | 640.71 | L | 60.00 | 0.29 | 0.28 | 80 |
| 352.19 | 206.06 | R | 59.92 | 0.61 | 0.22 | 81 |
| 360.44 | 206.65 | L | 59.93 | 0.67 | 0.19 | 81 |
| 431.07 | 375.19 | R | 61.95 | 0.39 | 0.40 | 82 |
| 449.12 | 360.57 | L | 61.96 | 0.41 | 2.02 | 83 |
| 450.65 | 360.89 | R | 62.03 | 0.37 | 3.73 | 84 |
| 465.85 | 340.96 | R | 61.96 | 0.37 | 2.18 | 87 |
| 466.98 | 342.06 | L | 61.92 | 0.38 | 1.40 | 86 |
| 542.60 | 368.86 | R | 61.40 | 0.14 | ||
| 543.81 | 374.97 | R | 60.92 | 0.48 | 0.21 | 90 |
| 545.72 | 373.57 | L | 60.87 | 0.51 | 0.30 | 91 |
| 557.62 | 331.19 | L | 60.88 | 0.17 | 92 | |
| 575.59 | 201.30 | R | 61.89 | 0.35 | 1.49 | 96 |
| 575.95 | 202.37 | L | 61.84 | 0.49 | 0.65 | 96 |
| 1720 MHz | ||||||
| 2071.85 | 363.09 | R | 55.43 | 0.41 | 2.19 | |
| 2070.55 | 364.96 | L | 54.60 | 0.37 | 1.07 | |
| 2046.53 | 392.14 | R | 56.64 | 0.49 | 0.38 | |
| 1862.64 | 419.83 | R | 53.56 | 0.52 | 1.56 | |
| 1857.76 | 420.17 | L | 52.65 | 0.36 | 1.22 | |
| 1839.64 | 420.68 | R | 53.36 | 0.67 | ||
| R.A.aaOffsets are computed from the origin in W51 South. | Decl.aaOffsets are computed from the origin in W51 South. | Brightness | Feature | |||
|---|---|---|---|---|---|---|
| (mas) | (mas) | Pol. | (km s-1) | (km s-1) | (Jy beam-1) | Number |
| 1665 MHz | ||||||
| 1182.34 | 5755.96 | L | 49.31 | 0.45 | 0.50 | 1 |
| 1170.13 | 5786.08 | L | 48.57 | 0.18 | 2 | |
| 1147.87 | 5702.08 | L | 50.33 | 0.16 | 3 | |
| 1113.49 | 6124.29 | R | 50.52 | 0.42 | 1.04 | 4 |
| 1085.33 | 5219.76 | L | 54.69 | 0.54 | 0.55 | 6 |
| 1085.27 | 5221.60 | R | 57.01 | 0.44 | 0.46 | 7 |
| 1067.94 | 5249.91 | R | 60.10 | 0.74 | 0.77 | 8 |
| 1065.40 | 5250.17 | L | 57.75 | 0.75 | 0.56 | 9 |
| 997.36 | 5353.95 | R | 61.93 | 0.20 | ||
| 855.25 | 5319.67 | L | 52.27 | 0.21 | ||
| 854.02 | 5624.93 | R | 57.22 | 0.45 | 2.61 | 15 |
| 849.04 | 5697.37 | L | 49.42 | 0.33 | 1.14 | 18 |
| 834.81 | 5650.98 | R | 57.98 | 0.74 | 1.49 | 19 |
| 825.21 | 5645.36 | R | 55.89 | 0.21 | 9.96 | 20 |
| 823.99 | 5643.76 | L | 55.96 | 0.24 | ||
| 815.12 | 5659.66 | R | 59.12 | 0.89 | ||
| 783.24 | 5674.08 | R | 59.39 | 0.47 | 16.29 | |
| 772.70 | 5638.75 | R | 58.80 | 0.66 | 31.89 | 21 |
| 707.91 | 5667.86 | R | 57.73 | 0.50 | 4.62 | 24 |
| 700.66 | 5649.71 | R | 57.31 | 0.72 | 2.02 | 25 |
| 697.88 | 5648.14 | R | 56.27 | 0.65 | 0.82 | |
| 694.30 | 6156.55 | R | 64.22 | 0.49 | 0.83 | |
| 693.91 | 6156.95 | L | 51.91 | 0.17 | 26 | |
| 690.98 | 6187.16 | R | 67.60 | 0.41 | 1.05 | 29 |
| 689.63 | 6188.76 | L | 55.61 | 0.18 | 28 | |
| 444.88 | 6611.47 | L | 68.90 | 1.14 | 0.22 | 31 |
| 444.50 | 6609.96 | R | 71.43 | 0.49 | 0.23 | 32 |
| 301.22 | 6282.29 | R | 64.20 | 0.46 | 0.31 | 34 |
| 274.83 | 6558.57 | R | 67.21 | 0.31 | 0.27 | 35 |
| 232.59 | 6512.03 | L | 67.73 | 0.36 | 0.65 | 36 |
| 232.52 | 6511.52 | R | 70.20 | 0.26 | 37 | |
| 229.26 | 6524.31 | L | 67.03 | 0.14 | 39 | |
| 223.82 | 6712.15 | R | 69.73 | 0.42 | 0.63 | 38 |
| 180.44 | 5925.77 | L | 54.94 | 0.36 | 1.52 | 40 |
| 127.57 | 6581.97 | R | 65.50 | 0.63 | 0.14 | 41 |
| 109.08 | 5896.89 | L | 52.09 | 0.30 | ||
| 106.25 | 6592.58 | R | 64.59 | 0.46 | 1.97 | 42 |
| 105.86 | 6592.52 | L | 64.61 | 0.43 | 0.89 | 42 |
| 100.47 | 6603.44 | L | 64.22 | 0.68 | ||
| 95.12 | 5870.46 | L | 54.23 | 0.29 | 0.87 | 43 |
| 91.34 | 5856.99 | R | 60.18 | 0.53 | ||
| 31.04 | 5478.85 | R | 57.71 | 0.37 | 46 | |
| 28.64 | 5478.92 | L | 51.85 | 0.45 | 0.48 | 45 |
| 6.95 | 5839.69 | L | 52.99 | 0.37 | 0.30 | |
| 23.54 | 6332.59 | R | 61.64 | 0.52 | 0.23 | |
| 42.88 | 5824.34 | L | 52.44 | 0.24 | 47 | |
| 106.83 | 5714.90 | L | 46.70 | 0.41 | 0.94 | 50 |
| 152.33 | 5788.58 | L | 46.66 | 0.35 | 0.25 | 52 |
| 400.73 | 5729.79 | L | 47.92 | 0.47 | 0.50 | 53 |
| 1667 MHz | ||||||
| 1091.99 | 5260.30 | L | 60.53 | 0.23 | 54 | |
| 1081.93 | 5302.03 | L | 59.54 | 0.64 | 0.46 | 57 |
| 1080.66 | 5297.19 | R | 61.76 | 0.98 | 0.41 | |
| 1079.67 | 5295.13 | L | 60.35 | 0.74 | 0.29 | |
| 1077.29 | 5292.93 | R | 63.43 | 0.81 | 0.52 | 58 |
| 1076.96 | 5292.84 | L | 61.91 | 0.74 | 0.61 | 59 |
| 1008.01 | 5335.45 | R | 62.27 | 0.57 | 0.61 | 65 |
| 1004.65 | 5334.97 | L | 60.72 | 0.49 | 0.59 | |
| 886.62 | 6633.63 | L | 70.08 | 0.61 | 0.24 | 67 |
| 792.72 | 5694.23 | R | 60.00 | 0.17 | ||
| 706.73 | 6069.73 | L | 54.16 | 0.32 | 10.04 | 71 |
| 693.33 | 5651.72 | R | 56.03 | 0.49 | 1.46 | 72 |
| 692.61 | 5650.86 | L | 55.96 | 0.19 | 72 | |
| 666.96 | 6579.55 | R | 69.66 | 0.19 | 73 | |
| 653.01 | 6041.47 | L | 55.25 | 0.33 | 0.19 | |
| 300.44 | 6275.75 | R | 63.16 | 0.17 | ||
| 299.89 | 6270.42 | R | 63.94 | 0.44 | 0.32 | 77 |
| 273.97 | 6555.48 | R | 66.65 | 0.40 | 0.44 | 78 |
| 232.14 | 6507.51 | R | 69.73 | 0.34 | 2.64 | 80 |
| 231.80 | 6507.07 | L | 68.32 | 0.35 | 1.04 | 79 |
| 231.59 | 6506.25 | L | 69.72 | 0.31 | 0.71 | |
| 220.38 | 6707.61 | R | 68.79 | 0.63 | 1.53 | 82 |
| 180.82 | 5922.92 | L | 56.76 | 0.42 | 0.81 | 84 |
| 108.89 | 5893.63 | L | 53.15 | 0.17 | ||
| 108.31 | 5894.74 | R | 57.30 | 0.57 | 0.35 | |
| 104.91 | 6588.53 | R | 64.92 | 0.56 | 1.08 | 86 |
| 102.45 | 5711.74 | R | 49.35 | 0.53 | 0.20 | |
| 104.61 | 5711.23 | L | 47.36 | 0.49 | 0.54 | 88 |
| 130.08 | 5768.24 | L | 46.99 | 0.55 | 1.55 | 90 |
| 130.29 | 5766.44 | R | 48.83 | 0.55 | 0.67 | 91 |
| 152.60 | 5789.24 | R | 49.11 | 0.20 | 92 | |
| 156.11 | 5788.40 | L | 47.18 | 0.24 | 93 | |
| 180.66 | 5813.92 | R | 48.59 | 0.17 | 94 | |
| 1720 MHz | ||||||
| 1220.45 | 5336.56 | R | 55.08 | 0.38 | 3.78 | |
| 1218.96 | 5334.32 | L | 54.31 | 0.41 | 1.21 | |
| 1105.77 | 5502.33 | R | 56.72 | 1.12 | 1.27 | |
| 1103.96 | 5497.80 | L | 55.85 | 0.69 | 0.76 | |
| 1066.39 | 5441.33 | L | 58.13 | 0.26 | ||
| 978.82 | 5362.48 | R | 60.60 | 0.61 | 0.38 | |
| 953.47 | 5189.18 | R | 55.39 | 0.47 | 9.62 | |
| 951.36 | 5188.07 | L | 54.60 | 0.50 | 2.61 | |
| 950.25 | 5530.69 | L | 58.71 | 0.52 | 0.91 | |
| 941.99 | 5539.44 | L | 59.53 | 0.52 | 4.62 | |
| 941.96 | 5543.05 | R | 60.43 | 0.57 | 12.98 | |
| 936.60 | 5688.29 | R | 53.64 | 0.79 | 2.53 | |
| 932.87 | 5686.24 | L | 52.45 | 0.47 | 1.68 | |
| 916.17 | 5665.59 | R | 56.12 | 0.40 | 31.36 | |
| 914.04 | 5663.76 | L | 55.16 | 0.52 | 7.45 | |
| 910.29 | 5259.37 | R | 56.51 | 0.45 | 3.88 | |
| 907.75 | 5257.91 | L | 55.79 | 0.49 | 3.22 | |
| 899.04 | 5582.36 | R | 59.58 | 0.60 | 131.13 | |
| 897.48 | 5580.55 | L | 58.67 | 0.51 | 33.47 | |
| 886.67 | 5234.46 | L | 55.03 | 0.32 | 0.96 | |
| 886.18 | 5234.40 | R | 55.75 | 0.30 | 1.35 | |
| 867.16 | 5289.35 | R | 55.86 | 0.63 | 0.77 | |
| 863.24 | 5290.85 | L | 54.87 | 0.63 | 0.64 | |
| 844.12 | 5618.13 | L | 56.86 | 0.76 | 10.93 | |
| 838.18 | 5625.31 | R | 58.04 | 0.99 | 27.84 | |
| 832.98 | 5591.20 | R | 61.00 | 0.48 | 1.34 | |
| 831.51 | 5590.62 | L | 60.02 | 0.42 | 0.79 | |