The Rest-Frame UV Spectrum of Elliptical Galaxies at High Redshift
Abstract
Beyond redshift the only spectral feature that allows one to get the redshift of passively evolving galaxies (PEG) with optical spectrographs is a characteristic structure due to a set of iron and magnesium lines lines at Å in the rest frame. The same feature permits also to estimate the time elapsed since the cessation of star formation. Current efforts at observing high redshift PEGs at the VLT and SUBARU telescopes are briefly reviewed.
1 Introduction
In the local universe more than half of the stellar mass resides in passively evolving galaxies (PEG), and above PEGs outnumber starforming galaxies by a factor of 10 or more (e.g. Baldry et al. 2004). As most PEGs are morphologically classified as ellipticals, and most ellipticals are PEGs (e.g., Renzini 2006, Scarlata et al. 2007) sometimes PEGs and ellipticals, or early type galaxies (ETG), are used as synonyms, though there is no perfect overlap, neither at low nor high redshift (e.g. Scarlata et al. 2007), This makes PEGs an especially important class of cosmic objects, and understanding their formation and evolution is central to the broader issue of galaxy formation in general.
Only in recent years it has become possible to observationally map the evolution of the PEG population all the way to fairly high redshifts (), as a result of combining space and ground observations taken at the most powerful facilities. The ultimate aim of these efforts is that of tracing the evolution with redshift of the number density and mass function of PEGs, all the way to their disappearance, i.e. to the epoch when their precursors were still actively star forming, or were not assembled yet. Thus, to this end three main issues have to be attacked, namely:
Identify suitable PEG candidates at high redshift,
Measure their redshift, and
Estimate age, metallicity and mass of their stellar populations.
In this paper I will briefly report the main results from projects such as the K20 (Cimatti et al. 2002; Mignoli et al. 2005), GMASS (Cimatti et al., in preparation; Kurk et al., in preparation), and a joint ESO/SUBARU project (Kong et al. 2006; Daddi et al., in preparation). Multiobject spectroscopy in the rest-frame ultraviolet has been so far the main tool that has allowed us to precisely locate high- PEGs in space (and time). Quite similar results are being obtained by the GDDS team, and those are reported by Pat McCarthy at this meeting.
2 PEGs beyond
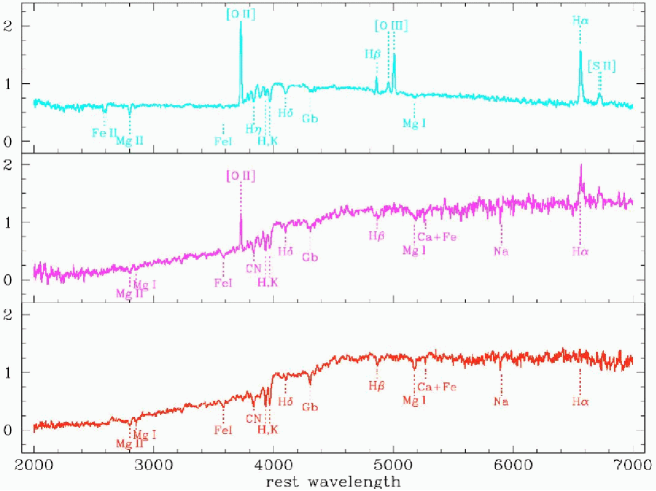
The spectroscopic identification of PEGs is relatively easy up to redshift . As shown in Figure 1, the CaII H&K lines together with the 4000 Å break are the strongest features, and are very effective for measuring accurate redshifts. Large samples of PEGs have then been culled up to this redshift (e.g. Zucca et al. 2005; Faber et al. 2007; Scarlata et al. 2007). However, at higher redshifts these features first become contaminated by atmospheric OH emission, and then move beyond the sensitivity limit of CCD detectors. Hence, other features need to be used to measure redshifts with optical spectrographs.
An inspection of the PEG spectrum in Figure 1 shows that to the blue of the CaII doublet the strongest features are an isolated FeI line at , and a complex feature extending over the range , due to various Fe, MgI and MgII lines, that we call the Mg-UV feature. It is basically thanks to this feature that all redshifts of PEGs at have so far been measured.
The fist such case was for a PEG at selected for being a radiogalaxy (Dunlop et al 1996; Spinrad et al. 1997). Then almost a decade passed before other PEGs at could be spectroscopically identified (5 such objects by Glazebrook et al. 2004, and 4 objects by Cimatti et al. 2004). The most exciting aspect of these 2004 discoveries was that the 9 PEGs were found over a combined field of only arcmin2, while the Dunlop et al. object was selected from a catalog covering virtually the whole sky. The clear implication was that massive PEGs at high redshift ought to be much more numerous that many had suspected.
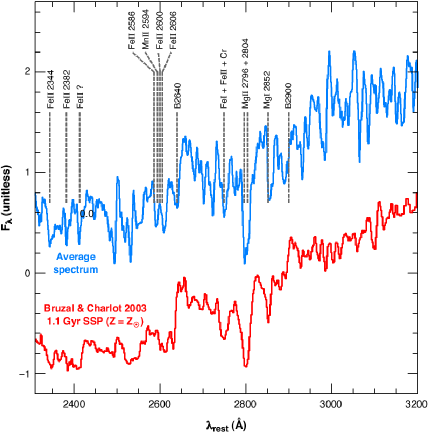
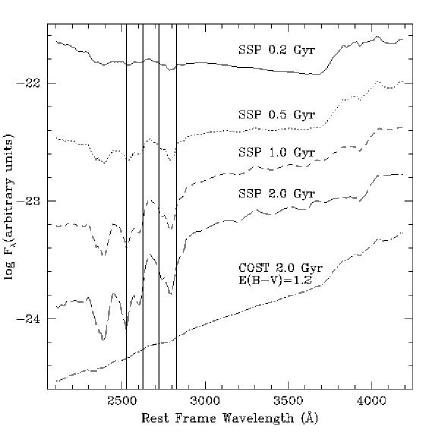
Figure 2 shows the coadded spectrum of the 4 Cimatti et al. objects, along with a synthetic spectrum of a 1.1 Gyr old simple stellar population (SSP). The excellent match between the observed and the synthetic spectrum implies that the bulk of stars in the four galaxies had to form at , given that they lie at . Indeed, the power of the Mg-UV feature is that it allows us to get at once the redshift and an age estimate, hence to set a formation redshift. This is illustrated in Figure 3, showing that indeed the feature appears only in populations that have evolved passively since at least Gyr, while the feature is absent for younger ages or for populations with ongoing star formation. Therefore, this feature being observable up to high redshifts is very useful for age-dating PEGs (see e.g., Maraston et al. 2006).
Thanks to the Mg-UV feature soon more high- PEGs were discovered (McCarthy et al. 2004; Daddi et al. 2005), but still within relatively small fields and capitalizing on spectroscopic surveys not specifically targeting such objects. For a more focused spectroscopic study of high- PEGs an effective criterion for selecting candidates was clearly required.
3 The Criterion for Selecting High- PEGs
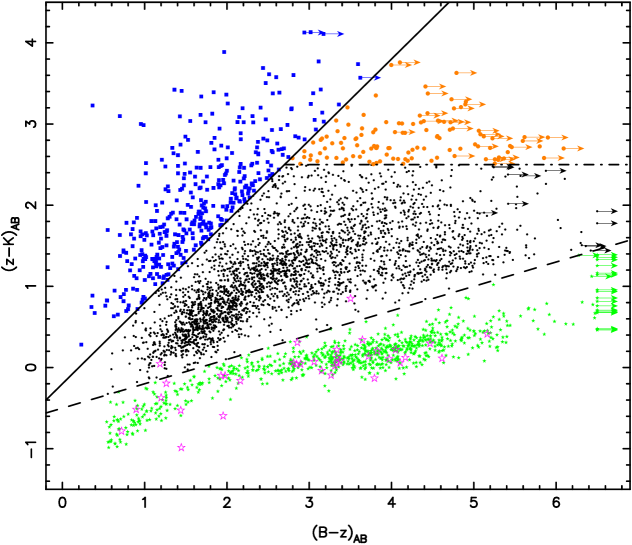
An efficient photometric criterion for the selection of PEGs at high redshift was proposed by Daddi et al. (2004), based on the expected location of PEGs on the vs two-color diagram. Moreover, the criterion was validated on existing spectroscopic data (K20, GOODS, etc.). The plot from Kong et al. (2006) is shown in Figure 4. Kong et al. then estimated that the comoving volume density of “passive BzKs” (pBzKs) with and is only of the corresponding space density at . Since the majority of such massive PEGs appears to be already in place at , this implies that the epoch between and ( Gyr) must be that during which most of massive PEGs are either finally assembled, and/or any residual star formation in their precursors is shut off.
Besides high- PEGs, the BzK criterion is also very efficient at selecting actively star-forming galaxies at (hence called sBzKs), even if rather heavily reddened. The early zCOSMOS spectroscopic results have demonstarted that indeed the contamination by lower redshift interlopers is extremely small for sBzK-selected targets (Lilly et al. 2007). Thus, a sizable fraction of sBzKs must turn into pBzKs and lower redshift PEGs between and . How this transformation is taking place, in terms of star-formation quenching, merging, disk instability, and morphological transformation is perhaps the major open issue concerning the evolution of galaxies over the last Gyr of cosmic time. Of course, this must include the co-evolution of hosting galaxies and their central supermassive black holes (SMBH), and a first grasp at the AGN activity among sBzK galaxies and the concomitant growth of their stellar mass and SMBH can be found in Daddi et al. (2007).
4 More Rest-frame UV Spectroscopy of High- PEGs
While extensive multi-object spectroscopy of star-forming galaxies at is relatively easy nowadays (e.g. with VIMOS and FORS2 at the VLT and LRIS at Keck), an extensive spectroscopic survey of high- PEGs is still lacking. I like to report here some preliminary result from a couple of pilot projects, aiming primarily at understanding how to better plan for future massive surveys.
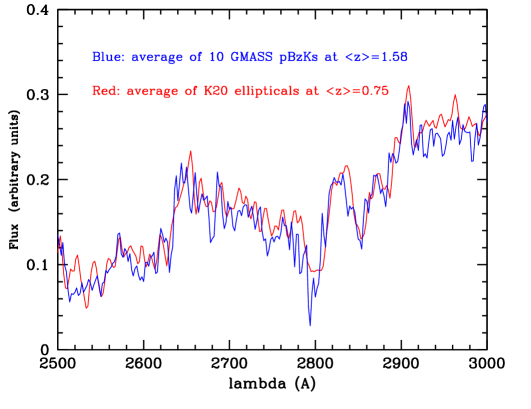
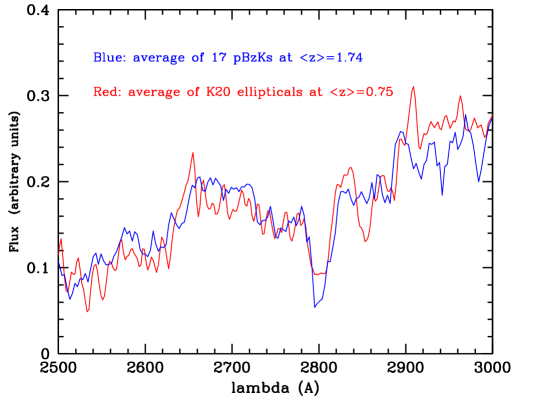
Figure 5 shows the coadded spectrum for 17 pBzKs selected from the sample of Kong et al. (2006), and observed with the VIMOS spectrograph at the VLT with an integration time of 2.5h (Daddi et al. in preparation). The spectra were taken with the intermediate resolution () Red Grism, while targeting sBzKs and other galaxies as well, so to fully exploit the multiplex of the instrument. Overplotted to the coadded spectrum of the pBzKs is the template spectrum for the PEGs from the K20 survey (from Mignoli et al. 2005).
Figure 6 shows the coadded spectrum for 10 pBzKs selected from the GMASS sample, and observed with the FORS2 spectrograph at the VLT with an integration time of 30h (sic!) (Cimatti et al. in preparation; Kurk et al. in preparation). The spectra were taken with a low resolution () Red Grism. The same lower redshift PEG spectrum is also overplotted. Note that the coadded spectrum in this figure has the same S/N an individual galaxy would have if integrated for 300 hours.
Individual spectra taken with FORS2 have far better S/N than those taken with VIMOS, given the much longer integration time, and the superior performance of FORS2 for Å. In practice, we are fairly secure that all 10 FORS2 redshifts are correct, while a few (perhaps 3 or 4, or ) among the VIMOS redshifts may not be correct.
5 Conclusions
Optical spectroscopic observations in the rest-frame UV have demonstrated that PEGs exist in sizable number up to at least . The surface density of -selected PEGs is arcmin-2 down to , substantially lower than the slit-packing capability of multiobject spectrographs such as VIMOS or FORS2. Moreover, the rest-frame UV continuum is quite naturally very faint in PEGs, even in high-redshift ones, given that for being passive these galaxies lack OB stars in sizable number. Actually, the absence of these stars is a requisite for detecting the Mg-UV feature.
Therefore, none of the optical instruments currently at 8-10m telescopes is optimally suited to exploit the Mg-UV feature for mapping the population of high- PEGs. Very long integration times would be required, coupled with only a marginal exploitation for the specific targets of the instrument multiplex.
An alternative option to optical spectroscopy is to go to the near-IR, following the CaII doublet and the 4000 Å break as they redshift beyond . However, the secure detection even of the strongest absorption lines such as CaII H&K would need extremely long integration times, which could be afforded only if very many objects could be observed simultaneously. The only near-IR MOS currently in operation is MOIRCS at the SUBARU telescope (Tokoku et al. 2006). Several BzK-selected galaxies from the sample of Kong et al. (2006) were ready to be observed with MOIRCS during a 5-night run in April 2007. Unfortunately the spectrographic channel of MOIRCS had a technical problem when just inserting the first cryogenic mask into the instrument, and only the imaging mode could be used in the following nights. As well know, cryogenics is critical for operations in the band, but a warm instrument working just in the band would be perfectly adequate for observing the CaII doublet and the 4000 Å break up to and beyond. A first opportunity in this sense will possibly be offered once more by the SUBARU telescope, using the FMOS multifiber instrument (Kimura et al. 2003). With its operation over the large FoV at the prime focus of SUBARU, FMOS will have a very good match between its multiplex and the surface density of pBzKs, and therefore promises to be perhaps a better option for mapping the population of high- PEGs before JWST. Thus, spectroscopy in the rest-frame ultraviolet has been instrumental for demonstrating the existence of passively evolving galaxies at high redshifts, as well as for validating an efficient photometric criterion for selecting them. However, it appears that near-IR multiobject spectroscopy targeting classical features in the rest-frame optical such as the CaII doublet and the 4000 Å break may be better suited for a massive survey of these objects.
I would like to thank my colleagues Andrea Cimatti, Emanuele Daddi, and Marco Mignoli for their permission to show the coadded spectra shown in Figure 5 and 6 in advance of publication.
References
- (1) Baldry IK, Galzebrook K, Brinkmann J, Ivezić Z, Lupton LH, et al. 2004. ApJ 600:681
- (2) Bruzual G, Charlot S 2003. MNRAS 344:1000
- (3) Bundy K, Ellis RS, Conselice CJ, Taylor JE, Cooper MC, et al. 2006. ApJ 651:120
- (4) Cimatti A, Mignoli M, Daddi E, Pozzetti L, Fontana A, et al. 2002b. A&A 392:395
- (5) Cimatti A, Daddi E, Renzini A, Cassata P, Vanzella E, et al. 2004. Nature 430:184
- (6) Cimatti A, Daddi E, Renzini A 2006. A&A 453:L29
- (7) Daddi E, Cimatti A, Renzini A, Fontana A, Mignoli M, et al. 2004. ApJ 617:747
- (8) Daddi E, Renzini A, Pirzkal N, Cimatti A, Malhotra S, et al. 2005b. ApJ 626:680
- (9) Daddi E, Alexander DM, Dickinson M, Gilli R, Renzini A, et al. 2007. ApJ in press (arXiv:0705.2832)
- (10) Dunlop J, Peacock J, Spinrad H, Dey A, Jimenez R, et al. 1996. Nature 381:581
- (11) Faber SM, Willmer CNA, Wolf C, Koo DC, Weiner BJ, et al. 2007. ApJ 665:265
- (12) Glazebrook K, Abraham RG, McCarthy PJ, Savaglio S, Chen H-S, et al. Nature 430:181
- (13) Kimura M, Maihara T, Ohta K, Iwamuro F, Eto S, et al. 2003. SPIE 4841:974
- (14) Kong X, Daddi E, Arimoto N, Renzini A, Broadhurst T, et al. 2006. ApJ 638:72
- (15) Lilly SJ, Le Fevre O, Renzini A, Zamorani G, Scodeggio M, et al. 2007. ApJS COSMOS Special Issue, in press (astro-ph/0612291)
- (16) Maraston C, Daddi E, Renzini A, Cimatti A, Dickinson M, et al. 2006. ApJ 652:85
- (17) McCarthy PJ, Le Borgne D, Crampton D, Chen H-W, Abraham R, et al. 2004. ApJ 614:L9
- (18) Mignoli M, Cimatti A, Zamorani G, Pozzetti L, Daddi E, et al. 2005. A&A 437: 883
- (19) Renzini A 2006. ARA&A, 44, 141
- (20) Scarlata, C.; Carollo, C. M.; Lilly, S. J.; Feldmann, R.; Kampczyk, P. et al. 2007. ApJS, COSMOS Special Issue, in press (astro-ph/0701746)
- (21) Spinrad H, Dey A, Stern D, Dunlop J, Peacock J, et al. 1997. ApJ 484:581
- (22) Tokoku C, Suzuki R, Omata K, Konishi M, Yoshikawa T, et al. 2006. SPIE 6269, 62694
- (23) Zucca E, Ilbert O, Bardelli S, Tresse L, Zamorani G, et al. 2006. A&A 455:879