Relaxational Singularities of Human Motor System at Aging
Due to Short-Range and Long-Range Time Correlations
Abstract
In this paper we study the relaxation singularities of human motor system at aging. Our purpose is to examine the structure of force output variability as a function of human aging in the time and frequency domains. For analysis of experimental data we have developed here the statistical theory of relaxation of force output fluctuation with taking into account the effects of two relaxation channels. The first of them contains the contribution of short-range correlation whereas other relaxation component reflects the effect of long-range correlation. The analysis of experimental data shows, that the general behavior of relaxation processes at human aging is determined by a complicated combination and nonlinear interactions two above stated relaxation processes as a whole.
pacs:
05.45.Tp, 45.05.+x, 87.19.St, 89.75.-kI Introduction
Recent studies the aging of human neuromuscular system has focused on application of central theory regarding the age relating with the structure of behavioral and physiological variability due to loss of ”complexity” Lip ; Vall1 ; Vall2 . The term of ”complexity” is connected to the broader concept including the fractals and dynamics in disease and aging. The concept consider behavioral and physiological changes of the system’s due to aberrations in their time and frequency structure. However it is necessary to specify that less attention has been given to the neuromuscular changes associated with the time-dependent and dynamic peculiarities of force control till now.
In this study, we examine the time and frequency structure of healthy adult humans to determine a relaxation singularities, arising with aging of human motor systems. It is well known that aging tends to induce a range of performance decrements in human motor system. A common finding is that the amount of motor variability increases in the healthy aging adult over a broad set of tasks Gol ; Zai ; tra ; Vall3 .
Although consideration of the amount of variability is an important indicator of the aging neuromuscular system, the structure of motor variability also provides significant insight into system organization and human motor control Gold ; Hau ; Kap ; New . The presence of short-time and long-range correlations in neuromuscular fluctuations in healthy people has implications for understanding and mathematical modelling of neuroautonomic regulation. Here we have applied correlation analysis to assess the effects of physiological aging on correlation behavior of human motor system. The purpose of this paper was to consider the effects of aging and task demand on the relaxation structure of the signals of force output variability from the point of view of modern statistical physics. We consider the force-time series data as a discrete stochastic process and apply the statistical theory and the information measure of memory of non-Markov random processes in complex systems main ; eqpap ; ycard ; jetp . Therefore we can use the notions, based on the theory of chaos and information, in our analysis of complex systems. This allows to apply in our consideration representations and notions on statistical short-time and long-time memory, information measures of memory, relaxation and kinetic parameters from statistical theory Shur1 ; Shur2 ; Yulm3 ; Shur3 ; Shur4 ; PhysAInt ; PhysaSens ; PhysaGait .
II Methods
II.1 Participants
A total of 29 participants were assigned to three different age groups: young group (N=10; range: 20 - 24 yrs; mean: 22 + 1 yrs; 5 females and 5 males), old group (N=9; range: 64 - 69 yrs; mean: 67 + 2 yrs; 4 females and 5 males), and older-old group (N=10; range: 75 - 90 yrs; mean: 82 + 5 yrs; 5 females and 5 males). All of the participants were right hand dominant. The participants were familiarized with the purpose of the experiment and all participants gave informed consent to all experimental procedures, which were approved by the local Institutional Review Board.
The three age groups consisted of moderately active individuals. Persons who were highly active were excluded from the study. Also, elderly persons who were considered frail were excluded from the study. Twelve of the participants in the two elderly groups were taking medication for the treatment of high blood pressure. The distribution of persons taking medication for high blood pressure was 8 in the older-old group and 4 in the old group. None of the elderly participants reported having a neuromuscular or neuropsychiatric disease, nor did any of the participants have diabetes. Also, twelve of the elderly participants reported having arthritis and each were taking medication for the condition. The distribution of persons reporting arthritis of the hand was 7 in the older-old group and 5 in the old group. All participants remained on their normal medications during testing.
II.2 Apparatus
Participants were seated in a chair with their dominant forearm resting on a table (75 cm in height). The participant’s dominant hand was pronated and lay flat on the table with the digits of the hand comfortably extended. The setup constrained the wrist and the third, fourth and fifth phalanges from moving. The elbow position remained constant throughout the experimental session. Through abduction, the participant’s lateral side of the index finger contacted the load cell (Entran ELFS-B3, New Jersey), 1.27 cm in diameter, which was fixated to the table. The load cell was located 36 cm from the participant’s body midline. Analog output from the load cell was amplified through a Coulbourn Type A (Strain gauge Bridge) S72-25 amplifier at an excitation voltage of 10 V and a gain of 100. A computer controlled 16-bit A/D converter sampled the force output at 100 . The smallest increment of change in force the A/D board could detect was .0016 N. The force output was displayed on a video monitor located 48.6 cm from the participants’ eyes and 100 cm from the floor. According to previous work from laboratory (D.A.V.), the display-to-control gain was set at 20 pixels per 1 N change in force for each participant.
II.3 Procedures
During the initial portion of the experiment, the participant’s maximum voluntary contraction (MVC) was estimated consistent with previous work Vall3 . Participants abducted their index finger against the load cell with maximal force for three consecutive 6 trials. A 60 rest period was provided for each participant between each MVC trial. In each MVC trial, the mean of the greatest ten force samples was calculated. The means obtained from three trials were averaged to provide an estimate of each participant’s MVC. Participants adjusted their level of force output to match a red target line (1 pixel thick) on the video monitor. Participants viewed online feedback of their performance in the form of a yellow force-time trajectory that moved from left to right in time across the video monitor. They were instructed to match the yellow trajectory line to the red horizontal target line throughout each trial, and to minimize all deviations of the yellow line from the red line.
Participants produced force at a constant force target. The constant target was a horizontal line displayed across the center of the video monitor. Participants produced force at 5, 10, 20 and 40 % of their MVC under the constant force condition for two consecutive 25 trials at each force level. A rest period of 100 was provided between each force trial. The order of the force and target conditions was randomized across all participants.
III Data Analysis
The force-time series data were conditioned by the following methods. First, force data were digitally filtered by using a first-order Butterworth filter with a low-pass cutoff frequency of 20 . All data processing and subsequent time and frequency analysis were performed by using software written in Matlab. The analysis of force output concentrated on two primary problems: 1) calculation of the information measure of memory of force variability; 2) study of the correlation and relaxation structure of force time variability.
III.1 The information measure of memory for force variability.
For comparison the relaxation time scales of the initial TCF and memory functions of the th order (they will be described below in Eqn. (3)) we use here the first measure of memory that is the statistical non-Markovian parameter. Originally the non-Markovian parameter, characterizing the degree of non-Markovity of an arbitrary relaxation process, was introduced for analyzing the irreversible phenomena in condensed matters Shur1 ; Shur2 . The relaxation times of initial TCF (the existence duration of correlations in considered system) and memory functions of the th order (the duration of existence of memory) can be determined as follows: . The simplest criterion for the quantitative estimation of non-Markovity in the given relaxation process is determined as: . When , the relaxation time of the memory function of the first order is much smaller than the relaxation time of the initial TCF. In this case the process is characterized with a very short memory, in the limit it is a Markovian process. Particularly, our work Yulm3 proposes the way of the transformation from non-Markovian kinetic equations to Markovian in case, when the non-Markovian parameter tends to infinity. Decreasing the parameter determines the relative memory lengthening and strengthening of non-Markovian time effects. Thus, the presented quantitative criterion characterizes the degree of non-Markovity and strength of memory in the underlying relaxation process.
Later Shur3 ; Shur4 a conception of non-Markovian parameter spectrum and markovization depth for nonequilibrium processes in disordered condensed matter was introduced. These parameters are related to fundamental properties of the system as well as the memory function, the memory life time and demarkovization of the process by means of the initial TCF. The spectrum of non-Markovian parameter is a set of dimensionless values:
Here is a relaxation time of memory function of th order, the number defines the relaxation level.
The quantitative information measure of memory of force variability was assessed by calculating the statistical spectrum of non-Narkovity parameter (NMP). The equation:
| (1) |
where is the number of relaxation levels in kinetic description main of the time series, allow to calculate NMP from the power spectra of memory function of th order . The mathematical procedure for a finding of consist in the calculation:
| (2) |
where is the memory function of th order, , is the discretization time, is the number of signals in time series. Memory functions, phase portraits of the dynamical orthogonal variables, and set of dynamical orthogonal variables of junior orders were calculated by the methods of well-known statistical theory of stochastic discrete non-Markov processes in complex systems with applications to cardiology, seismology, physiology etc. The full details of the theory have been described elsewhere main ; eqpap ; ycard ; jetp .
III.2 The correlation and relaxation analysis of force variability.
The structure of correlation, relaxation and memory processes in force variability will be examined by using time and frequency analysis of correlation and studied relaxation processes. Correlation and relaxation rates for the short-range () and long-range (=) relaxation (correlation) were used to consider the force signal. We shall calculate a general relaxation time in a frame of relaxation theory developed below.
Let’s consider the structure of the initial time correlation function of the force output time series signals. It is convenient to consider the chain of interconnected equations for the TCF in a frame of well-known Zwanzig’-Mori’s kinetic theory main ; eqpap ; ycard ; jetp :
| (3) |
Here, the parameter and define the local and memory channel relaxation (correlation) rates on the th relaxation levels, correspondingly. Parameters has the dimension of relaxation rate, and has a dimension of a square of frequency.
The structure of correlation and relaxation processes in force variability will be examined by using time and frequency analysis of correlations and studied relaxation processes. Correlation and relaxation rates for the short-range () and long-range (=) relaxation (correlation) were used to consider the force signal. We shall calculate a general relaxation time in a frame of relaxation theory developed below.
Let’s consider a partial solution of system (3) when we can use the time-scale invariance idea in nonequilibrium statisticalw physics of condensed matter TPre ; JetpL ; JPhys ; Ball :
| (4) |
on the second relaxation level. It means the approximate equality of memory life-times on the first and second relaxation levels. The similar condition is carried out in many concrete cases. The condition (4) apply on our situation as we shall see later. Using the Laplace transform on the normalized TCF :
| (5) |
memory functions and , one can obtain solution of Eqns. (3):
| (6) | |||
where , i=1, 2. If we determine the general relaxation time by the relation , where means real part, the resulting general equations for consequently can be written in the following way:
| (7) |
if . Then we receive the formula:
| (8) |
for , .
The equations (7), (8) are our new theoretical results and they allow to calculate a general relaxation time for the various relaxation scenario. One can see from Eqns. (7), (8) that general relaxation behavior is defined by complicated nonlinear interactions and combinations of short-range and long-range relaxation processes on the first and second relaxation levels. Therefore, the general behavior of relaxation time is determined by a complicated combination of relaxation rates , , and on these two interconnected relaxation levels. Calculating these five relaxation parameters : , , , and we can receive a rather detailed and specific singularities of relaxation processes in a complex systems.
IV Results
Figure 1 shows force output from young (B), old (C), and older-old (D) participants at 20% MVC at the constant (t1) and sine wave (t2) targets. The amount of force variability was examined by calculating the root mean square error (see, for details Vall5 ).
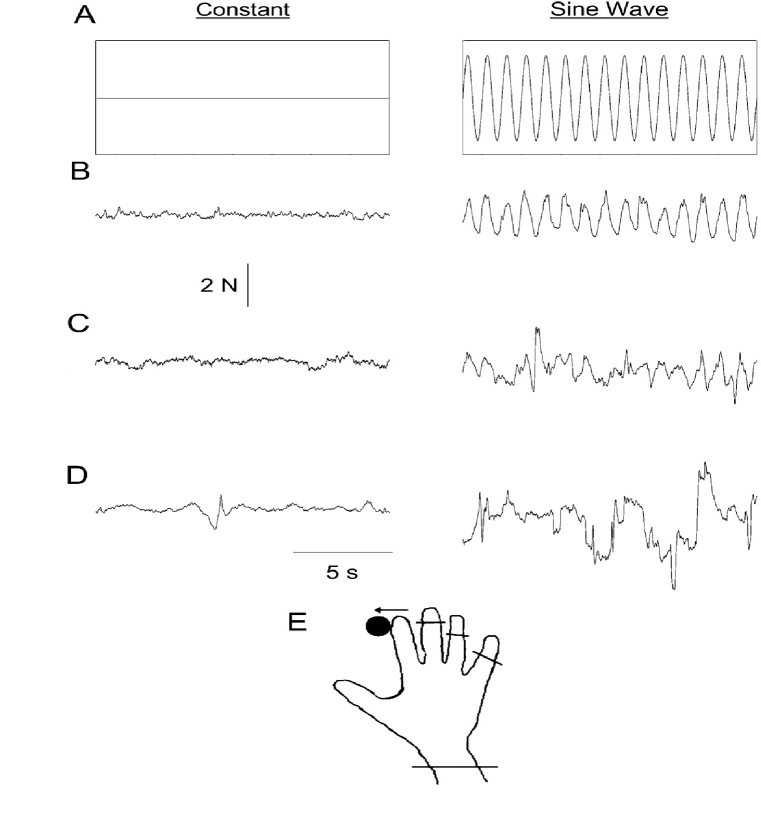
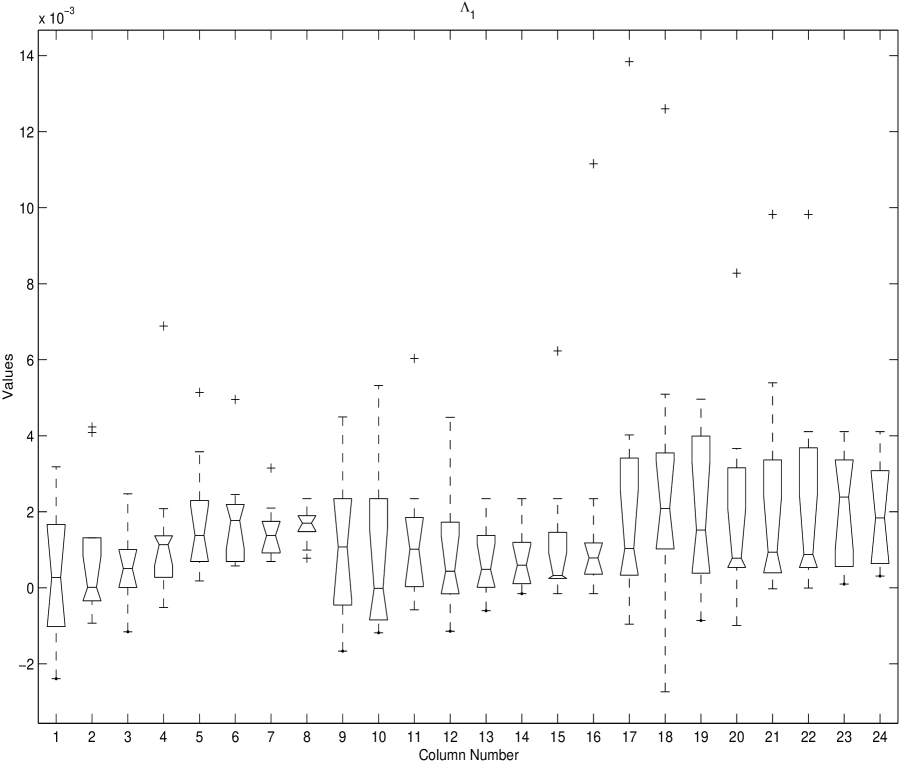
Figure 2 depicts the values of short-range relaxation parameter on a first relaxation level ( is the corresponding relaxation rate) with following name structure.
| 1 - s1c1t1 | 9 - s2c1t1 | 17 - s3c1t1 |
| 2 - s1c1t2 | 10 - s2c1t2 | 18 - s3c1t1 |
| 3 - s1c2t1 | 11 - s2c2t1 | 19 - s3c2t1 |
| 4 - s1c2t2 | 12 - s2c2t2 | 20 - s3c2t2 |
| 5 - s1c3t1 | 13 - s2c3t1 | 21 - s3c3t1 |
| 6 - s1c3t2 | 14 - s2c3t2 | 22 - s3c3t2 |
| 7 - s1c4t1 | 15 - s2c4t1 | 23 - s3c4t1 |
| 8 - s1c4t2 | 16 - s2c4t2 | 24 - s3c4t2 |
The file naming includes the experimental design AGE GROUP (3)
FORCE LEVEL (4) TRIALS (2):
s1, s2, s3 (group
number): s1-young (20-24 years), s2-old (64-69 years), s3-oldest
old (75-90 years);
c1, c2, c3, c4 (force level): c1-5%, c2-10
%, c3-20 %, c4-40 %;
t1, t2 (trial number): t1-trial 1,
t2-trial 2.
Each file contains 25 force data (in Newtons) collected at 100 . A more detailed description of the experiment and data collection is found in Vall5 .
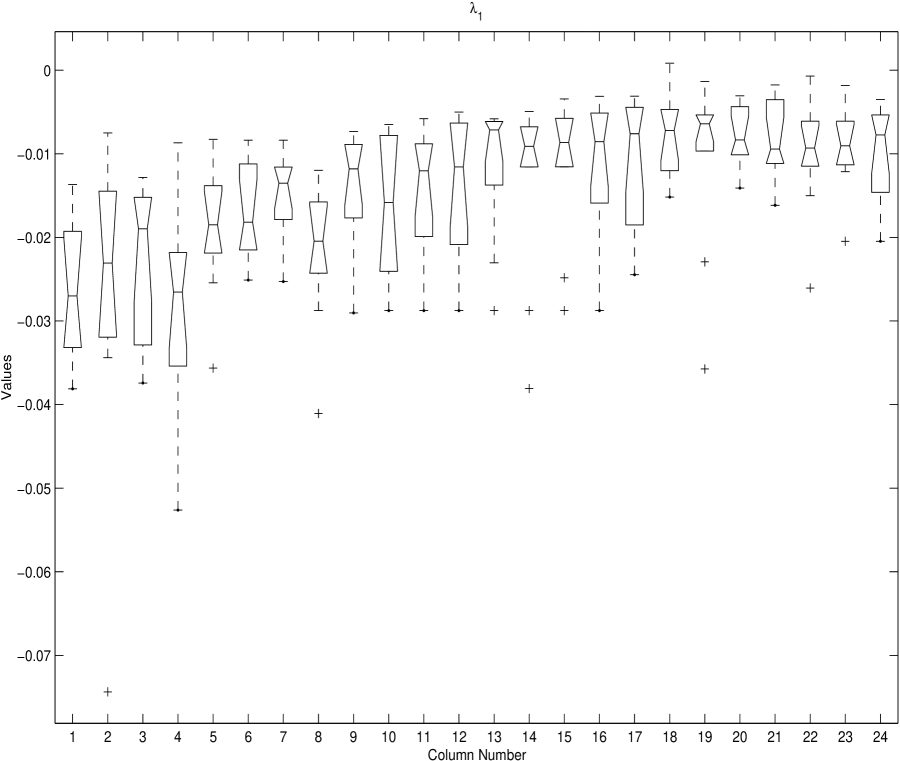
Figure 2 shows numerical values of parameter for all three groups s1, s2 and s3. In Figure 2 the box lines at the lower quartile, median and upper quartile values. The whiskers are lines extending from end of the box to show the extent of the rest of the data. Outliers are data with values beyond the ends of the whiskers. We should add still, that first eight boxes correspond to s1 group, next eight boxes correspond to the second (s2) group and last ones correspond to the third (s3) group. One can calculate from Fig. 2 that the mean value of parameter for first (s1) group is , for second (s2) group , and for third (s3) group of participants . Similar distinction in rates and times of the short-range relaxation is quite explainable with the physiological points of view. We shall note, that the greatest distinction in young and old groups achieves 3,47 times. From physical point of view it means a more fast relaxation of the force fluctuation for young and more slower relaxation for old and oldest old.
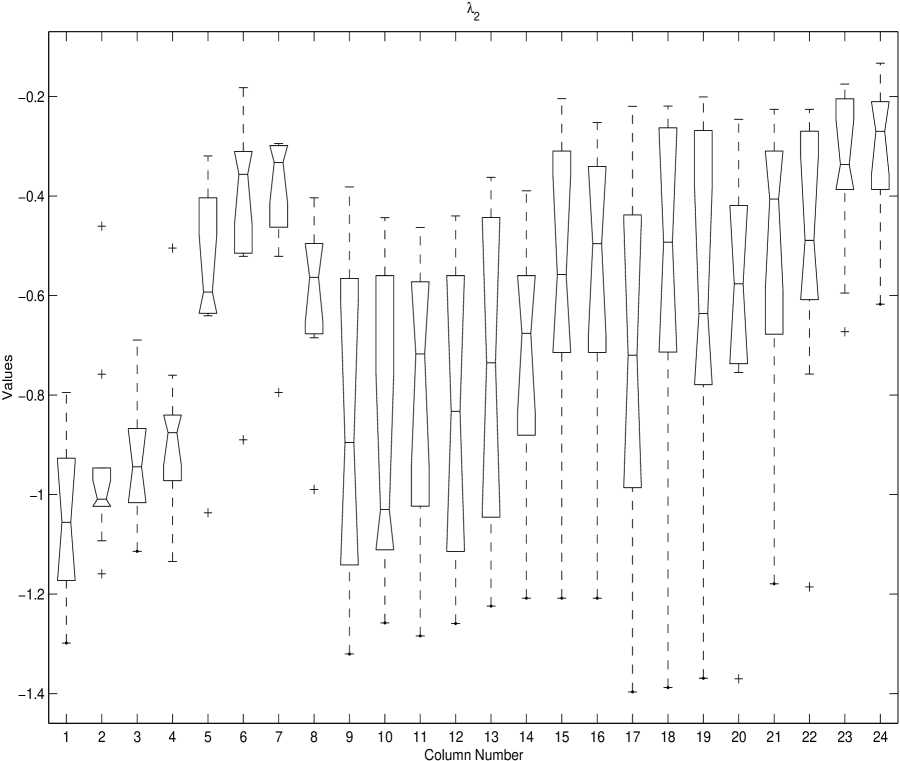
Figure 3 show a similar behavior of the second short-range relaxation parameter for all studied groups of participants. Authentic appreciable distinction (in 2,11 times) in relaxation rates for young for force levels c1, c2 and c3, c4 pays on itself attention. Average values in units of in young group (0,778) and old (0,795) almost coincide with each other. Distinctions between force levels c1, c2 and c3, c4 in group oldest old is almost twofold. The greatest relaxation rate is registered in young group at low force levels (c1, c2). The least relaxation rate is observed as for young group at high force levels (c3, c4), and for oldest old group s3 at high force levels (c3, c4).
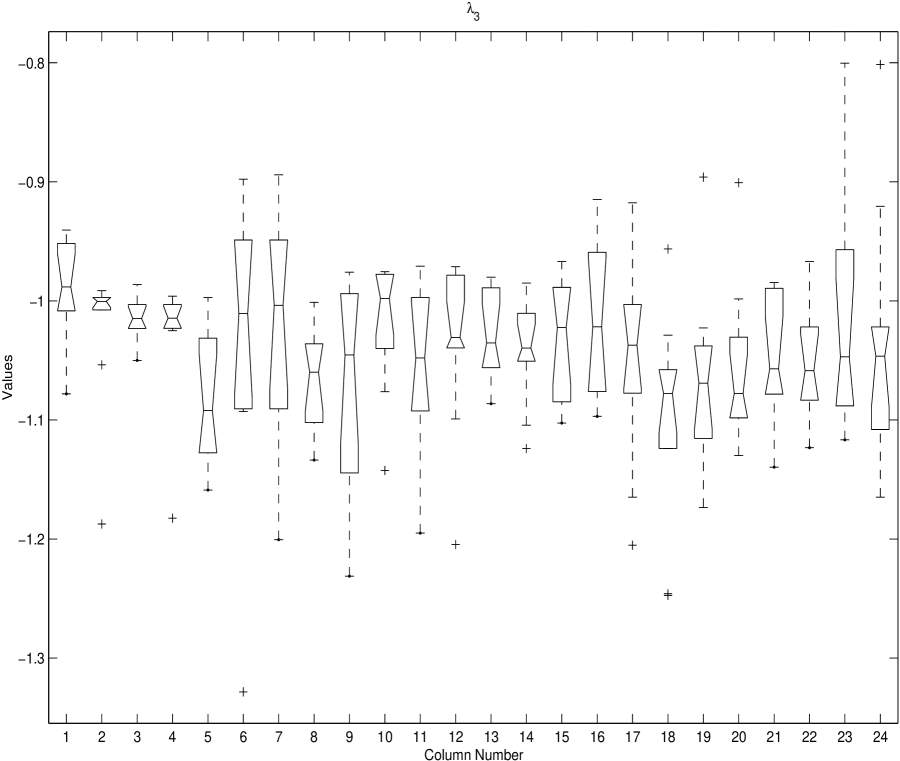
The behavior of the third relaxation parameter is displayed on Figure 4. Relaxation rate on the third relaxation a level is appeared, approximately, identical for the all three age groups.
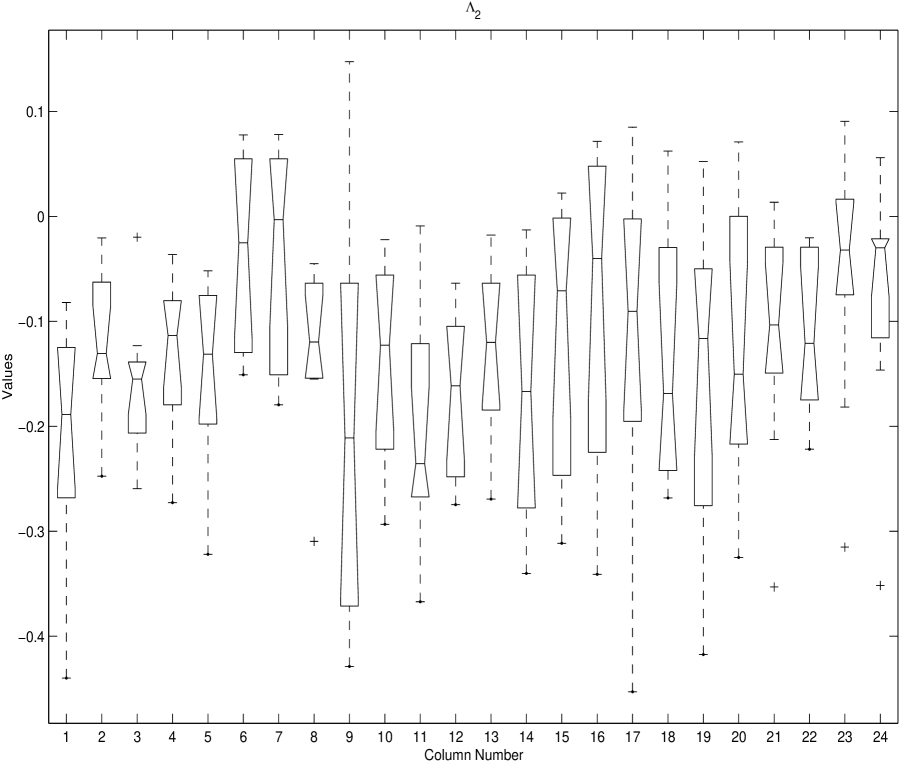
Relaxation parameters and , connected with long-range time correlations, are shown in Figures 5 and 6 in units of . Relaxation time for the first relaxation levels are almost identical to all three age groups (s1, s2 and s3). It testifies that long-range correlations mechanism of force relaxation, practically does not depend on age (average for groups s1, s2 and s3, are equal, respectively, 0,98 ; 1,16 and 0,98 ). Relaxation parameter turn out as negative for all three age groups s1, s2 and s3. This testify to a change of relaxation mode at the transition from the first on second relaxation levels. Relaxation times for groups s1, s2 and s3 changes slightly (they are equal 0,96 ; 0,79 and 1,11 , correspondingly). It can testify upon the weak age changes in long-range relaxation mechanism of force output fluctuations.
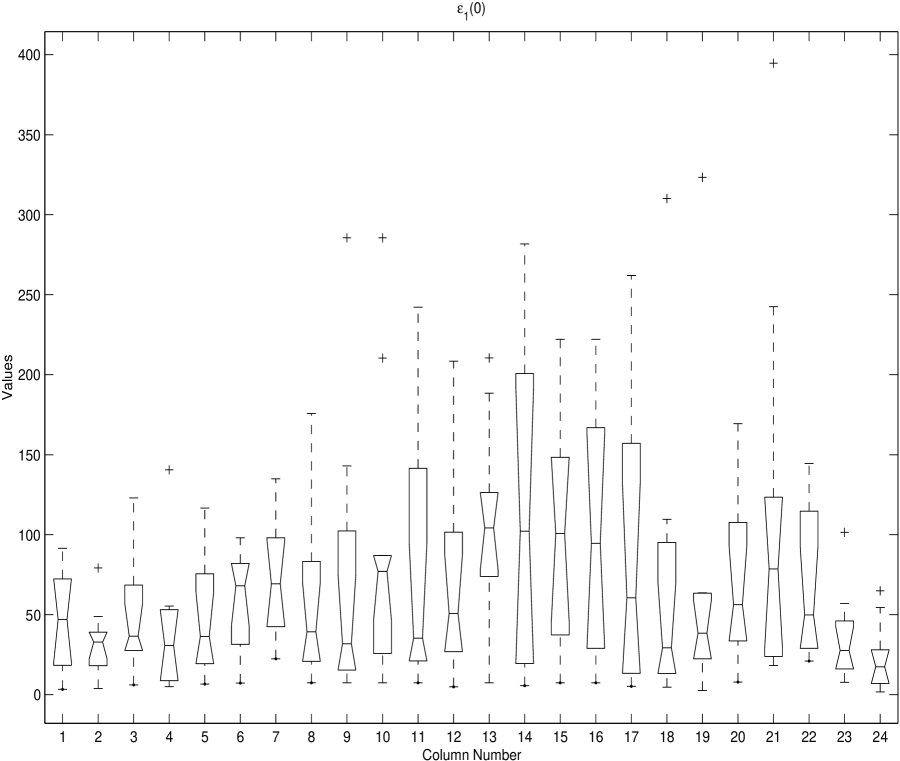
In Fig. 7 one can see a values of non-Markovity parameter of the first relaxation level on zero frequency for three age groups s1, s2 and s3. Appreciable interest represent, that in young group (average value ) and oldest old group () the chaoticity and randomness is approximately the same. Simultaneously it is obvious, that the greatest chaoticity appears in group old participants s2. Fig. 8 presents statistical non-Markovity parameter on the second level for the all age groups. One can note, that everywhere is almost identical and equal unity. From results of Fig. 8 it follows, that a condition of applicability of time-scale invariance idea and approximate equality of memory life-time on the first and second relaxation levels (see, Eqn. (2)) is carried out with the high degree of accuracy. Because of the experimental data submitted on Fig. 8, one can use Eqns. (6) - (7) for calculation of general relaxation time .
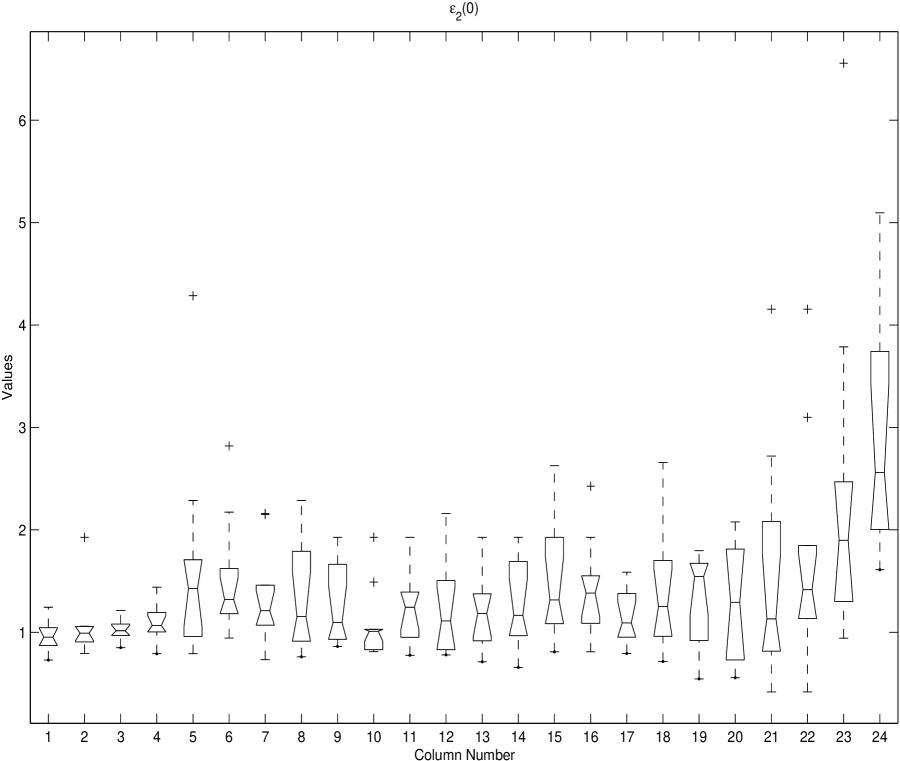
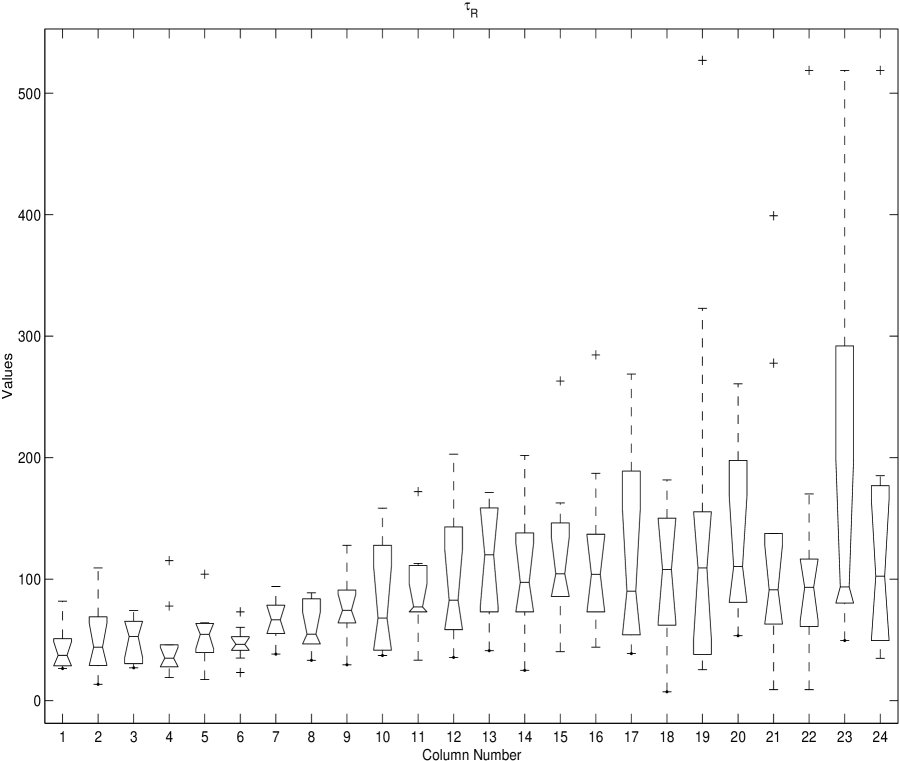
Fig. 9 presents a values of time calculated according our theory, Eqns. (6), (7), for all studied groups of participants. Mean relaxation time for young group (s1) at enhancement of force level (from c1, c2 to c3, c4) increase from value 42,5 up to value 56,07 . For the group of young mean is 49,3 , where as for the group of old and oldest old mean is equal 91,1 and 99,8 , correspondingly. It means, that a general relaxation time at ageing increases on two times, approximately.
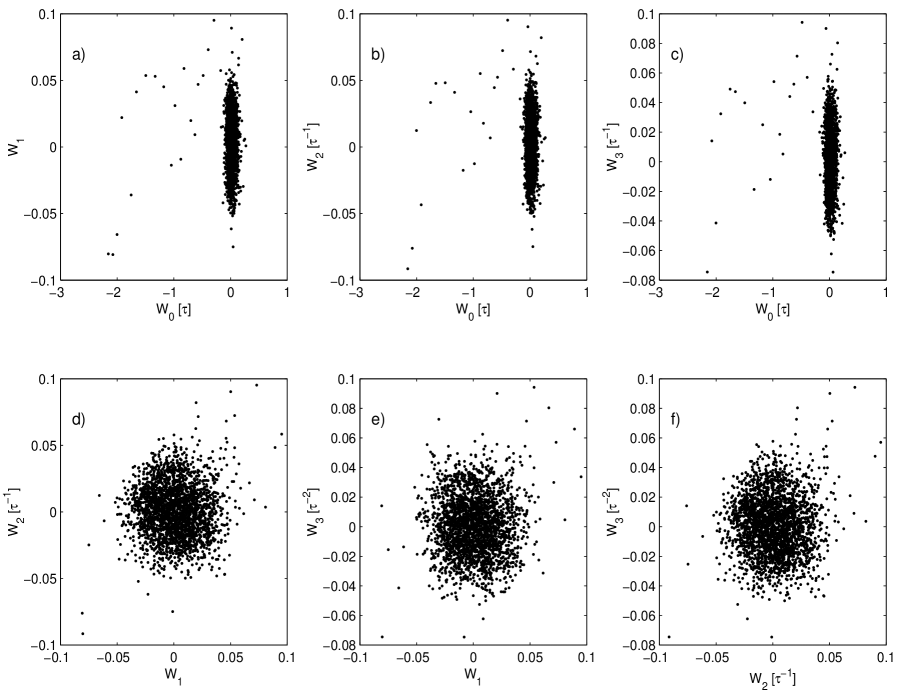
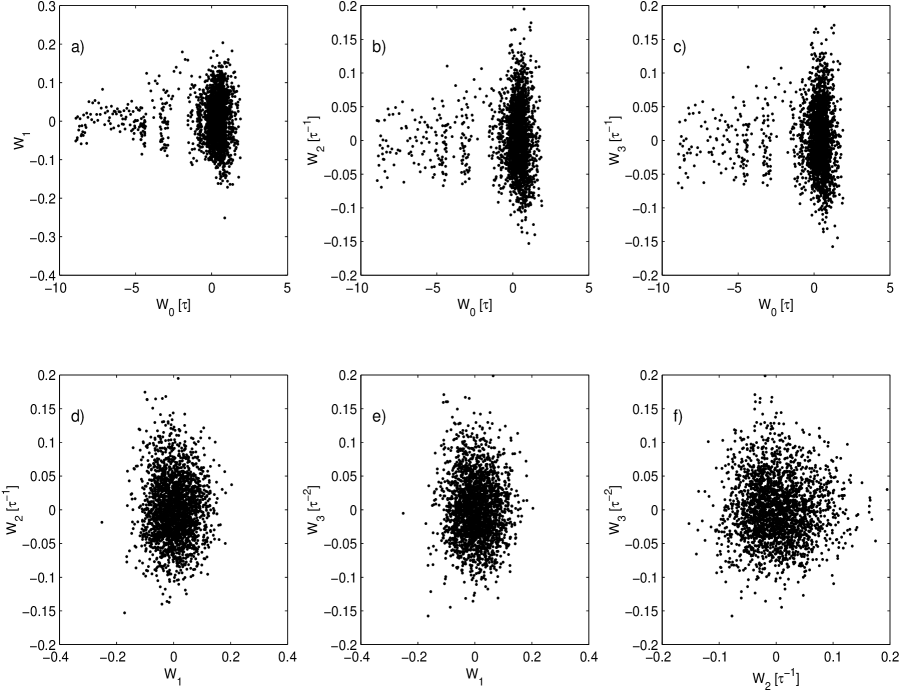
Fig. 10 shows the phase portraits in a planes of four junior orthogonal dynamic variables , , and , calculated according theory main ; eqpap ; ycard for experimental file named s1c1t2 (B4) as an example. These portraits appears symmetrical in planes: , and . Slight deviation from this symmetry one can see for planes of junior variables , i=1,2,3. Phase clouds are dense and concentrated.
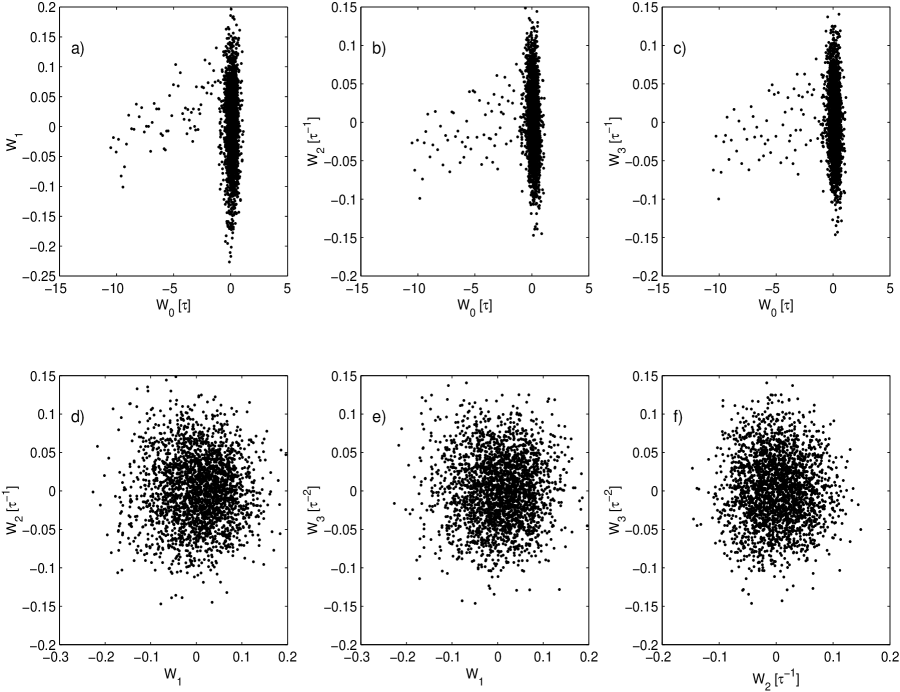
Fig. 11 present phase portraits for file name s1c4t1 of young participant (B4) at highest force level (40 %). One can note a significant multifold swelling of volume of all phase clouds. This testify the noticeable increasing of chaoticity of motor force activity for this case.
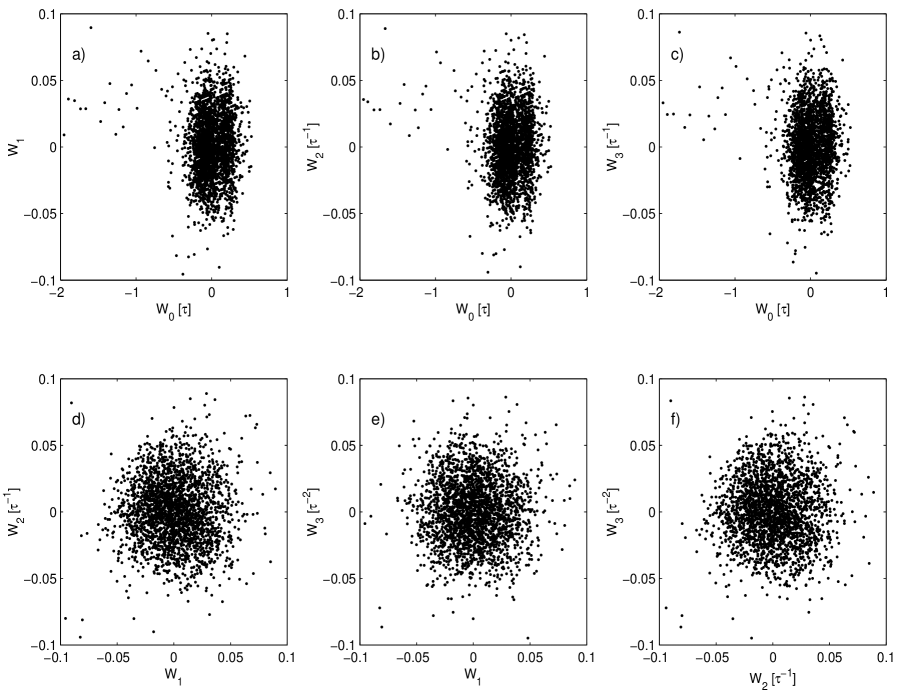
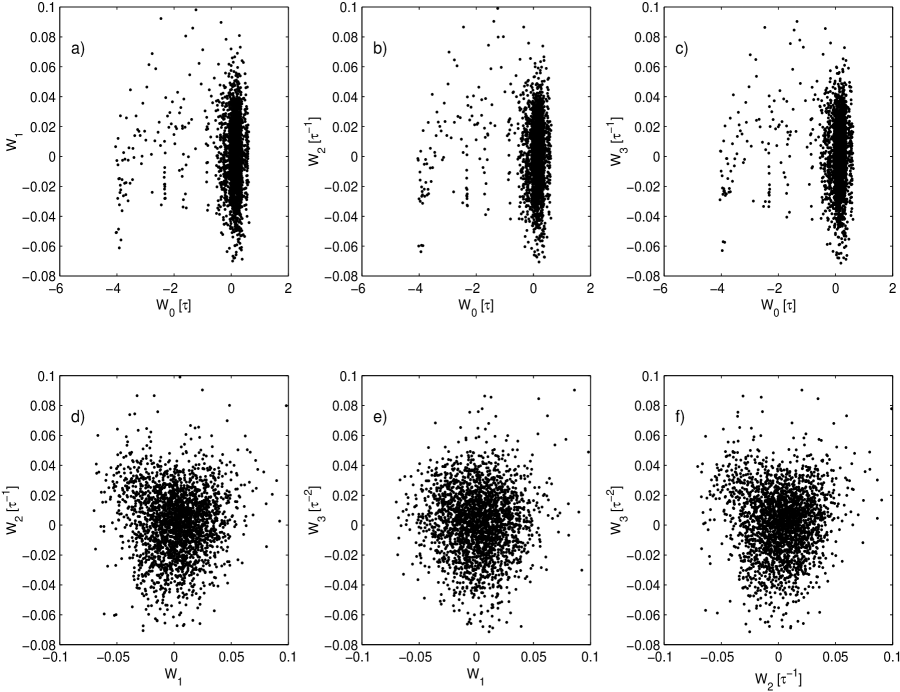
Figs. 12 and 13 depict a change of the structure of phase clouds for old participant (C2) for force levels c1t2 and c4t4, as an example, correspondingly. From Fig. 12 one can find the effect of condensation of all phase clouds. It corresponds to lowest value of the first non-Markovity parameter and weakly marked chaoticity of force fluctuation. At the transition to other force level (c4, 40 %) from Fig. 13 one can see the remarkable increasing of the volumes of all phase clouds and their appreciable asymmetry. It lead to increasing of chaoticity of force fluctuation almost 7 times ().
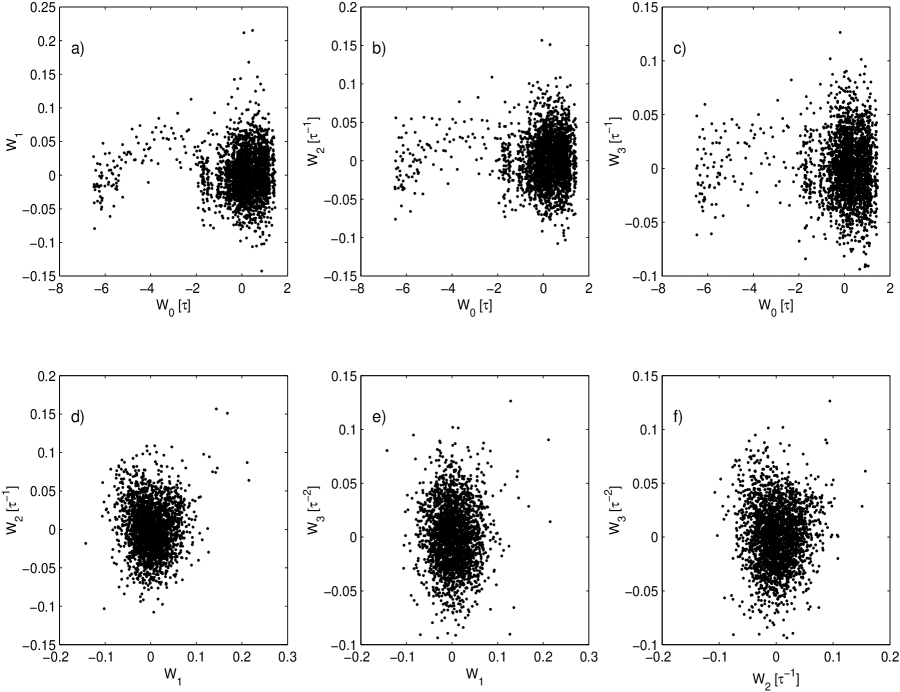
Phase clouds for oldest old participants (D8) for force levels c3t1 and c4t2 are shown on Fig. 14 and Fig. 15, correspondingly. One can observe a change of distribution of phase points from consolidated ones (for planes , and ) to a more scattered distribution at transition from force state c3t1 to state c4t2. Simultaneously, a slight amplification of asymmetry of phase clouds in planes of junior variables , j=1,2,3 occurs. Thus, a quantitative measure of memory on the first relaxation level does not varies almost (it equal 24 and 27, correspondingly). Therefore, the degree of Markovization and chaoticity for these two cases does not change.
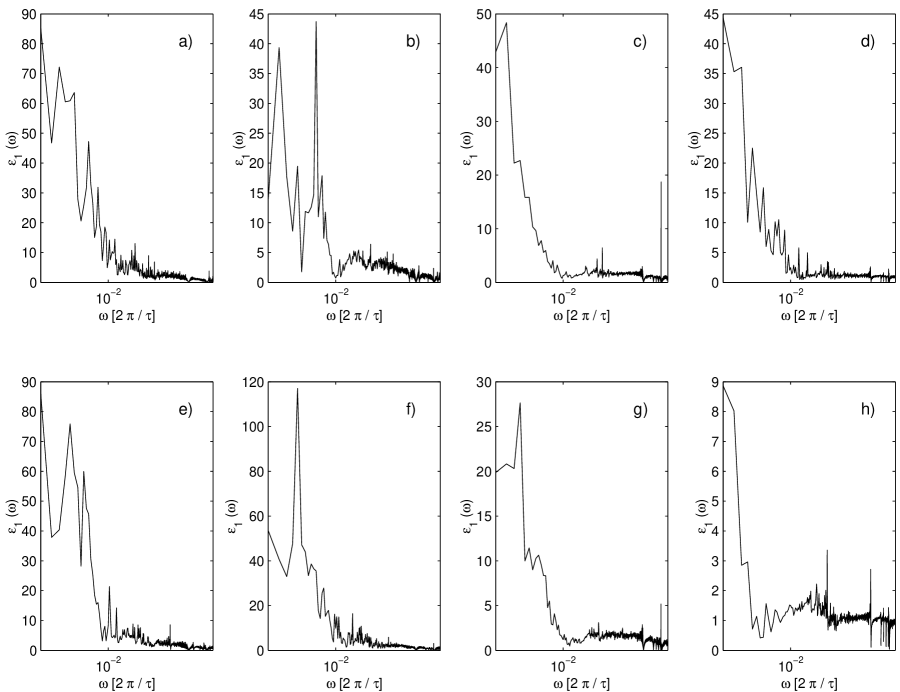
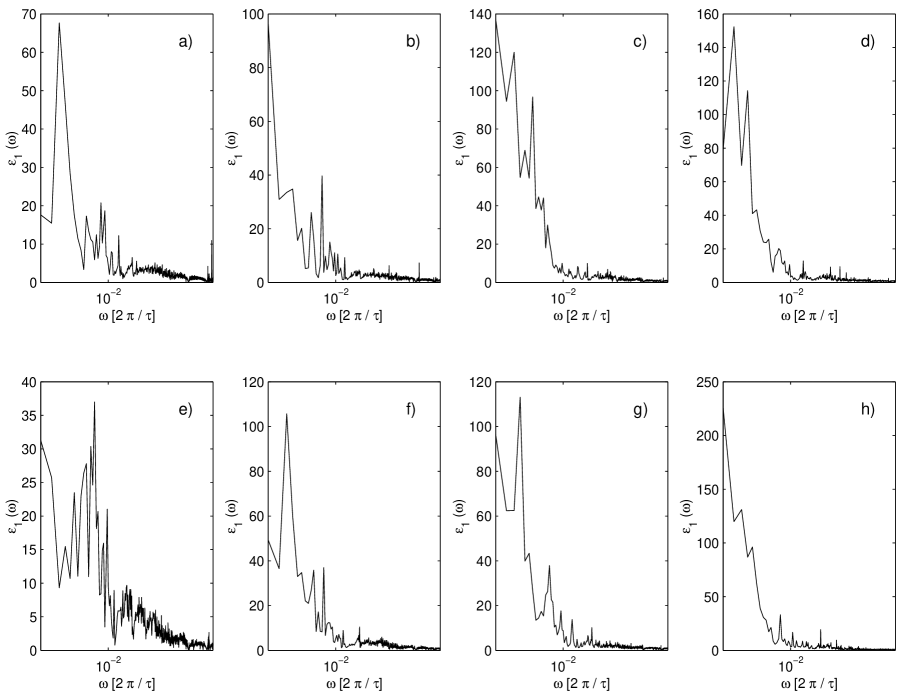
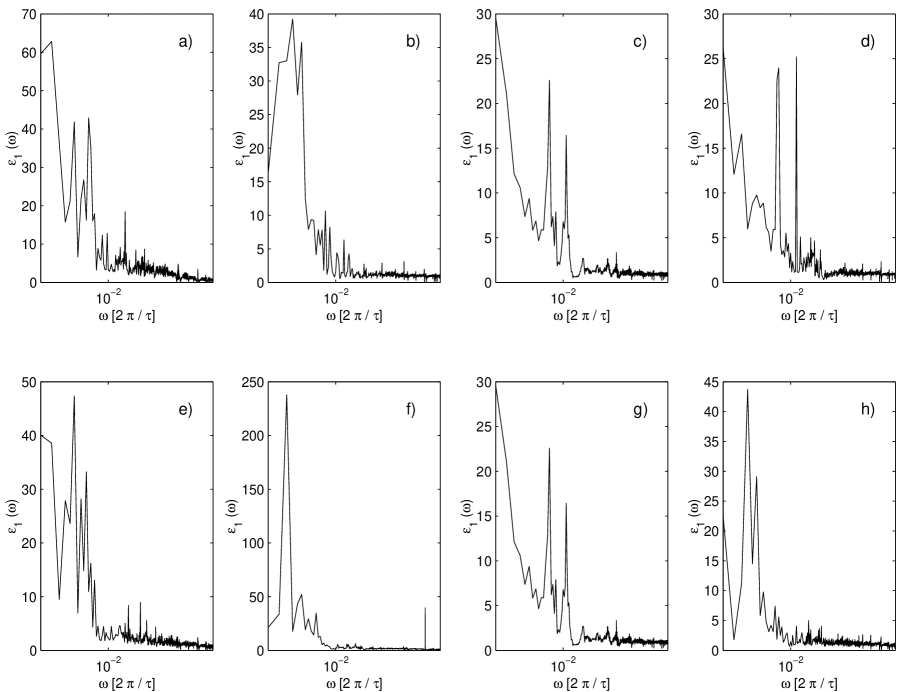
Figs. 16,17 and 18 demonstrate a frequency dependence of the first non-Markovity parameter for young (B5) old (C2) and oldest old (D2) participants in all force levels as an examples. From Fig. 16 for participant D5 one can see that Markov effect at ultralow frequency remain constant at force level t1 (constant). At sine wave (e,f,g,h) force output task one can observe a progressive and steady decline of (from value of 50 on value of 8). It is connected with a reduction of Markov effects and steady amplification of non-Markov effects. Similar behavior of reflects the appearance of slight robustness in force fluctuation for young participants in process of increasing of force level. A data for old (C2) presents opposite example, as can one see from Fig. 17. We see a drastic amplification of Markov effects in process of enhancement of force level for constant (a,b,c,d) and sine wave (e,f,g,h) force output task. This means a steady Markovization of a process, that is, a steady amplification of Markov random effects. From Fig. 18 one can note analogous behavior of for oldest old (D2) at the constant (a,b,c,d) and sine wave (e-h) force output task. It testifies about a gradual and more distinctive display of non-Markov effects and robustness in force behavior for participant (D2).
V Discussion and conclusion
The purpose of this study was to examine the structure in the time and frequency domains of force output variability as a function of human aging.
For the analysis of force fluctuation we have used the statistical relaxation singularities of motor system related to the short-range and long-range time correlation.
It is necessary to emphasize some fundamental points, following from the study. Force output dynamics for all three groups of healthy (young, old and oldest old) can be characterized rather a high level of chaoticity and randomness on the first relaxation level of force output fluctuation. For all files studied we have found out, that changes in a wide interval of values (7-300). It allows to state a strong chaotization and sharp expressed Markov effects for all healthy groups. As is known, beginning of illnesses, for example Parkinson disease (see, for instance, PhysaGait ) results to suppression of Markov effects and appearance of non-Markovity effects and robustness.
The same level of a randomness observed for young and oldest old turned out to be unexpected. Thus, on average the rather highest level of a randomness are registered in old group. These values of NMR signify healthy state for studied participants. Therefore it is possible to state with assurance that the information measure of mamory is the greater for old, but it is smaller for young and oldest old groups. Steady non-Markovity on the second relaxation level for all three age groups confirms our supposition for the advantage of time-scale invariance idea of relaxation processes of force output fluctuation on these level.
The relaxation singularities of force output fluctuations consist in the following. At the first relaxation level a remarkable distinction of relaxation rates of force output fluctuation is observed. It means that relaxation related to the short-range correlation is a more fast at low force level. With the enhancement of force levels the relaxation is rather decelerated. Noticeably more slow relaxation appears in two old groups s2 and s3. Hence we can conclude that aging becomes apparent as the notably slowing-down of relaxation processes, connected with the effect off the short-range correlation. In the second relaxation level contribution of short-range correlation for all age groups are the same. At that we notice stably (more than 2 times) decreasing of the relaxation rate with increasing of force level (from c1,c2 to c3,c4).
The following fact attract our steadfast attention. One can note, that contribution of long-range correlations in relaxation rates is, approximately, identical for the all three age groups and it does not depend on age on the first relaxation level. However, in young group here specific features are observed. They are that here relaxations rates increase, on the average, at 1,5 times at hight force levels (c3 and c4). On the second relaxation level the similar picture is kept.
For analysis of experimental data we have developed here the statistical theory of relaxation of force output fluctuation with taking into account: first two relaxation levels and effects of two relaxation channels. One of the relaxation channel contains the contribution of short-range correlation whereas other component of relaxation reflects the effect of long-range correlation. The analysis of experimental data shows, that one can determine the general behavior of relaxation processes as a whole by a complicated combination and nonlinear interaction of these two above stated relaxation processes.
VI Acknowledgments
This work was partially supported by the RFBR (Grant no. 05-02-16639-a), Grant of Federal Agency of Education of Ministry of Education and Science of Russian Federation (Grant no. RNP 2.1.1.741). This work has been supported in part (P.H.) by the German Research Foundation, SFB-486, project A10.
References
- (1) Lipsitz Z. A. and Goldberger A. Z. Loss of ”complexity” of cardiovascular dynamics: a potential marker of vulnerability to disease. Chaos 5 102 (1995).
- (2) Valliancourt D. E. and Newell K. M. Changing of complexity in human beahaviour and physiology throuth aging and deasese. Neurobilogical Aging 23 1 (2002).
- (3) Valliancourt D. E. and Newell K. M. Responce to rewievers commentaries. Neurobilogical Aging 23 27 (2002).
- (4) Goldanski M. E., Fuglevand A. J. and Enoka R. M. Reduced control of motor output in a human hand muscule of eldery participants during submaximal contractions. J. Neurophysiol 69 2108 (1993).
- (5) Zaidlow D. H, Bilodeau M. and Enoka R. M. Steadness is reduced and motor unit discharge is more variable in old adults. Muscle Neve 23 600 (2000).
- (6) Tracy B. L and Enoka R. M. Older adults are less steady during submaxial isometric contractions with the knee extensor muscles. J. Appl. Physiology 92 1004 (2002).
- (7) Valliancourt D. E., Zarsson L. and Newell K. M. Effects of aging on force variability, motor unit discharge patterns and the structure of 10, 20, and 40 Hz EMG activity. Neurobiology of aging 24 25 (2003).
- (8) Goldberger A. L. and West B. J. Fractals in physiology and medicine. Yale J. Biol. Med. 60 421 (1987).
- (9) Hausdorff J. M., Peng C. K., Ladin Z., Wei J. Y. and Golberger A.L. Is walking a random walk? Evidence for long-range correlations in stride interval of human gate. J. Appl. Physiol. 78 349 (1994).
- (10) Kaplan D. T., Furman M. I., Pincus S. M., Ryan S. M., Lipsitz L. A. and Goldberger A. L. Aging and comlexity of cardiovascular dynamics. Biophys. J. 59 945 (1991).
- (11) Newell K. M. and Corcos D. M. (Editors) Variability and motor control, Champaign, IL: Human Kinetics, 1993.
- (12) Yulmetyev R., Hänggi P. and Gafarov F. Stochastic dynamics of time correlation in complex systems with discrete current time. Phys. Rev. E 62 6178 (2000).
- (13) Yulmetyev R., Gafarov F., Hänggi P., Nigmatullin R. and Kayumov S. Possibility between earthquake and explosion seismogram differentiation by discrete stochastic non-Markov processes and local Hurst exponent analysis. Phys. Rev. E 64 066132 (2001).
- (14) Yulmetyev R., Hänggi P. and Gafarov F. Quantification of heart rate variability by discrete non-stationary non-Markov stochastic processes. Phys. Rev. E 65 046107 (2002).
- (15) Yulmetyev R., Hänggi P. and Gafarov F. Stochastic processes of demarkovization in chaotic signals of human brain electric activity from EEG’s during epilepsy. JETP 96 572 (2003).
- (16) Shurygin V. Yu., Yulmetyev R. M. and Vorobjev V. V. Physical criterion of the degree of non-Markovity of relaxation processes in liquids. Phys. Lett. A 148 199 (1990).
- (17) Shurygin V. Yu. and Yulmetyev R. M. The space dispersion of the structure relaxation in simple liquids. Zh. Eksp. Teor. Fiz. 99 144 (1991).
- (18) Yulmetyev R. M., Shurygin V. Yu. and Khusnutdinov N. R. Transformation of Non-Markovian Kinetic Equation for TCF to Markovian Type. Acta Phys. Pol. B 30 881 (1999).
- (19) Shurygin V. Yu., Yulmetyev R. M. and Vorobjev V. V. On the spectrum of the non-Markovity parameter of relaxation processes in liquids. Zh. Eksp. Teor. Fiz. 102 852 (1992).
- (20) Shurygin V. Yu. and Yulmetyev R. M., The spectrum of the non-Markovity parameter for relaxation processes in liquids. Phys. Lett. A 174 433 (1993).
- (21) Yulmetyev R. M., Gafarov F. M., Yulmetyeva D. G. and Emeljanova N. A. Intensity approxamation of random fluctuation in complex systems. Physica A 303 427 (2002).
- (22) Yulmetyev R. M., Emelyanova N. E., Hänggi P., Gafarov F. M. and Prokhorov A. O. Long-range memory and non-Markov statistical effects in human sensomotor coordination. Physica A 316 671 (2002).
- (23) Yulmetyev R., Demin S., Emelyanova N., Gafarov F. and Hänggi P. Stratification of the phase clouds and statistical effects of the non-Markovity in chaotic time series of human gait for healthy people and Parkinson patients. Physica A 319 432 (2003).
- (24) Yulmetyev R. M., Mokshin A. V., Hänggi P. and Shurygin V. Yu. Time-scale invariance of relaxation processes of density fluctuation in slow neutron scattering in liquid cesium. Phys. Rev. E 64 057101 (2001).
- (25) Yulmetyev R. M., Mokshin A. V., Hänggi P. and Shurygin V. Yu. Dynamic structure factor in liquid cesium on the basis of time-scale invariance of relaxation processes. JETP Lett. 76 147 (2002).
- (26) Yulmetyev R. M., Mokshin A. V., Scopigno T. and Hänggi P. New evidence for the idea of timescale invariance of relaxation processes in simple liquids: the case of molten sodium. J. Phys.: Condens. Matter 15 2235 (2003).
- (27) Ballucani U., Lee M. H. and Togneth V. Dynamical correlations. Phys. Reports 373 409 (2003).
- (28) Valliancourt D. E. and Newell K. M. Aging and time and frequency structure of force output variability. J. Appl. Physiol. 94 903 (2003).