Evolution of a Powerful Radio Loud Quasar 3C 186 and its Impact on the Cluster Environment at z=1
Abstract
X-ray cluster emission has been observed mainly in clusters with “inactive” cD galaxies ( erg sec-1), which do not show signs of accretion onto a SMBH. Our recent Chandra discovery of 100 kpc scale diffuse X-ray emission revealed the presence of an X-ray cluster associated with the radio loud quasar 3C 186 at redshift z=1.1 and suggests interactions between the quasar and the cluster. In contrast to the majority of X-ray clusters the 3C 186 cluster contains a quasar in the center whose radiative power alone exceeds that which would be needed to quench the cluster cooling. We present the Chandra X-ray data and new deep radio and optical images of this cluster. The 3C 186 quasar is a powerful Compact Steep Spectrum radio source expanding into the cluster medium. The 2 arcsec radio jet is unresolved in the Chandra observation, but its direction is orthogonal to the elliptical surface brightness of the cluster. The radio data show the possible presence of old radio lobes on 10 arcsec scale in the direction of the radio jet. We discuss the nature of this source in the context of intermittent radio activity and the interaction of the young expanding radio source with the cluster medium.
Center for Astrophysics, 60 Garden St., Cambridge, MA 02138
Steward Observatory, University of Arizona, Tucson, AZ
KIPAC, Stanford University, Stanford CA 94305
Johns Hopkins University, Baltimore, MD
Department of Physics, University of Bristol, Tyndall Ave., Bristol, UK
1. Introduction
We present an X-ray cluster at redshift z=1.1 associated with the radio loud quasar 3C 186. Diffuse X-ray emission surrounding a luminous quasar has only been detected around a handful of low-redshift () radio-loud quasars (Siemiginowska et al. (2005), Stockton et al. (2006)) and around a few radio galaxies (Belsole et al. 2006). 3C 186 cluster is at high redshift. Its X-ray surface brightness is high enough to allow for measuring the cluster redshift and constraining the properties of the cluster at . This paper discusses the properties of the quasar, the cluster and their interactions.
2. 3C186: Quasar
3C 186 is a very luminous quasar (L erg sec-1). It has a strong big blue bump (BBB) in the optical-UV band and broad optical emission lines. The quasar SED is shown in Fig. 2 The strong big-blue bump emission is generally interpreted as thermal emission from an accretion disk surrounding the SMBH. The total luminosity of the 3C 186 BBB is equal to erg s-1. Assuming accretion at the Eddington limit we obtain a black hole mass of 4.5M⊙. Using the measurement of CIV FWHM from Kuraszkiewicz et al. (2002) and the scaling from reverberation mapping (Vestergaard 2002) the estimated mass of black hole is larger and equal to 3.2M⊙. Thus the central SMBH is large and given the required accretion rate of M⊙ yr-1 to power this system it is still growing.
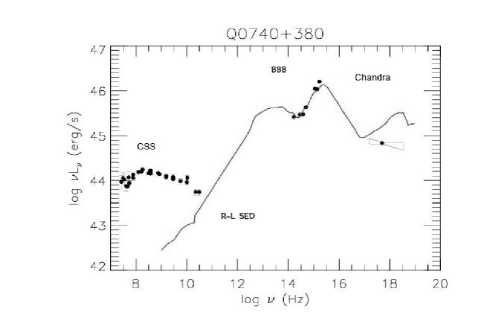
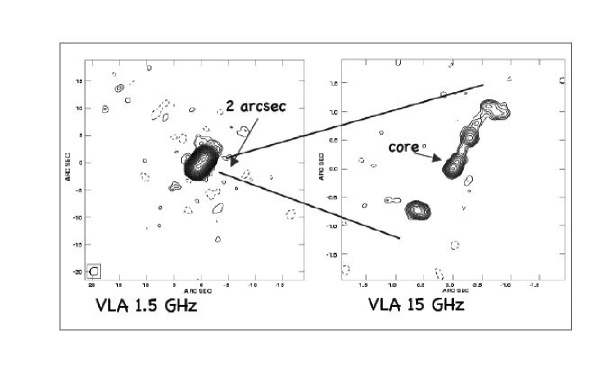
The quasar is extremely radio loud (radio loudness equal to ) as shown in Fig.2 where the average radio-loud quasars SED from Elvis et al. (1994) is drawn for a comparison. The radio morphology in Fig. 3 shows two components separated by 2′′ and a jet connecting the core and NW component. Murgia et al. (1999) estimated the age of the source to be of the order of years based on the spectral age of the radio source.
3. 3C186: Cluster
3.1. X-ray Cluster
Chandra detected 740 source counts in a diffuse emission surrounding the quasar. We fitted the X-ray spectrum and determined a cluster redshift of and estimated the X-ray cluster parameters (see Siemiginowska et al. (2005)). The temperature of 5.2 keV and gas mass fraction of are typical of other clusters at this high redshift (Vikhlinin et al. 2002). Modeling of the cluster surface brightness gives a normal value of =0.64, but a relatively small core radius of 45 kpc. The cluster luminosity, erg sec-1 is typical for the measured cluster temperature.
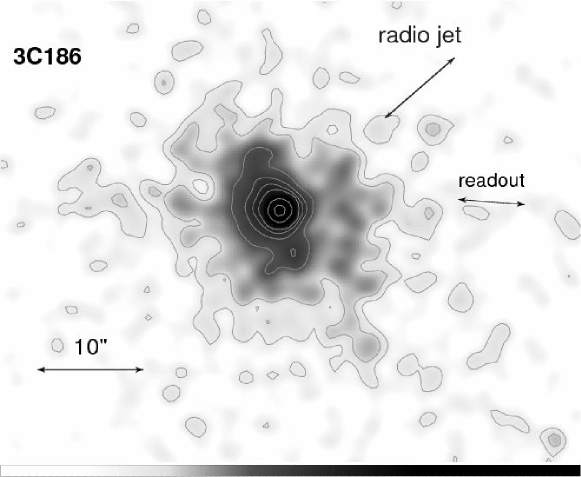
Diffuse X-ray cluster emission is detected out to arcsec ( 120 kpc, Fig. 1). The X-ray cluster emission is non-symmetric and elongated in the NE-SW direction. This structure is orthogonal to the 2 arcsec radio jet unresolved in the Chandra observation. The hardness ratios indicate possible spectral differences within the NE-SW sectors with the harder emission towards the NE. Fitting a thermal model shows temperature variations between 3.7 keV and 4.9 keV, but with large errors 1.5-2 keV.
3.2. Optical Cluster
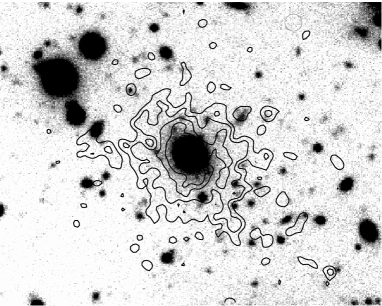
Quasars are usually observed to be offset from the optical peak emission in rich clusters at high redshift (Barr et al. 2003) suggesting loosely bound systems such as groups or proto-clusters, in the process of forming and undergoing mergers. The optical image (GEMINI, GN=2007A-Q-110) of the cluster taken in February 2007 is overlayed with the Chandra X-ray contours and is presented in Fig.4. There are many faint candidate cluster members in the field and their distribution will provide information about the structures formed in this cluster. We currently have a program to measure redshifts of the galaxies in the cluster field.
4. Quasar-Cluster Interaction
The 3C 186 radio jet and two hot spots are not resolved in the Chandra X-ray image. The hot spots are separated by 16 kpc and located outside the host galaxy. Thus the jet is moving within the cluster medium. There are two aspects of the possible quasar cluster interaction: (1) cluster impact on the jet motion and (2) a transfer of the jet power to the cluster medium. The presence of the cluster allows us also to look for the signature of past quasar activity in the form of a relic radio source.
4.1. Jet Progress
Based on the cluster central density and temperature, we estimate a thermal pressure of dyn cm-2. If this pressure is higher than the pressure within the expanding radio components then the cluster gas may be responsible for confining the radio source and its small size. Taking the radio spectral index to be 1, and approximating each component as a homogeneous spheroid, we estimate the minimum pressure in each radio component to be 10-8 dyn cm-2. Thus the radio source is highly overpressured by about 2-3 orders of magnitude with respect to the thermal cluster medium and its expansion has not been affected by the medium.
The jet might also interact and be stopped by a clumpy cold medium of the host galaxy (Carvalho et al 1998, De Young 1991) and clouds with densities of 1-30 cm-3 are required to confine a jet. To estimate the total size of the clumpy medium we can use the limit to the total X-ray absorbing column density intrinsic to the quasar. The X-ray absorption limit of cm-2 gives the size of any clumpy medium along the line of sight of order 10-100 pc compared with the 16 kpc diameter of the radio source. Any such region cannot significantly limit the expansion of the radio source (see also discussion in Guainazzi et al. (2004)).
4.2. Cluster Heating
The radio components are overpressured with respect to the thermal cluster gas. Thus the expansion of these components into the cluster medium could potentially heat the center of this cluster. The energy dissipated into the cluster by the expanding radio components has been widely discussed in the context of low redshift clusters, where there is evidence for repetitive outbursts of an AGN. However, the details of the dissipation process are undecided.
We estimate the energy content of the hot cluster gas assuming a total emitting volume of 2.3cm3 and keV, to be of the order of 2 ergs. Using the 151 MHz flux density of 5.9 erg sec-1 cm-2 Hz-1 Hales et al. (1993)Willott et al. (1999) scaling which accounts for the total radio emission from the jet and hot spots, the jet kinetic power is of order erg sec-1. If the expanding radio source dissipated this jet energy into the cluster’s central 120 kpc region, then the heating time would be 108 years. We can also estimate the amount of mechanical work done by the jet and radio components during the expansion to the current radio size (cm3) as ergs. If the expansion velocity is of the order of 0.1 then the radio source has been expanding for about years with an average power of 6 erg sec-1. The estimated jet power is orders of magnitude higher.
4.3. Relic?
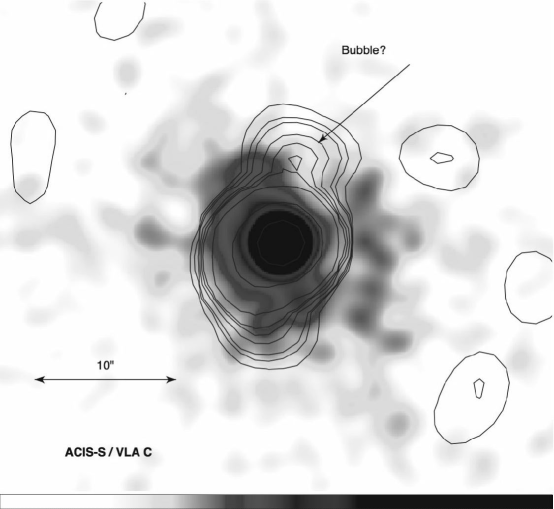
Large scale radio emission can indicate quasar radio activity in the past. We obtained a deep VLA image of 3C 186 in July 2005 to look for any emission associated with the discovered X-ray cluster. In Fig. 5 we show the smoothed ACIS-S image overlayed with 1.4 GHz radio contours from our observation. Extended emission is visible in N-S direction in the radio contours. Note that the elongation is slightly different than the elongation of X-ray emission, so the northern radio “lobe” points to a location of lower surface brightness in the cluster.
We estimated a negative signal (“bubble”) in the X-ray data at the location of the northern radio lobe by comparing a number of counts in a circular region (=2.5”) centered on this lobe to the background counts in an annulus at the same distance from the quasar. We detect a deficit of -13.9 counts (1.5) at that location.
5. Summary
-
•
We detect a powerful radio loud quasar in an X-ray cluster at redshift .
-
•
Based on radio and X-ray observations we conclude that the radio source has not been confined by the cluster gas.
-
•
The source is at an early stage of expansion.
-
•
Possible relic activity reflected in the X-ray and radio emission will be confirmed with the future Chandra and VLA observations.
-
•
Optical spectroscopy is needed to determine redshifts of the galaxies and the cluster members.
Acknowledgments.
This research is funded in part by NASA contract NAS8-39073 and the Chandra grants GO-01164X, GO2-3148A and GO-6113X. The VLA is a facility of the National Radio Astronomy Observatory is operated by Associated Universities, Inc. under a cooperative agreement with the National Science Foundation.
References
- Barr et al. (2003) Barr, J. M., Bremer, M. N., Baker, J. C., & Lehnert, M. D. 2003, MNRAS, 346, 229
- Belsole et al. (2006) Belsole, E., Worrall, D. M., & Hardcastle, M. J. 2006, astro-ph/0610124, and MNRAS submitted
- Carvalho (1998) Carvalho, J. C. 1998, A&A, 329, 845
- De Young (1991) De Young, D. S. 1991, ApJ, 371, 69
- Elvis et al. (1994) Elvis, M., Fiore, F., Wilkes, B., McDowell, J., & Bechtold, J. 1994, ApJ, 422, 60
- Guainazzi et al. (2004) Guainazzi, M. et al. 2004, A&A, 421, 461
- Hales et al. (1993) Hales, S. E. G., Baldwin, J. E., & Warner, P. J. 1993, MNRAS, 263, 25
- Kuraszkiewicz et al. (2002) Kuraszkiewicz, J. K. et al. 2002, ApJS, 143, 257
- Martini et al. (2006) Martini, P. et al. 2006, ApJ, 644, 116
- Murgia et al. (1999) Murgia, M. et al. 1999, A&A, 345, 769
- Siemiginowska et al. (2005) Siemiginowska, A. et al. 2005, ApJ, 632, 110
- Stockton et al. (2006) Stockton, A., Fu, H., Henry, J. P., & Canalizo, G. 2006, ApJ, 638, 635
- Vestergaard (2002) Vestergaard, M. 2002, ApJ, 571, 733
- Vikhlinin et al. (2002) Vikhlinin, A. et al. 2002, ApJ, 578, L107
- Willott et al. (1999) Willott, C. J., Rawlings, S., Blundell, K. M., & Lacy, M. 1999, MNRAS, 309, 1017