The Case of the 300 kpc Long X-ray Jet in PKS 1127-145 at z=1.18
Abstract
The complex X-ray morphology of the 300 kpc long X-ray jet in PKS 1127-145 (z=1.18 quasar) is clearly discerned in a 100 ksec Chandra observation. The jet X-ray surface brightness gradually decreases by an order of magnitude going out from the core. The X-ray spectrum of the inner jet is relatively flat with and steep in the outer jet with . The X-ray and radio jet intensity profiles are strikingly different, with the radio emission peaking strongly at the two outer knots while the X-ray emission is strongest in the inner jet region. We discuss the constraints implied by these data on the X-ray emission models and conclude that “one-zone” models fail and that at least a two-component model is needed to explain the jet’s broadband emission. We propose that the X-ray emission originates in the jet proper while the bulk of the radio emission comes from a surrounding jet sheath. We also consider intermittent jet activity as a possible cause of the observed jet morphology.
Harvard-Smithonian Center for Astrophysics 60 Garden St., Cambridge, MA 02138
Kavli Institute for Particle Astrophysics and Cosmology, Stanford University, Stanford CA 94305
Copernicus Astronomical Center, Warsaw, Poland
Steward Observatory, University of Arizona, Tucson, AZ
1. Introduction
The origin of the X-ray emission in quasar jets is puzzling (see Harris & Krawczynski 2006, for review) because a straight extrapolation of the synchrotron radio-to-optical continuum into the X-rays underpredicts the luminosity of powerful Chandra large scale jets. Thus, the same single power-law population of electrons cannot produce the radio, optical, and X-ray emission in the framework of a homogeneous one-emission zone approximation (e.g. Sambruna et al. 2004) The synchrotron self-Compton (SSC) process cannot easily explain the data because it does not produce enough X-rays at the equipartition fields and therefore requires large departures from the minimum-power condition (Chartas et al. 2000; Harris & Krawczynski 2002; Kataoka & Stawarz 2005). The alternative scenario involves inverse-Compton scattering of the Cosmic Microwave Background (IC/CMB) photons implying large jet bulk Lorentz factors () at hundreds of kpc from the active nuclei (Tavecchio et al. 2000; Celotti et al. 2001; Schwartz 2002). In this paper we discuss the constraints on the X-ray emission models given by the Chandra and VLA observations of the PKS 1127-145 jet.
2. Jet Properties
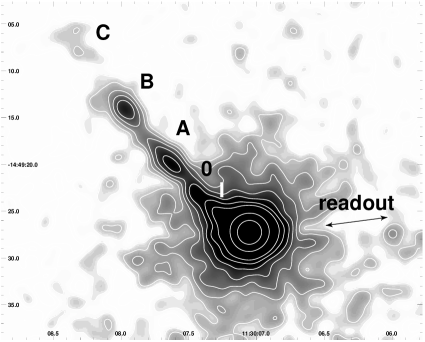
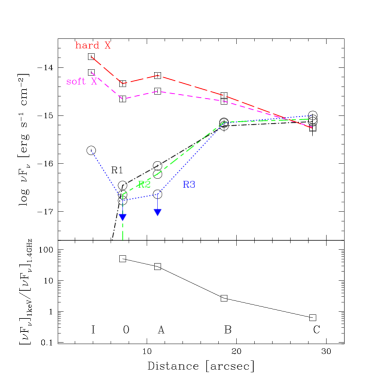
One of the longest X-ray jets known (see http://hea-www.harvard.edu/XJET/) is associated with the redshift z=1.18 radio-loud quasar PKS 1127-145 (Fig. 1). This jet poses several questions for X-ray emission models (see Siemiginowska et al. 2002, 2007). The jet morphology is complex with several knots seen in the X-ray image (Fig. 1) with the furthest knot C being the weakest. The prominent knots A and B are connected by continuous X-ray emission that stops beyond knot B at arcsec from the core. The VLA radio maps show low brightness emission along the jet (Fig. 2). The one-sided jet shows an X-ray surface brightness which declines with the distance from the core, while the radio brightness increases (Fig. 3[left]). The X-ray to radio intensity ratio decreases along the jet. Fig.3[right] shows the changes to spectral index along the jet. The radio spectrum is steep and X-ray spectrum is flat in the inner jet regions. There are only upper limits to the knots optical brightness, but they are too high for constraining the emission models. Thus only radio and X-ray observations can be used to study emission processes in this jet. We discuss the constraints on the models below.


3. Jet Emission Models
A detailed discussion of the model constraints can be found in Siemiginowska et al. (2007). Here we give a summary of the main results:
3.1. One Zone Model Failures
Synchrotron
X-ray emission requires a continuous acceleration of high energy particles along the jet. The expected distribution of the freshly accelerated electrons gives as observed in the inner jet, but the radio spectrum is steep with (Fig.3). A different cooling mechanism or difference in electron populations emitting radio and X-rays is needed.
IC/CMB
models in the simplest version involve an adiabatically expanding jet. In this case the observed inverse-Compton (X-rays) and synchrotron (radio) intensity ratio is different than the predicted one. In the case of an efficient jet confinement with some deceleration and B-field amplification it is possible to get an agreement between the predicted and the observed luminosity ratios, but the required B-field amplification is high []. In this case for the equipartition at there will be no equipartition at . The expected radio spectrum should steepen more significantly than the X-ray spectrum. The observed behavior is different: decreases, while increases (Fig.3[right]).
3.2. Two-Component Model: The Jet and a Sheath
Radio and X-ray emissions are produced in two separate regions. The X-ray emission comes from the proper relativistically moving jet and the radio emission from the sheath - a slow moving radial extension of the jet boundary layer. The X-ray emission is due to synchrotron or IC/CMB process.
Proper Jet:
The observed smooth decrease of the X-ray flux, when unconnected with the increase of the radio one, is expected as a result of the decrease in the inverse-Compton or synchrotron luminosities along decelerating and/or expanding jet.
Sheath:
The sheath dominates the jet’s radio emission and has two cooling regions: (1) radiative cooling at the inner sheath: Myr Myr. Due to the frequency dependent losses a steep radio spectrum is expected in this regime. (2) Adiabatic cooling in the outer sheath: Myr. Because of the frequency independent losses a flat spectrum is expected.
3.3. Modulated Jet Activity?
Can the morphology of the 300 kpc long jet be a result of the intermittent activity of the quasar? The knots are potentially too large (10 kpc) to be considered a result of extended shock waves formed within a continuous jet outflow. They might form during episodes of separate continuous activity. Then the size gives a duration for each epoch of years. The radio core can be related to blazar phenomena (Błażejowski et al. 2004), but the core also resembles a compact GPS object at this time.
4. Summary
The key results of this project:
-
•
The jet is long: radio and X-ray jet emission is detected up to 300 kpc (projected distance) from the core.
-
•
The jet X-ray brightness is decreasing while the radio brightness is increasing with distance from the quasar.
-
•
The one component X-ray/radio emission models failed to explain the observations.
-
•
X-ray and radio jet properties suggests two separate components for the jet emission.
-
•
Intermittent quasar activity might be reflected in the observed jet morphology: each knot represents a continuous jet activity with a duration of 105years.
Acknowledgments.
This research is funded in part by NASA contract NAS8-39073 and Chandra Awards GO5-6113X, GO4-5131X, GO5-6118X, GO5-6111X. The National Radio Astronomy Observatory is operated by Associated Universities, Inc. under an agreement with the National Science Foundation.
References
- Błażejowski et al. (2004) Błażejowski, M. et al. 2004, ApJ, 600, L27
- Celotti et al. (2001) Celotti, A., Ghisellini, G., & Chiaberge, M. 2001, MNRAS, 321, L1
- Chartas et al. (2000) Chartas, G., et al. 2000, ApJ, 542, 655
- Cheung et al. (2006) Cheung, C. C., Stawarz, Ł., & Siemiginowska, A. 2006, ApJ, 650, 679
- Harris & Krawczynski (2002) Harris, D. E., & Krawczynski, H. 2002, ApJ, 565, 244
- Harris & Krawczynski (2006) Harris, D. E., & Krawczynski, H. 2006, ARA&A, 44, 463
- Kataoka & Stawarz (2005) Kataoka, J., & Stawarz, Ł. 2005, ApJ, 622, 797
- Sambruna et al. (2004) Sambruna, R. M. et al. 2004, ApJ, 608, 698
- Schwartz (2002) Schwartz, D. A. 2002, ApJ, 569, L23
- Siemiginowska et al. (2002) Siemiginowska, A. et al 2002, ApJ, 570, 543
- Siemiginowska et al. (2007) Siemiginowska, A. et al. 2007, ApJ, 657, 145
- Tavecchio et al. (2000) Tavecchio, F., Maraschi, L., Sambruna, R. M., & Urry, C. M. 2000, ApJ, 544, L23