Investigation of the Contamination of the Gould (2003) Halo Sample
Abstract
A recent astroph posting argued that the Gould (2003a) halo sample is substantially contaminated with thick-disk stars, which would then “wash out” any signature of granularity in the halo velocity distribution due to streams. If correct, this would imply that the limits placed by Gould (2003b) on streams are not valid. Here I investigate such contamination using six different indicators, 1) morphology of the underlying reduced proper motion diagram used to select halo stars, 2) comparison of kinematic and parallax-based distance scales 3) comparison of derived halo parameters for the Gould (2003a) sample with other determinations 4) a precision color-color diagram for a random subsample 5) the 3-dimensional velocity distribution of a random subsample 6) metallicity distribution versus kinematic cuts on a random subsample I estimate that the contamination is of order 2 percent. Thus, the upper limits on the density of nearby streams derived by Gould (2003b) remain valid. In particular, at 95% confidence, no more than 5% of local halo stars (within about pc) are in any one coherent stream. Determining whether or not this local measurement is consistent with CDM remains an outstanding question.
Subject headings:
stars:halo – galaxies:substructure1. Introduction
A critical test of the current picture of hierarchical structure formation, is measuring the ”granularity” or substructure within the halo as a function of Galactocentric distance. Gould (2003b) determined that, contrary to naive expectation within this framework, the local Galactic halo is remarkably smooth, with only possible contribution from substructures. However, this conclusion is only as good as the underlying Gould (2003a) sample: significant contamination by thick-disk stars would tend to “wash out” any substructure signal (Kepley et al., 2007). Prompted by this concern, I demonstrate below through six different tests, that this sample is not in fact seriously contaminated and therefore that the current (still valid) limit of substructure must be understood by current models of Galaxy formation.
2. Morphology of the rNLTT Reduced Proper Motion Diagram
The Gould (2003a) halo sample is derived from the revised New Luyten Two-Tenths (rNLTT) catalog of Gould & Salim (2003) and Salim & Gould (2003). The argument made by Kepley et al. (2007) for contamination of this sample is that Ryan & Norris (1991) found such contamination among the halo candidates that they had extracted from the underlying Luyten (1979, 1980) NLTT catalog.
Figures 1 and 2 (both taken from Salim & Gould 2002) show the reduced proper motion (RPM) diagrams for the NLTT and rNLTT, respectively. Halo stars are clearly separated from disk/thick-disk stars in rNLTT (used by Gould 2003a), but not NLTT (used by Ryan & Norris 1991) .
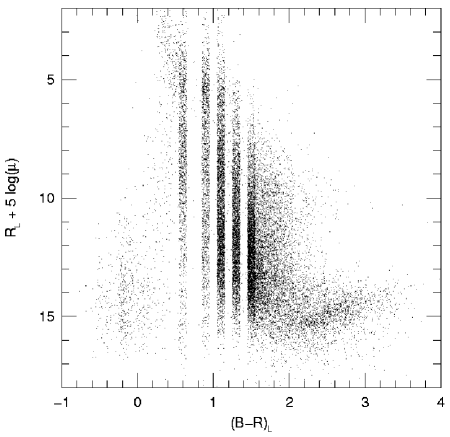
Figures 3 and 4 further confirm the difficulty of extracting a clean sample of halo stars from NLTT. They show the distributions of main-sequence stars and subdwarfs on the NLTT RPM. Clearly, there is no way to select subdwarfs from Luyten’s original NLTT without substantial main-sequence contamination.
Subsequently, Salim & Gould (2003) introduced a further refinement of the optical/infrared RPM of Salim & Gould (2002) by defining a discriminator that depends on both RPM and Galactic latitude :
| (1) |
where is the proper motion in arcsec per year. They identified halo stars as dominant in the range
| (2) |
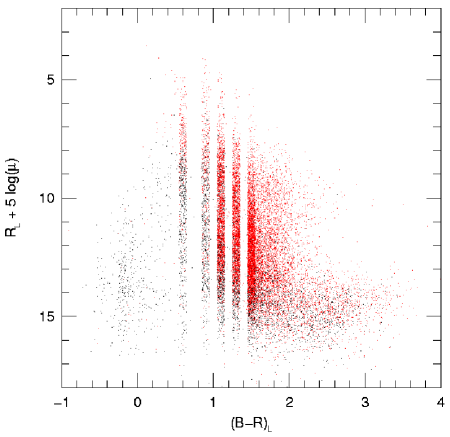
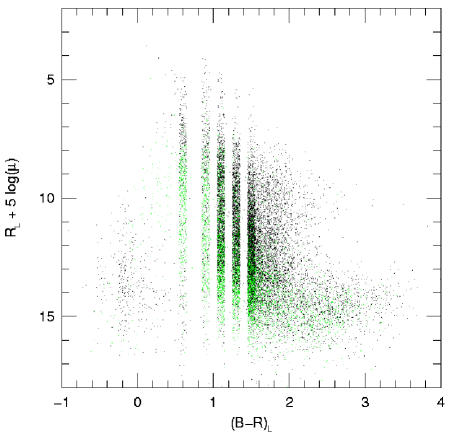
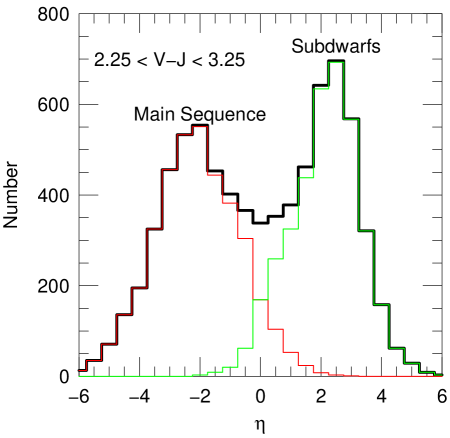
Figure 5, adapted from Salim & Gould (2003) shows (in black) the distribution of in the color range . This confirms quantitatively the visual impression from Figure 2 that there is a clear valley between the subdwarfs and the main-sequence stars. To further clarify the situation I have estimated the subdwarf/main-sequence breakdown in the region of overlap as follows (green and red histograms in figure). First, at the valley minimum () I assigned half the stars to each population. Second, for , I estimated the falling profile of subdwarfs to be the mirror image of their rising profile at high . Third, for , I estimated the falling profile of main-sequence stars to be the mirror image their rising profile at low .
In order to obtain a pure sample of halo stars, Gould (2003a) further restricted the range of relative to equation (2), using
| (3) |
to avoid main-sequence stars at high and white dwarfs at low . From Figure 5, one may estimate that this choice generates roughly 2% contamination.
While I will give several other independent arguments that the sample is not seriously contaminated, this one is the strongest and most quantitative.
3. Comparison of Parallax and Kinematic Distance Scales
A second check comes by comparing the kinematic-based distance scale derived by Gould (2003a) with trigonometric parallaxes found in the literature. To establish distances, Gould (2003a) fit for the two parameters of a linear color-magnitude relation, while enforcing a mean motion of halo stars relative to Sun of , so as to force agreement with the determination of this parameter by Gould & Popowski (1998) based on halo RR Lyrae stars. Gould (2003a) then compared this with the color-magnitude relation derived from halo stars with trigonometric parallaxes from Monet et al. (1992) and Gizis (1997). As can be seen from Figure 6, these relations are virtually identical. If the sample were contaminated with thick-disk stars (whose mean motion motion relative to the Sun is of order 5 times smaller than halo stars) by even 10%, then this would cause an error in the distance scale of , yielding an offset between the parallax and kinematic relations of about 0.17 mag. The offset is clearly much smaller than this.

4. Comparison of Halo Kinematics
It is not only the asymmetric drift of the halo that is correctly reproduced by the Gould (2003a) analysis, but also the velocity dispersions. Gould (2003a) found dispersions in the radial, rotation, and vertical directions of , , and , respectively. These values are quite compatible with other determinations. For example Gould & Popowski (1998) found , , and from a much smaller sample of halo RR Lyrae stars. Serious contamination by the kinematically much cooler population of thick-disk stars would have tended to drive down these dispersions (assuming the distance scale remained in agreement with the parallax stars of Fig. 6).
5. Precision Color-Color Diagram of a Random Subsample
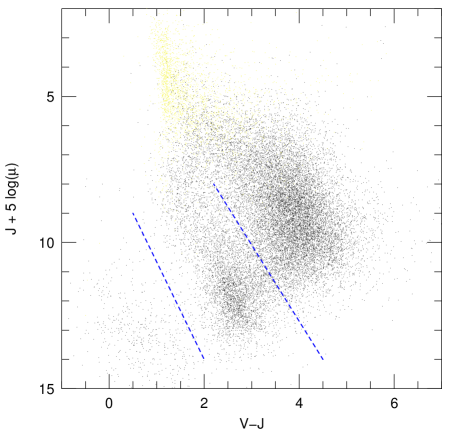
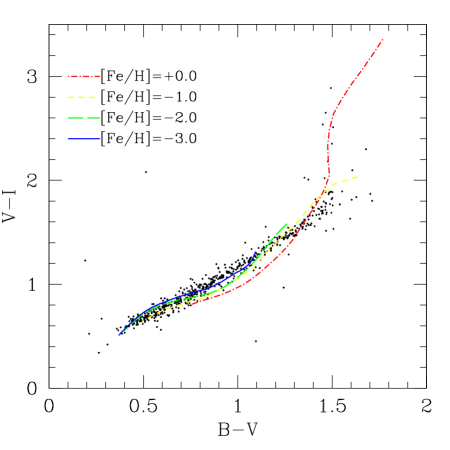
Marshall has obtained precise photometric data for 564 stars selected by applying the same criterion used by Gould (2003a). Her Figure 9 (reproduced here as Fig. 7) shows a very tight color-color relation for these stars, consistent with a metal-poor population. It is clear that the stars extracted by this criterion are not very heterogeneous, as would have been expected were they seriously contaminated.
6. 3-D Velocity Distribution of a Random Subsample
J. Marshall (private communication 2007) has also obtained radial velocities for 295 of the stars in her sample, which (together with her excellent photometry and the rNLTT proper motions) permit her to make 3-dimensional velocity estimates for each star. The results are shown in Figure 8. The distribution is not significantly contaminated by thick-disk stars, which would appear as an overdensity centered at .

7. Metallicity Distribution vs. Kinematic Cuts
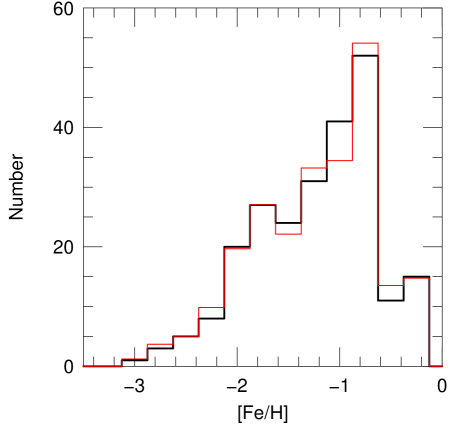
J. Marshall (private communication 2007) was able to make preliminary metallicity measurements for 239 of the 295 halo candidates mentioned in § 6. These permit a direct comparison with the test performed by Ryan & Norris (1991), by which they showed that the halo candidates that they had selected from NLTT were heavily contaminated by thick-disk stars. Figure 9 is the direct analog of Figure 2 from Ryan & Norris (1991). It shows the metallicity for all 239 stars and also for a subsample of 194 “kinematically secure halo stars” defined as the union of stars with either or velocity in the rotation direction . The first point to note is that 82% of the stars are “secure halo” by this definition. The second point is that the metallicity distributions of the two samples are essentially identical. By contrast, Ryan & Norris (1991) found a huge tail of higher-metallicity stars in their full sample, which disappeared when they implemented the same “secure halo star” cut. This brings the argument full circle.
8. Conclusion
Contamination of the original Gould (2003a) halo sample by thick-disk stars is likely to be of order 2%. This implies that the effect of streams is not “washed out” by thick-disk contamination. Hence, the limits on granularity found by Gould (2003b) in this sample imply corresponding limits on streams in the Galactic halo. In particular, at 95% confidence, no more than 5% of local halo stars (within about pc) are in any one coherent stream.
References
- Gizis (1997) Gizis, J.E. 1997, AJ, 113, 806
- Gould (2003a) Gould, A. 2003, ApJ, 583, 765
- Gould (2003b) Gould, A. 2003, ApJ, 592, L63
- Gould & Popowski (1998) Gould, A. Popowski, P. 1998, ApJ, 508, 844
- Gould & Salim (2003) Gould, A. & Salim, S. 2003, ApJ, 582, 1001
- Kepley et al. (2007) Kepley, A. 2007, AJ, in press, astroph/0707.4477
- Luyten (1979, 1980) Luyten, W. J. 1979, 1980, New Luyten Catalogue of Stars with Proper Motions Larger than Two Tenths of an Arcsecond (Minneapolis: University of Minnesota Press)
- Marshall (2007) Marshall, J. 2007, AJ, 134, 778
- Monet et al. (1992) Monet, D.G., Dahn, C.C., Vrba, F.J., Harris, H.C., Pier, J.R., Luginbuhl, C.B., & Ables, H.D. 1992, AJ, 103, 638
- Ryan & Norris (1991) Ryan, S.G. & Norris, J.E. 1991, AJ, 101, 1865
- Salim & Gould (2002) Salim, S. & Gould, A. 2002, ApJ, 575, L83
- Salim & Gould (2003) Salim, S. & Gould, A. 2003, ApJ, 582, 1011