GRB 070311: a direct link between the prompt emission and the afterglow
Abstract
Context. The prompt emission of gamma-ray bursts is mostly thought to be produced in internal shocks of relativistic shells emitted by the progenitor at different times, whereas the late multi-band afterglow is interpreted as the synchrotron emission of electrons swept up by the fireball expanding through the surrounding interstellar medium. The short timescale variability observed in flares superimposed on the X-ray/optical afterglow of several bursts recently made possible by Swift, has been interpreted as evidence for prolonged activity of the inner engine through internal shocks. Yet, it is not clear whether this applies to all the observed bursts and, in particular, whether the bursts exhibiting single -ray pulses with no short timescale variability at late times could also be entirely interpreted as external shocks.
Aims. We present prompt -ray, early NIR/optical, late optical and X-ray observations of the peculiar GRB 070311 discovered by INTEGRAL, in order to gain clues on the mechanisms responsible for the prompt -ray pulse as well as for the early and late multi-band afterglow of GRB 070311.
Methods. We fitted with empirical functions the gamma-ray and optical light curves and scaled the result to the late time X-rays.
Results. The -band light curve taken by REM shows two pulses peaking 80 and 140 s after the peak of the -ray burst and possibly accompanied by a faint -ray tail. Remarkably, the late optical and X-ray afterglow underwent a major rebrightening between and s after the burst with an X-ray fluence comparable with that of the prompt emission extrapolated in the same band. Notably, the time profile of the late rebrightening can be described as the combination of a time-rescaled version of the prompt -ray pulse and an underlying power law.
Conclusions. This result supports a common origin for both prompt and late X-ray/optical afterglow rebrightening of GRB 070311 within the external shock scenario. The main fireball would be responsible for the prompt emission, while a second shell would produce the rebrightening when impacting the leading blastwave in a refreshed shock.
Key Words.:
gamma rays: bursts; X-rays: individual (GRB 070311)1 Introduction
The bewildering variety of the long -ray prompt emission profiles of gamma-ray bursts (GRBs) has been puzzling astronomers since their discovery (e.g. see Fishman & Meegan 1995 for a review). Among the most important open issues, two are still nowadays debated: first, how long does the central engine remain active? Does the emission consist of a single episode or a temporal sequence of events with interspersed quiescent periods? Secondly, after the discovery of the delayed multi-band long-lasting emission called “afterglow”, made possible for the first time by BeppoSAX ten years ago (Costa et al., 1997), a general consensus on the emission mechanisms of both the prompt and the afterglow emission is still missing, even though for the latter synchrotron radiation by a population of shocked electrons proved to be successful in accounting for a number of spectral and temporal evolution properties (e.g., Mészáros 2006). Gaining clues on these issues may help to shed light on the nature of the progenitors as well as on the circumburst environment.
The advent of Swift (Gehrels et al., 2004) has been allowing the study of multi-band afterglows as early as s after the prompt event, exploring a previously unknown time domain. Both optical and X-ray light curves have shown unexpected behaviours that still lack a solid agreed theoretical explanation. Among the impressive discoveries by Swift concerning the long GRBs, here we mention the canonical behaviour of steep-shallow-normal decay characterising most of the early X-ray afterglows as well as the occurrence of X-ray flares in % of them (see Zhang 2007, for a review up to date).
A number of different interpretations of the shallow decay phase experienced by the X-ray afterglows of a sizable fraction of Swift bursts (Tagliaferri et al., 2005; O’Brien et al., 2006; Nousek et al., 2006; Zhang et al., 2006) have been proposed. They can be broadly classified according to which mechanism is invoked: internal (IS; e.g., Rees & Mészáros 1994; Kobayashi et al. 1997) or external shocks (ES; e.g., Rees & Mészáros 1992; Shaviv & Dar 1995; Fenimore et al. 1996; Dermer & Mitman 1999). For instance, within the IS model the shallow decay phase could be the result of low velocity contrast distribution wind of slow shells emitted soon after the fast ones (Granot & Kumar, 2006). According to alternative ES interpretations, it could be the result of delayed energy injection into the fireball, either in the form of freshly ejected material from late engine activity (“refreshed shock scenario”; Rees & Mészáros 1998), or by the collision of a wind of low velocity contrast shells catching up with the fireball (Zhang & Mészáros, 2001). More generally, the shallow decay could be the result of a “late prompt” emission, i.e. the same mechanism responsible for the -ray pulses of the prompt would be at work through later shells with decreasing bulk Lorentz factors (Ghisellini et al., 2007). Overall, a consensus is still missing, also because of the large variety of behaviours observed: in some cases, there is no spectral evolution across the break in the light curve marking the end of the shallow phase, compatible with the expectations from an external origin of the shocks, while for other GRBs the opposite is true (Liang et al., 2007).
Likewise, X-ray flares have been interpreted as the result of late internal dissipation rather than due to external shocks, one of the main arguments being their short timescales also at late times, (Burrows et al., 2005; Falcone et al., 2006; Romano et al., 2006; Chincarini et al., 2007; Lazzati & Perna, 2007), whereas an external shock origin would require increasing timescales (Fenimore et al., 1996), although see also Dermer (2007b).
Another debated topic concerns the presence of optical brightening contemporaneous with the prompt emission or occurring in the first 1–2 hours. A variety of mechanisms have been proposed to explain it, such as reverberation of the prompt emission radiation (GRB 050820A: Vestrand et al. 2006), reverse shock (GRB 990123: Akerlof et al. 1999), refreshed shocks and/or energy injection (e.g. GRB 021004: Fox et al. 2003; GRB 050820A: Cenko et al. 2006; GRB 060206: Wozniak et al. 2006; Monfardini et al. 2006), onset of the external shock (GRB 060206 and GRB 060210: Stanek et al. 2007; GRB 060418 and GRB 060607A: Molinari et al. 2007), and large angle emission (GRB 990123: Panaitescu & Kumar 2007). It is likely that the interplay of the many processes active after the GRB explosion may all affect the optical light curves, creating the rich variety of observed behaviours.
While GRBs with complex multi-peaked time profiles displaying no pulse width evolution with time seem to be explained more naturally through the mutual interaction of a wind of shells emitted at different times with different Lorentz factors (internal shock model), a single FRED (fast rise exponential decay; Fishman & Meegan 1995) profile can still match the expectations of a single shell sweeping up the ISM (Fenimore et al., 1996). In this scenario, the kinetic energy of a single ultrarelativistic shell is converted into internal energy of the ISM swept up; the shocked electrons radiate via synchrotron emission and inverse Compton scattering. In the simplest case of a thin shell ploughing into the ISM and emitting for a short time, the expected time profile of the -ray prompt emission is that of a single pulse with fast rise and slow decay. The cooling timescale of electrons is negligible with respect to the hydrodynamical timescale in most cases (Sari & Piran, 1997). As a consequence, the rise time is determined by the emission time given by the crossing time of the shell by the reverse shock, while the decay time is dominated by the angular spreading timescale.
In this paper we report on the -ray, X-ray and optical observations of GRB 070311, whose time profile is typical of a FRED. In particular, we focus on some properties shared by the -ray and optical prompt emission and the late optical and X-ray afterglow in the light of the refreshed shock scenario.
The paper is organised as follows: in Sect. 2 and Sect. 3 we describe the observations and the data reduction and analysis, respectively. Multiwavelength timing and spectral analysis of both the prompt and the afterglow emission is presented in Sect. 4. In Sect. 5 we discuss our results. Finally, in Sect. 6 we summarise our findings and conclusions.
Throughout the paper, times are given relative to the onset time of the GRB, which corresponds to 45 s prior to the INTEGRAL/IBAS trigger time, and the convention has been followed, where the energy index is related to the photon index .
All the quoted errors are given at 90% confidence level for one interesting parameter (=2.706), unless stated otherwise.
2 Observations
GRB 070311 triggered the INTEGRAL/IBAS in IBIS/ISGRI data on 2007 March 11 at 01:52:50 UT and it was localised at RA , Dec. , with an error radius of (Mereghetti et al., 2007). At the time of the burst Swift/BAT was pointing in almost the opposite direction and it would have been in the field of view two minutes later. The corresponding flux at the position of the burst in a 300-s image beginning 130 s after the INTEGRAL trigger is negligible.
The -ray prompt emission in the 20–200 keV energy band lasted about 50 s with a peak flux of 0.9 ph cm-2 s-1 (1 s integration time) and a fluence of erg cm-2 (Mereghetti et al., 2007; Sazonov et al., 2007).
The Rapid Eye Mount111http://www.rem.inaf.it/ (REM; Zerbi et al. 2001) telescope reacted promptly and began observing 55 s after the GRB trigger time (see Sect. 3.1) and discovered a bright fading IR counterpart within the INTEGRAL error circle at RA , Dec. (J2000; Covino et al. 2007), corresponding to Galactic coordinates of , . The afterglow was soon confirmed by PAIRITEL (Bloom, 2007).
The Swift narrow field instruments, XRT and UVOT, began observing at 7004 s after the trigger time. The XRT found an uncatalogued fading source at the position RA , Dec. (J2000), with an error radius of and from the optical counterpart (Guidorzi et al., 2007a). No optical source was detected in correspondence of the optical and X-ray afterglows by UVOT down to and () from 197-s exposures (Holland et al., 2007).
The 2.2–m telescope of Calar Alto (CAHA) equipped with the Calar Alto Faint Object Spectrograph (CAFOS) observed the afterglow in filter at 0.72 and 1.73 days after the burst.
Because of the low Galactic latitude, the Galactic reddening along the direction to the GRB is large: mag (Schlegel et al., 1998). The Galactic extinction in each filter has been estimated through the NASA/IPAC Extragalactic Database extinction calculator222http://nedwww.ipac.caltech.edu/forms/calculator.html. Specifically, the extinction in the other filters is derived through the parametrisation by Cardelli et al. (1989): , , , , , mag.
3 Data reduction and analysis
3.1 Gamma–ray data
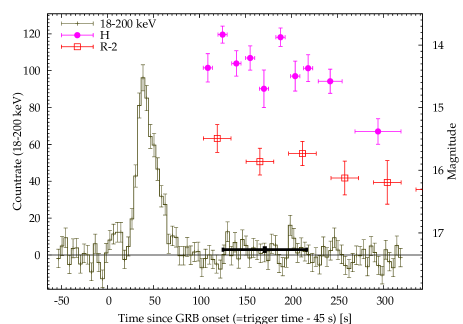
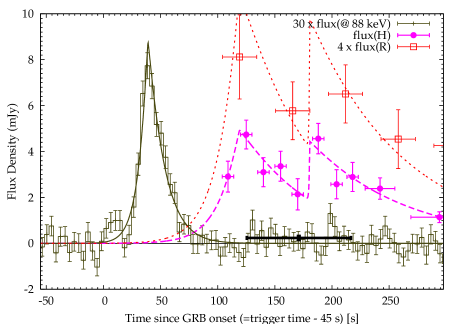
Figure 1 shows the 18–200 keV background-subtracted time profile of GRB 070311 as recorded by INTEGRAL (Sazonov et al., 2007). The onset of the GRB appears to occur about 45 s before the trigger time. Hereafter, time will be referred to the onset time, i.e. 45 s prior to the trigger time. From 75 to s the signal drops below the sensitivity of the instrument. Interestingly, between and s there is a hint of the presence of a faint gamma-ray tail. Although this feature is detected at - confidence level (see thick cross in Fig. 1) and so should be regarded as tentatively detected, it is interesting to see how it fits into the overall picture together with NIR, optical and X-ray observations of GRB 070311. We address this issue below.
The integrated spectrum in the 18–300 keV band is well fit by a power law with a photon index of and a fluence of erg cm-2 (20–200 keV). The spectrum shows no statistically significant high-energy cutoff. The peak energy lies above 80 keV during the prompt emission. There is also an indication of spectral softening in the course of the burst, with evolving from during the rise phase to during the peak and decay of the emission (Sazonov et al., 2007).
The conversion factor from rate to flux units in the 18–200 keV band is erg cm-2 count-1.
3.2 Infrared/optical data
Early time optical and near infrared (NIR) data were collected using the 60-cm robotic telescope REM located at the ESO La Silla observatory (Chile). The REM focal instruments consist of a NIR camera (REMIR), operating in the range 1.0–2.3 m (), and an optical imager (REM Optical Slitless Spectrograph, ROSS) with spectroscopic (slitless) and photometric capabilities (). A dichroic allows simultaneous observations at optical and NIR wavelengths in two selected filters (for further information on REM and its capabilities, see Covino et al. 2004 and references therein).
REM reacted promptly to the INTEGRAL GCN alert and began observing the field of GRB 070311 55 s after the burst trigger (36 s after the reception of the alert), following the event for 1 hour.
For the first 500 s the REMIR observations have been performed using only the filter with increasing exposure times, then all the NIR filters have been used in rotation. A similar observing strategy has been adopted in the optical. band observations lasted 1400 s for a total of 40 consecutive images. During the following 2700 s, images have been acquired in rotation but the optical transient was already below the instrument detection limits for the and filters.
For both optical and NIR data sets, the reduction and the analysis followed standard procedures. The photometric calibration for the NIR was accomplished by applying average magnitude shifts computed using the 2MASS333http://www.ipac.caltech.edu/2mass/ catalogue. The optical data were calibrated using instrumental zero points, checked with observations of standard stars in the SA95 Landolt field (Landolt, 1992), or with the SDSS444http://www.sdss.org in the case of the filter.
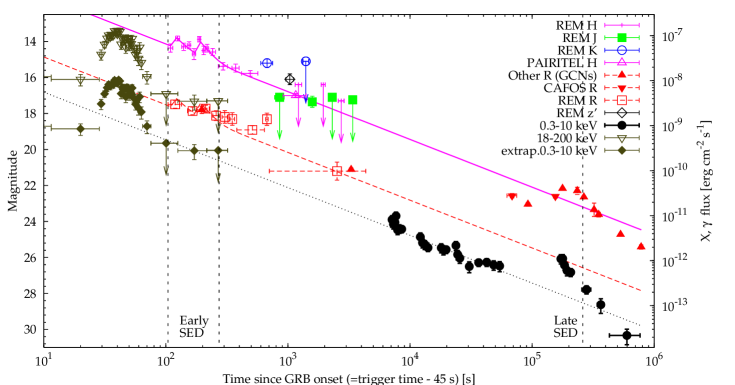
Figure 1 shows the REM prompt measurements (filled circles and empty squares, respectively) together with the -ray time profile, while Figure 2 shows the light curves (empty circles, crosses, filled squares, empty diamonds, empty squares, respectively).
Further observations were acquired with CAFOS. This instrument is a focal reducer which allows direct imaging, spectroscopy and polarimetry. The detector used is a SITe 20482048 pixel CCD providing a scale of pixel-1 and a circular field of view of in diameter. In order to reduce the CCD readout time the observations of GRB 070311 were carried out trimming the CCD to a 10241024 window. The photometric calibration was performed observing the standard field PG0942 (Landolt, 1992) at a similar airmass as the GRB field. Data reduction and analysis were carried out following standard recipes by using ESO-Eclipse (v5.0) tools (Devillard, 2001). Aperture photometry was obtained with the GAIA555http://star-www.dur.ac.uk/pdraper/gaia/gaia.html (v3.2.0) package. REM and CAFOS photometry is reported in Table 1.
Hereafter, the magnitudes shown are not corrected for Galactic extinction, whilst fluxes as well as all the best-fit models are. When the models are plotted together with magnitudes, the correction for Galactic extinction is removed from the models.
First we fitted the light curve, which is the best monitored at early times. We tried to fit the points up to s with a simple power law to test whether the fluctuations visible in Fig. 1 might be just statistical around a power-law decay. The resulting is 17.5/7 with a chance probability of 1.4% and the power-law index turned out to be (1 ). This probability gets even smaller if we combine the and points, as the latter trace the former although less significantly. We infer that the probability that the first 300 s NIR/optical profile is the result of statistical fluctuations around a simple power-law decay is lower than 1.4%.
This motivated us to fit the early data by means of a more detailed model. The point from PAIRITEL at s (Bloom, 2007) was included in the data set for this analysis. The fit shown in Fig. 2 (solid line) is the result of a power-law component with decay index of with two FRED-shaped pulses overimposed, peaking at 119 and 180 s, respectively. The dashed line shows the power law fitting the early part of the curve ( s) by fixing the index and letting only the normalisation free to vary. Here we note the less pronounced enhancement in the flux at the time of the pulses seen in . A more detailed discussion of it as well as of the fitting models is reported in Sect. 4.1.
For both the and magnitudes there is one single detection and the remaining are upper limits. The first upper limit at 810 s preceding the detection at 1537 s is however inconsistent with the assumption extrapolated at the time of the two measurements. Comparing all the optical-NIR filters, a flux increase characterised by some variability seems to appear even after the first two optical peaks, i.e. after s. This, combined with the detections in and , could be a hint of a third flare.
| Start Time | End Time | Exposure | Maga,b | Instr/Filter |
| (s) | (s) | (s) | ||
| 554 | 704 | 150 | REM/ | |
| 1281 | 1431 | 150 | 15.10 | REM/ |
| 59 | 69 | 10 | REM/ | |
| 75 | 85 | 10 | REM/ | |
| 90 | 100 | 10 | REM/ | |
| 105 | 115 | 10 | REM/ | |
| 120 | 130 | 10 | REM/ | |
| 138 | 148 | 10 | REM/ | |
| 154 | 164 | 10 | REM/ | |
| 168 | 178 | 10 | REM/ | |
| 184 | 210 | 26 | REM/ | |
| 224 | 274 | 50 | REM/ | |
| 303 | 353 | 50 | REM/ | |
| 372 | 522 | 150 | REM/ | |
| 1099 | 1249 | 150 | 16.4 | REM/ |
| 1826 | 1976 | 150 | 16.4 | REM/ |
| 2536 | 2836 | 300 | 17.3 | REM/ |
| 735 | 885 | 150 | 17.10 | REM/ |
| 1462 | 1612 | 150 | REM/ | |
| 2188 | 2338 | 150 | 17.10 | REM/ |
| 3198 | 3498 | 300 | 17.24 | REM/ |
| 917 | 1067 | 150 | REM/ | |
| 59.2 | 89.2 | 30 | REM/ | |
| 105.6 | 135.6 | 30 | REM/ | |
| 151.8 | 181.8 | 30 | REM/ | |
| 197.9 | 227.9 | 30 | REM/ | |
| 244.1 | 274.1 | 30 | REM/ | |
| 290.3 | 320.3 | 30 | REM/ | |
| 336.5 | 597.0 | 180 | REM/ | |
| 613.0 | 643.0 | 30 | REM/ | |
| 659.2 | 4295.6 | 1530 | REM/ | |
| 62174 | 74783 | 8400 | CAFOS/ | |
| 149180 | 160924 | 10810 | CAFOS/ |
-
a
Values are not corrected for Galactic extinction.
-
b
Errors at the 68% confidence level and upper limits (3 ) are given.
3.3 X–ray data
The XRT began observing GRB 070311 on 2007 March 11 at 03:49:34 UT, 7004 s after the INTEGRAL trigger and ended on 2007 March 19 at 22:38:54 UT, with a total net exposure of 81.8 ks in photon counting (PC) mode spread over 8.8 days. Table 2 reports the log of the XRT observations.
| Sequence | Obs Mode | Start Time (UT) | End Time (UT) | Exposure | Start Timea | End Timea |
|---|---|---|---|---|---|---|
| (s) | (s) | (s) | ||||
| 00020052001 | PC | 2007-03-11 03:49:34 | 2007-03-11 17:08:03 | 18780 | 7004 | 54913 |
| 00020052002 | PC | 2007-03-13 00:49:40 | 2007-03-13 13:46:56 | 9697 | 169010 | 215646 |
| 00020052003 | PC | 2007-03-14 00:49:36 | 2007-03-14 13:53:56 | 9465 | 255406 | 302466 |
| 00020052004 | PC | 2007-03-15 00:47:36 | 2007-03-15 14:01:54 | 9954 | 341686 | 389344 |
| 00020052005 | PC | 2007-03-16 01:06:34 | 2007-03-16 23:41:55 | 9028 | 429224 | 510545 |
| 00020052006 | PC | 2007-03-17 01:08:59 | 2007-03-17 22:21:55 | 14574 | 515769 | 592145 |
| 00020052007 | PC | 2007-03-17 23:45:20 | 2007-03-18 22:32:56 | 6283 | 597150 | 679206 |
| 00020052008 | PC | 2007-03-19 00:04:45 | 2007-03-19 22:38:54 | 3711 | 684715 | 765964 |
-
a
Since INTEGRAL trigger time.
The XRT data were processed using the FTOOLS software package (v. 6.1) distributed within HEASOFT. We ran the task xrtpipeline (v.0.10.4) applying calibration and standard filtering and screening criteria. Data were acquired only in PC mode due to the faintness of the source. Events with grades 0–12 were selected. The XRT analysis has been performed in the 0.3–10 keV energy band.
3.3.1 Temporal analysis
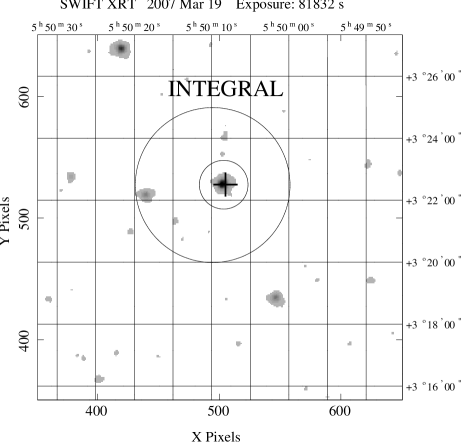
Source photons were extracted from a circular region with a 20–pixel radius (1 pixel; Fig. 3) and PSF-renormalised. The background was estimated from a four-circle region with a total area of pixel2 away from any source present in the field. When the count rate dropped below counts s-1, we made use of XIMAGE with the tool SOSTA, which corrects for vignetting, exposure variations and PSF losses within an optimised box, using the same background region.
The resulting 0.3–10 keV light curve is shown in Fig. 4. It was binned so as to achieve a minimum signal to noise ratio (SNR) of 3, except for the two last bins (with a SNR of 2.8 and 2.6, respectively) as well as a minimum of 20 total counts.

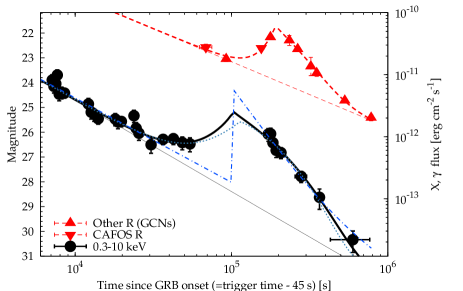
The light curve has been fit firstly with a double broken power law (solid line in Fig. 4), whose best fit parameters are the following: , , , ks, s (), where () are the canonical initial, mid, and final decay slopes and () are the two break times, respectively. The last point lies on the extrapolation of the initial power-law decay (dashed line in Fig. 4). From the X-ray data alone it is not possible to determine whether the shallow and final steep decay phases are the result of a late rebrightening after which the decay will resume to the pre-break behaviour.
We also adopted two alternative models: the combination of a FRED-shaped pulse with a power law (dash-dotted line in Fig. 4; a more detailed description follows in Sect. 4.1.2), and the model by Willingale et al. (2007). This model is the combination of two components, the prompt and the afterglow (according to the terminology introduced by these authors), described with the same functional form, which consists of a combination of an exponential and a power law. Following the notation by Willingale et al. (2007), we fixed the rise time of the prompt component to the onset time: . We also fixed the time when the power-law component of the prompt takes over, s, i.e. prior to the beginning of the X-ray observations, when the X-ray decay is already dominated by the power law. The best-fit model is shown in Fig. 5.

The best-fit parameters are the following: , s, s, (). We point out that within this model the late rebrightening corresponds to the onset of the afterglow component: this forced us to decouple from and treat the former as a free parameter, unlike what Willingale et al. (2007) did for all of the GRBs of their sample. We last note that the two-component model by Willingale et al. (2007) usually accounts for both the prompt and the afterglow emission. In our fit, we have only considered the late-time light curve. The X-ray rebrightening observed in GRB 070311 would therefore constitute a third component, which is only rarely seen in afterglow light curves.
3.3.2 Spectral analysis
In order to detect possible spectral variations connected with changes in the X-ray light curve, we extracted the 0.3–10 keV spectrum in four different time intervals, labelled “A”, “B”, “C” and “D”, corresponding to the initial steep decay, the beginning of the shallow phase, the end of it (or the peak of the rebrightening, according to the alternative description of the X-ray light curve discussed in Sect. 3.3.1), and the final steep decay, respectively (see Fig. 4).
Source and background spectra were extracted from the same regions as the ones used for the light curve (Sect. 3.3.1), except for intervals “B” and “C” separately. For these intervals, due to their poor statistics, it was not possible to group the energy channels so as to have a Gaussian distribution of the number of photons per grouped channel. Hence, for both spectra we replaced the with the statistics (Cash, 1979), which has proven to be useful whenever the Gaussian approximation does not hold (e.g. when the number of photons per bin is less than 10), provided that the contamination of background photons is negligible. In order to ensure this, for both spectra “B” and “C”, a 10–pixel radius circular region was used.
The ancillary response files were generated using the task xrtmkarf. Spectral channels were grouped so as to have at least 20 counts per bin, except for “B” and “C”. Spectral fitting was performed with xspec (v. 11.3.2).
| Interval | Start time | Stop time | Mean flux | /dof | ||
|---|---|---|---|---|---|---|
| (s) | (s) | ( cm-2) | ( erg cm-2 s-1) | |||
| A | 7004 | 26079 | 11.0/16 | |||
| B | 29217 | 54833 | 351.5 (63.4%)a | |||
| C | 160010 | 215648 | 320.4 (58.2%)a | |||
| BC | 29217 | 215648 | 12.4/9 | |||
| BCD | 29217 | 765966 | 10.3/13 | |||
| CD | 160010 | 765966 | 6.2/7 |
All the spectra can be modelled with an absorbed power law with the xspec models wabs pow. We assumed the photoelectric cross section by Morrison & McCammon (1983). Results of the best-fit parameters are reported in Table 3.
The Galactic neutral Hydrogen column density along the GRB direction from 21-cm-line radio surveys is cm-2 (Kalberla et al., 2005). The X-ray absorption found from spectral fitting is significantly higher than : specifically, it is about twice as high. We do not interpret this as evidence for intrinsic absorption: for low Galactic latitudes () the measured from X rays is about twice as high as that derived from the radio, interpreted as due to the presence of molecular gas (Arabadjis & Bregman, 1999; Baumgartner & Mushotzky, 2006). Therefore we conclude that the we measure from the X-ray spectrum is consistent with the Galactic value expected in the direction of GRB 070311, albeit we cannot exclude some intrinsic absorption.
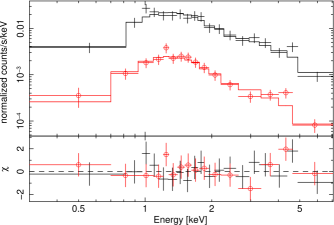
Comparing the best-fit parameters obtained for the different spectra, while the absorption seems constant, we find the suggestion () for a softening of the photon index , from (interval A) to (intervals B, C, D merged together). The corresponding spectra with the best-fit models are shown in Fig. 6.
We note that the change of the spectral index, , is consistent with the canonical value of expected in the standard synchrotron model when the cooling frequency crosses the observed passband (X rays, in this case). In this case, this passage would have occurred approximately between intervals A and BCD (Fig. 4).
The excess visible between 4 and 5 keV in the residuals of the spectrum with respect to the absorbed power law appears to be - significant after properly rebinning and in the most favourable case (Fig. 6).
4 Multi-band combined analysis
4.1 Light curves fitting
We analysed the different decays in different energy bands as homogeneously as possible. Motivated by the possible interpretation of the FRED in the external shock context, and by the shape of the -filter pulses similar to that of the prompt emission in the 18–200 keV band, which looks like a typical FRED, we first fitted the 18–200 keV pulse adopting the profile used by Norris et al. (1996):
| (3) |
where is the peak time, and are the rise and decay times, respectively, is the normalisation and is the peakedness (when the profile is a simple exponential, when it is a Gaussian). The best-fit parameters for the -ray pulse are: s, s, s. The peakedness was found to be starting with an initial value of . The result is shown by the solid line in Fig. 7.
We calculated the flux density at 88 keV, which corresponds to the energy at which the flux density equals the average flux density in the 18–200 keV band assuming .
To fit the curves, we adopted two alternative approaches. First we focused on the early pulses and fitted them in terms of two overlapping FRED-shaped pulses (pulses model). We chose to model the shape of the pulses with a FRED, first because this fits well, and, secondly, because it allows a better comparison with the results of the fit of the -ray pulse. Alternatively, we added a power-law continuum, in the assumption that the afterglow contribution is not negligible at this time (pl+pulses model). Both and profiles have been corrected for Galactic extinction. Given the less dense sampling of the and curve with respect to the -ray one, the peakedness was fixed to the best-fit value reported above.
Finally we fitted the late rebrightening seen in and X-ray with a single pulse superposed to a power law (pl+pulse model). Best-fit parameters of the models are reported in Table 4.
4.1.1 pulses model
The first pulse peaks 80 s after the -ray peak. The pulse shape is different: the rise time of the pulse is about twice as long, while its decay time is about 4 times longer. The flux density normalisation constant, mJy, is about 17 times that of the rays at 88 keV. The second pulse follows the first by s. Because of the poor sampling of the rise, only the decay is better constrained and turns out to be about twice as long as the decay time of the first pulse, while the normalisation of the second pulse is about half as big: , so that the fluence during the decay is similar to that of the first pulse. The dashed line in Fig. 7 shows the sum of both pulses fitting the points (filled circles).
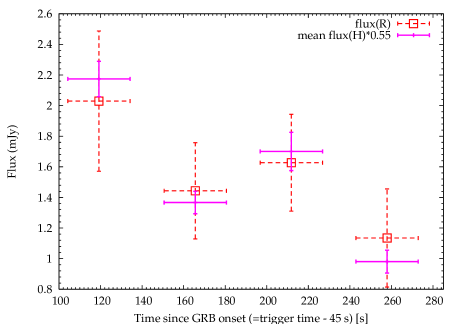
To evaluate whether the points simultaneous to the prominent pulses seen in are consistent with being derived from the same profile as within uncertainties, we integrated the best-fit model of the curve over the time bins. We determined the rescaling factor that minimises the between the measured and the expected rescaled mean flux. The result is shown in Fig. 8 and corresponds to , yielding . We conclude that the time profile best-fitting the pulses is consistent with the simultaneous measurements.
points are displayed in Fig. 7 with empty squares and the best-fit model is represented with the dotted line, all magnified by a factor of 4 for the sake of clarity.
4.1.2 pl+pulses model
Alternatively to the description of Sect. 4.1.1, here we assume that the contribution of the power-law continuum is not negligible since the very beginning of the NIR/optical observations. The result is shown in Fig. 2. For the same reasons as in Sect. 4.1.1 we first fitted the profile. The power-law continuum turned out to have a slope of (solid line in Fig. 2). Then we added the same combination of pulses as that found in Sect. 4.1.1, by allowing the single normalisations and releasing gradually some of the parameters. Table 4 reports the best-fit values. Similarly to Sect. 4.1.1, the fit for the filter was done by allowing just a scaling factor of the profile. This turned out to be , i.e. the same as that obtained with the previous model (Sect. 4.1.1). The best-fit profile is shown in Fig. 2 with a dashed line. The of the best-fit model are acceptable: 6.0/7 and 12.1/8 for the and profiles, respectively.
The main differences from the results obtained in Sect. 4.1.1 concern the shorter rise times in this case, that were fixed to 0.1 s. This is a consequence of having increased the continuum component here represented by the power law. The pulse shape is less constrained, for the same reason. The second pulse still has a longer decay than the first, while its peak intensity is now comparable with that of the first.
The dotted line in Fig. 2 shows the best-fit power law of the X-ray data up to s obtained by fixing . The fit is acceptable: (chance probability of 28%). This description of the X-ray light curve is alternative to that given in Sect. 3.3.1.
We tentatively extrapolated the -ray flux to the 0.3–10 keV band, assuming the simple power law with (Sect. 3.1). This assumption relies upon the fact that the peak energy is likely to lie above 80 keV because of the hardness of the photon index . We also applied the suppression factor due to the soft X-ray absorption measured in the X-ray spectrum. The result is shown with filled diamonds in Fig. 2. Interestingly the single power law derived from fitting the early and continuum components, , matches the level of the extrapolated prompt emission flux in the X-ray band.
4.1.3 Late /X-ray rebrightening
From Fig. 2 we note that the power-law continuum, over which the late ( s) rebrightening sets in, looks brighter than expected from extrapolating the early best-fit model by 1 order of magnitude. For this reason we fitted it separately from the early light curve. We adopted a combination of a power-law and a single pulse (Eq. 3). The power-law index was fixed to the value found in Sect. 4.1.2 for the early part of the , i.e. . The result is shown in Fig. 9 (thick dashed line).
We did the same for the contemporaneous 0.3–10 keV profile (thick solid line in Fig. 9). We initially fixed in analogy with Sect. 4.1.2, but we had to release it because of the badness of the fit and it turned out to be , more consistent with the broken-power-law fit given in Sect. 3.3.1. The X-ray coverage of the late rebrightening is not as detailed in catching the peak time as for the filter, nonetheless from Fig. 9 we can confidently affirm that X-rays peak earlier than optical, which is rising or flattening during the beginning of the monitored X-ray decay. Best-fit parameters are reported at the bottom of Table 4.
The dashed-dotted line in Fig. 9 represents the case when the X-ray late rebrightening is fit with the sum of two power laws, the second of which turns on between and s and models the rebrightening superposed to the first power law. The best-fit indices are and , respectively (1 confidence). For both components the time origin was fixed to the GRB onset time. The time at which the second power law sets in cannot be estimated from our data; however, this is irrelevant for determining the power-law indices.
Compared to the band, the poorer coverage of the X-ray peak reflects upon bigger uncertainties on the best-fit parameters of the X-ray profile. Interestingly, rise and decay times are similar and the ratios are 2.3 and 2.6 for the filter and X-ray, respectively, i.e. the pulses resemble the typical shape of a prompt -ray pulse (Norris et al., 1996). The peak intensities are and times the value of the correspondent underlying power-law at peak time for the filter and X-ray band, respectively. The X-ray/ time lag amounts to s. More simply, the late rebrightening peaks twice as late as the X-ray profile. A word of caution is needed about the evaluation of this temporal lag: the uncertainty could be larger than our estimate, which is constrained by the choice of the functional form used for fitting. Nevertheless, the evidence for a positive lag is apparent, regardless of the fits.
4.1.4 Prompt pulse/late X-ray rebrightening
Notably, the ratios between the temporal parameters best fitting the pulse of the -ray prompt profile (Sect. 4.1.1) and their correspondent ones fitting the late X-ray rebrightening (Sect. 4.1.3) are all comparable: , , . We tried to fit the late X-ray rebrightening with the combination of the same power law as that obtained in Sect. 4.1.3 and a rescaled version of the -ray prompt pulse: , , . We left three parameters free to vary: the scaling factor , the time origin and the normalisation of the pulse. The choice of letting the time origin vary was motivated by the peak time of the -ray pulse being very sensitive due to its smallness. The result is shown in Fig. 9 (dotted line). The best-fit parameters are the following: and s (). The potentially strong implications on the interpretation of this result are addressed in Sect. 5.
| Energy | Model | Component | ||||||
| band/filter | (s) | (s) | (s) | (mJy) | ||||
| 18–200 keV | pulses | pulse | – | |||||
| pulses | 1st pulse | – | ||||||
| pulses | 2nd pulse | – | ||||||
| pulses | 1st pulse | – | ||||||
| pulses | 2nd pulse | – | ||||||
| pl+pulses | pl | – | – | – | – | |||
| pl+pulses | 1st pulse | – | ||||||
| pl+pulses | 2nd pulse | – | ||||||
| pl+pulses | pl | – | – | – | – | |||
| pl+pulses | 1st pulse | – | ||||||
| pl+pulses | 2nd pulse | – | ||||||
| late | pl+pulse | pl | – | – | – | – | ||
| late | pl+pulse | pulse | – | |||||
| 0.3–10 keV | pl+pulse | pl | – | – | – | – | ||
| 0.3–10 keV | pl+pulse | pulse | – |
-
a
Time since GRB onset (corresponding to 45 s before the trigger time).
-
b
Flux density corresponding at 88 keV.
-
c
Flux at s.
-
d
Flux at s.
-
e
Units of Jy.
-
f
Units of s.
-
g
Units of erg cm-2 s-1.
4.2 SED evolution
We derived two SEDs at different epochs. The early one comprises the NIR pulses seen at the beginning of the REM follow-up observations and lasts from 104 to 273 s. This SED consists of detections in two filters, and , and a 3- upper limit of Jy in the 18–200 keV band (see Fig. 2). Given the high variability of the curve, especially when compared with that of , the mean flux was derived by integrating the best-fit profile of the curve described in Sect. 4.1.1 over this time interval. The simultaneous mean flux was calculated assuming the best-fit rescaling factor () between and derived in Sect. 4.1 for the same time interval. The fit with a simple power law yields . The extrapolation of the fit to the -ray band is consistent with the upper limit (Fig. 10).
Interestingly, the spectral index is consistent with that at the end of the -ray pulse (Sect. 3.1), , and might be suggestive of an unbroken power law segment from NIR to at this epoch. However, the large value of makes the uncertainty on the Galactic extinction quite large, mag. Should the Galactic extinction in be larger (smaller) by 0.5, the corrected spectral index of the NIR/optical data alone would be (). Thus, nothing conclusive can be said about the possible presence of extinction in excess of the Galactic one.
The late SED (Fig. 11) was extracted at s, corresponding to the beginning of the decay following the late rebrightening in simultaneously with the final steep X-ray decay (see Fig. 2). This SED includes a single measurement taken by Halpern & Armstrong (2007d) and the XRT spectrum BCD (Sect. 3.3.2; Table 3) renormalised through the best-fit power-law segment of the X-ray light curve (Sect. 3.3.1) at the epoch of the point. The SED was fit with an SMC-extinguished (Pei 1992; in the observer frame), X-ray photoelectrically absorbed broken power law with . The was fixed to the value already derived from the corresponding X-ray spectrum, i.e. cm-2, consistent with being entirely Galactic (Sect. 3.3.2). We found , consistent with from the X-ray spectrum best fit (Table 3). The break frequency turned out to be Hz and mag (). Figure 11 shows the SED: the dashed (dotted) line represents the best-fit model with optical extinction and X-ray absorption taken out (shown).


Alternatively, we tried to fit the SED with a single absorbed power law. If we left the slope free to vary, the fit is driven by the more numerous X-ray points, leading to and mag. However, if we correct the early SED for such an extinction, the intrinsic optical spectrum would be nonphysically blue (). Otherwise if we impose a single power law between optical and X-ray and fix , becomes comparable with that found in the case of a broken power law. However, although the fit cannot be rejected (), the residuals of the X-ray points with respect to the model show a trend. Therefore, a simple absorbed power law does not seem to be a good representation of our data.
Because of the unknown redshift of GRB 070311, we caution that the values of computed in the fits above are calculated for assuming a specific extinction law (SMC model), so they must be taken as indicative upper limits to the corresponding rest-frame values. Unlike for the early SED, the X-ray absorption in terms of is known to be consistent with the expected Galactic value. Due to the unknown redshift, it is not possible to set an upper limit to the possible intrinsic rest-frame absorption. For this reason and because of the upper limits on , nothing can be inferred on the amount of dust and gas along the line of sight to the GRB progenitor.
5 Discussion
Together with the early optical/NIR flares possibly accompanied by a -ray tail, the late, bright and long rebrightening seen in X-ray and band probably is the most intriguing feature of GRB 070311. Although such late brightenings or flares are not unprecedented, only a few bursts have exhibited them so far: e.g., GRB 970508 (Piro et al., 1998; Galama et al., 1998), the short GRB 050724 (Campana et al., 2006; Malesani et al., 2007), the GRB 050904 (Cusumano et al., 2007; Watson et al., 2006). We also note the presence of the shallow decay phase preceding the X-ray brightening (or corresponding to its gradual onset). Due to the lack of contemporaneous coverage in the band, we did not observe a similar shallow decay phase in the optical bands. However, from Fig. 2 we infer that it must have taken place (e.g., some energy injection between s and s) to power the continuum component of the -filter decay at late times, which is significantly above the extrapolation of the early data.
In the case of GRB 070311, we note that for the late rebrightening in both X-ray and filter, so timescales arguments cannot be used against an external shock origin for it. We note that this is in contrast to what has been observed for other GRBs (e.g. GRB 050502B; Burrows et al. 2005, Falcone et al. 2006; GRB 050724; Barthelmy et al. 2005, Campana et al. 2006), in which the rise and decay of the flares are too steep and require a resetting of the time origin.
In addition, the FRED-like shape of the 18–200 keV prompt light curve and consequent lack of high variability, classically used to argue against an external origin of the prompt emission of complex bursts (Sari & Piran 1997; but see also Dermer & Mitman 1999), indicates that the prompt emission of GRB 070311 is potentially consistent with it (e.g., see Kumar & Panaitescu 2003), although unlikely due to synchrotron radiation (Ramirez-Ruiz & Granot, 2006).
Motivated by this and by the analogies found between prompt and late afterglow, hereafter we try to interpret the observations of GRB 070311 in the light of an external shock origin. While the -ray pulse is thought to be produced during the deceleration of the shell against the surrounding medium, we consider two alternative explanations for the late rebrightening: either a refreshed shock by a second shell emitted after the first one, or a single shell whose forward shock encounters a density bump.
The description of the and X-ray late rebrightening as a simple power law with a slope changing after the peak (Sect. 4.1.3), is consistent with the interpretation that the late rebrightening is due to a thin shell that caught up with the shock front of the blastwave at later times, as expected in the so-called refreshed-shock scenario (Rees & Mészáros, 1998). In this picture, the fireball rebrightened and soon afterwards ( s) turned off: the decay is the result of two components: the pre-existing power law and the high-latitude radiation left over by the refreshed shock. This is the case when the energy of the impacting shell is lower than that of the fireball (as also suggested by the ratio between the radiated energy during the late flare and the prompt emission), so that no noticeable step in the power-law decay is observed, but still luminous enough to produce a peak on a short timescale.
According to the so-called “curvature” effect (Fenimore et al., 1996; Kumar & Panaitescu, 2000; Dermer, 2004), the steepness of the fast decay phase of several X-ray afterglows as well as of the -ray tail of single pulses is due to high-latitude radiation Doppler-boosted in the observer fixed energy band. A relation is expected between temporal and spectral index: in its simplest form in the case of a thin shell emitting for a short time, where the time origin must correspond to the time of the GRB explosion as measured in the detector frame.
Notably, for GRB 070311 both the decay of the -ray pulse and the longer decays in X-rays and -filter of the late rebrightening are consistent with the high-latitude closure relation and with the same time origin, i.e. the GRB onset time: and . This is proven by the measured slope of the second power law, , which describes the flare decay, in addition to the underlying power law with (Sect. 4.1.3). Therefore, if we adopt the combination of a power law and either a pulse or another power law for the late rebrightening (Sect. 4.1.3), the slope of the pulse decay is still consistent with a curvature effect: In addition, from Sect. 4.1.4 we know that if we move the reference time backward to s before the GRB onset, the late brightening is well fit by a time-rescaled version of the prompt -ray pulse. What is remarkable is that the peak time scales exactly in the same way as the pulse rise and decay times: . This suggests that either two shells generated the prompt pulse as well as the late rebrightening or, alternatively, that a unique shell caused both by encountering two density enhancements. We note that the late X-ray hump occurs later (few s) than what is more commonly seen in the typical flat phase ( s), also usually interpreted in terms of energy injection from the central engine. The detection in the filter rules out a very high redshift, so such a late refreshing may be either due to a more distant radius of emission of the forward shock (e.g. due to low density of the surrounding medium) or due to a slow shell catching up with the shock front.
The 18–200 keV fluence emitted in the prompt amounts to erg cm-2 by integrating the best-fit model of Sect. 4.1.1, while the net 0.3–10 keV fluence of the late rebrightening is erg cm-2, i.e. lower by one order of magnitude. If we extrapolate the prompt spectrum to the XRT band as in Sect. 4.1.2 and correct for the X-ray absorption, the fluence of the late X-ray rebrightening becomes comparable with that of the prompt extrapolated to the same energy band. Differently, the late hump has a time-integrated flux about one order of magnitude larger than the early pulses seen in the same filter. The larger energy content of the late shock, with respect to the early one seen in optical, might be explained with an increasing efficiency in converting the kinetic energy of the blastwave into radiation. This implies a change of the microphysical parameters of the afterglow, as suggested to explain the shallow decay phase of other GRBs (Ioka et al., 2006; Panaitescu, 2006). This can also be explained more simply as due to the fact that the broadband spectrum peaks at lower energies at later times, so that the energy release in the observed filter during the late rebrightening is larger than during the prompt or soon after that.
Following Ioka et al. (2005), we can find which scenarios may be compatible with the observed flux increase, (both in and X; Sect. 4.1.3), and the observed : from their fig. 1, the late hump of GRB 070311 is compatible with the refreshed shock scenario. Also the patchy shell model (Mészáros et al., 1998), characterised by an anisotropic emitting surface of the fireball, is not ruled out, while the scenario of a density bump causing the late rebrightening is ruled out, unless many clumps of matter are illuminated at the same time. Therefore, the bright flux of the rebrightening, , seems to disfavour the interpretation of a density medium enhancement, causing the observed flux increase. However we note that this is debated: e.g., according to Dermer & Mitman (1999) and Dermer (2007a), this could be produced by parts of the blastwave in which most of the energy has not been converted into radiation, yet, while impacting on a dense and thick clump of matter. In this scenario, the same shell would be responsible for both the prompt and the late rebrightening: e.g., the high-latitude emission observed during the decay of the late hump might be the result of the blastwave finally reaching the wind-termination shock. However, the interpretation of the late rebrightening as due to a density bump seems disfavoured by the crossing of the X-ray band by the cooling break , whereas the observed frequency must be below . In addition to that, the remarkable flux enhancement observed, (Sect. 4.1.3), makes this interpretation less probable. In both scenarios (refreshed shock produced by another shell or density bump), the scaling factor of the timescale of the late brightening with respect to the early pulse, , could result from the interplay of two factors: the increase of the visible portion of the emitting surface and the fact that the blastwave Lorentz factor has decreased by a factor of head on, thus stretching the timescale by . Therefore, since , from , it must be .
The early NIR/optical pulses detected soon after the -ray pulse are consistent with both interpretations: they could be the result of density bumps swept up by the blastwave (), or other shells emitted soon after the first one and catching up with the shock front 80 and 140 s after its deceleration (Sect. 5.1).
During the late rebrightening, we know that the spectrum is likely described by a broken power law with and . If we interpret it as the cooling break in the slow cooling regime, the electron power-law distribution index is . The fact that was around 1.0 at the beginning of the XRT observations can be explained if the cooling frequency crossed the X-ray band during the observations. The change in the X-ray decay that would be implied amounts to 1/4 and could be still compatible with the pre-break slope, ranging from 1.0 to 1.4, depending on which model one assumes (Sects. 3.3.1, 4.1.2, 4.1.3). The optical decay is compatible with that expected in the case of an ISM environment: . Differently, the case of a wind environment is ruled out (3 ): .
Alternatively, if during the late rebrightening the bulk Lorentz factor has already decreased to , where is the jet opening angle, the afterglow should already have experienced an achromatic jet break: in this case, both optical and X-ray decay indices are simply equal to . Notably, this is compatible with the measured values during the decay of the late rebrightening and this led Panaitescu (2007) to favour the jet interpretation for this burst. However, we believe that the late rebrightening is more likely to be due to an energisation of the blastwave shock front that strongly affected the measured power-law slope, similarly to what was inferred in the case of GRB 050724 (Malesani et al., 2007).
The interpretation of the final steep decay following the flare as the post jet-break decay seems unlikely: while the late X-ray flare might be still interpreted as a shallow-steep transition (Sect. 3.3.1), in the optical the identification as a flare cannot be questioned. Therefore, the steep decay after the peak simply corresponds to the declining part of the flare and not to a jet break.
5.1 Deceleration radius of the fireball
The result of Sect. 4.1.4 suggests that the time origin, moved to s before the GRB onset, would correspond to the explosion time in the detector frame (hereafter DF), i.e. when the shell radii are negligible. Let s be the explosion time measured in the DF. In this context we can derive some clues on the fireball evolution produced during the first shock corresponding to the -ray pulse. In this picture the shell would expand from to , when it would start emitting rays. The deceleration time would correspond to the peak time of the -ray pulse, i.e. s. First the shell accelerates until it reaches the coasting radius (typically cm), while the bulk Lorentz factor increases linearly with radius until it reaches the maximum value of . At this stage, the internal energy of the fireball has been converted into bulk kinetic energy. After that, the shell expands with constant until it is decelerated by the surrounding medium. If the time it takes the shell to reach the coasting phase is negligible with respect to the time it takes to begin to decelerate, it follows that during most of the time from to the shell was moving with . In this case the shell would start decelerating at the radius cm. The deceleration process would culminate at the deceleration radius at the deceleration time (DF) s in the thin shell case ploughing into uniform ISM (Rees & Mészáros, 1992). We note that from the beginning to the peak of the deceleration, i.e. from to , the bulk Lorentz factor decreases approximately from to . From this we can infer the distance travelled by the fireball in the same time interval: this must be between and , i.e. between cm and cm. This is comparable with the distance already travelled at the beginning of the deceleration and consistent with the numbers reported above. The unknown redshift unfortunately makes it too tentative to push these estimates any further.
6 Conclusions
GRB 070311 is a FRED-shaped burst followed by early NIR/optical pulses detected from to s and possibly accompanied by a simultaneous faint -ray tail, with subsequent variability detected at different NIR/optical filters up to s since the GRB onset. Another remarkable property exhibited by GRB 070311 is the late and X-ray rebrightening observed around few s after the burst, with the X-ray peaking earlier than -filter photons. When we fit it with the combination of an underlying power law plus a pulse, the X-ray () fluence of the pulse alone is comparable (10 times larger) with that of the early pulse, while the peak intensity is about one order of magnitude larger than that of the underlying power law. Interestingly, if we refer the times to s prior to the GRB onset, it turns out that the peak time as well as the rise and decay times of the late pulse are compatible with the corresponding times of the -ray pulse, rescaled by the same factor: . We interpreted this in the external shock scenario, where the -ray prompt emission would correspond to the deceleration of the blastwave sweeping up the surrounding medium with uniform density, while the late and X-ray rebrightening would be produced by the refreshed shock of another shell emitted after the first and impacting the blastwave when this has a Lorentz factor , so that: . In this context, the time offset of s before the GRB would correspond to the explosion time in the detector rest frame, while the GRB onset would mark the beginning of the -ray emission due to the deceleration of the fireball. From the explosion, onset and peak times we infer consistent estimates of the deceleration radius, a few cm.
The interpretation of the late rebrightening as the result of a density bump in the surrounding medium would explain naturally both the prompt and the late hump with a single shell. However, the possible presence of the cooling break close to the X-ray band around the peak time, combined with the remarkable flux enhancement observed, , makes this scenario less appealing.
The occurrence of the early NIR/optical flares at 80 and 140 s after the peak of the -ray emission is consistent with both scenarios: either due to density enhancements of the matter encountered by the blastwave or explained by further shells catching up with it.
Finally, we note that the early (late) NIR/optical pulses do not peak contemporaneously with the corresponding -ray (X-ray) pulses, but are delayed by a factor of () in time. A clear interpretation of this effect is lacking.
Acknowledgements.
This work is supported by ASI grant I/R/039/04 and by the Ministry of University and Research of Italy (PRIN 2005025417). S.D.V. is supported by SFI grant 05/RFP/PHY0041. D.M. acknowledges the Instrument Centre for Danish Astrophysics for financial support. The Dark Cosmology Centre is funded by the DNRF. We gratefully acknowledge the contribution of dozens of members of the XRT team at OAB, PSU, UL, GSFC, ASDC and our sub-contractors, who helped make this instrument possible. INTEGRAL is an ESA project funded by ESA member states (especially the PI countries: Denmark, France, Germany, Italy, Switzerland), Czech Republic and Poland, and with the participation of Russia and the USA. This study is supported by Spanish research programmes ESP2002-04124-C03-01 and AYA2004-01515. Partially based on observations collected at the German-Spanish Astronomical Center, Calar Alto, jointly operated by the Max-Planck-Institut für Astronomie Heidelberg and the Instituto de Astrofísica de Andalucía (CSIC).References
- Akerlof et al. (1999) Akerlof, C., Balsano, R., Barthelmy, S. et al. 1999, Nature, 398, 400
- Arabadjis & Bregman (1999) Arabadjis, J.S., & Bregman, J.N. 1999, ApJ, 510, 806
- Barthelmy et al. (2005) Barthelmy, S.D, Chincarini, G., Burrows, D.N. et al. 2005, Nature, 438, 994
- Baumgartner & Mushotzky (2006) Baumgartner, W.H., & Mushotzky, R.F. 2006, ApJ, 639, 929
- Bloom (2007) Bloom, J.S. 2007, GCN Circ. 6191
- Burrows et al. (2005) Burrows, D.N., Romano, P., Falcone, A., et al. 2005, Science, 309, 1833
- Campana et al. (2006) Campana, S., Tagliaferri, G., Lazzati, D., et al. 2006, A&A, 454, 113
- Cardelli et al. (1989) Cardelli, J. A., Clayton, G. C., & Mathis, J. S. 1989, ApJ, 345, 245
- Cash (1979) Cash, W. 1979, ApJ, 228, 939
- Cenko et al. (2006) Cenko, S.B., Kasliwal, M., Harrison, F.A., et al. 2006, ApJ, 652, 490
- Cenko (2007) Cenko, S.B. 2007, GCN Circ. 6196
- Chincarini et al. (2007) Chincarini, G., Moretti, A., Romano, P. et al. 2007, ApJ, in press (astro-ph/0702371)
- Costa et al. (1997) Costa, E., Frontera, F., Heise, J., et al. 1997, Nature, 387, 783
- Covino et al. (2004) Covino, S., Stefanon, M., Sciuto, G. et al. 2004, Proc. SPIE, 5492, 1613
- Covino et al. (2007) Covino, S., Antonelli, L.A., Calzoletti, L., et al. 2007, GCN Circ. 6190
- Cusumano et al. (2007) Cusumano, G., Mangano, V., Chincarini, G., et al. 2007, A&A, 462, 73
- Dai et al. (2007) Dai, X., Garnavich, P., Pogge, R. et al. 2007, GCN Circ. 6219
- Dermer (2004) Dermer, C.D. 2004, ApJ, 614, 284
- Dermer (2007a) Dermer, C.D. 2007a, ApJ, 664, 384
- Dermer (2007b) Dermer, C.D. 2007b, ApJ, submitted (astro-ph/0703223)
- Dermer & Mitman (1999) Dermer, C.D. & Mitman, K.E. 1999, ApJ, 513, L5
- Devillard (2001) Devillard, N. 2001, ASP Conf. Ser., 238, 525
- Falcone et al. (2006) Falcone, A.D., Burrows, D.N., Lazzati, D., et al. 2006, ApJ, 641, 1010
- Fenimore et al. (1996) Fenimore, E.E., Madras, C.D., & Nayakshin, S. 1996, ApJ, 473, 998
- Fishman & Meegan (1995) Fishman, G.J., & Meegan, C.A. 1995, ARA&A, 33, 415
- Fox et al. (2003) Fox, D.W., Yost, S.A., Kulkarni, S.R., et al. 2003, Nature, 422, 284
- Fukugita et al. (1995) Fukugita, M., Shimasaku, K., & Ichikawa, T. 1995, PASP, 107, 945
- Galama et al. (1998) Galama, T.J, Groot, P.J., van Paradijs, J., et al. 1998, ApJ, 497, L13
- Garnavich et al. (2007) Garnavich, P., Dai, X., Pogge, R., et al. 2007, GCN Circ. 6245
- Gehrels et al. (2004) Gehrels, N., Chincarini, G., Giommi, P. et al. 2004, ApJ, 611, 1005
- Ghisellini et al. (2007) Ghisellini, G., Ghirlanda, G., Nava, L., & Firmani, C. 2007, ApJ, 658, L75
- Granot & Kumar (2006) Granot, J., & Kumar, P. 2006, MNRAS, 366, L13
- Guidorzi et al. (2007a) Guidorzi, C., Romano, P., Moretti, A., & Vergani, S.D. 2007a, GCN Circ. 6192
- Guidorzi et al. (2007b) Guidorzi, C., Romano, P., Vergani, S.D et al. 2007b, GCN Report 41.1
- Halpern & Armstrong (2007a) Halpern, J.P., & Armstrong, E. 2007a, GCN Circ. 6195
- Halpern & Armstrong (2007b) Halpern, J.P., & Armstrong, E. 2007b, GCN Circ. 6199
- Halpern & Armstrong (2007c) Halpern, J.P., & Armstrong, E. 2007c, GCN Circ. 6203
- Halpern & Armstrong (2007d) Halpern, J.P., & Armstrong, E. 2007d, GCN Circ. 6208
- Holland et al. (2007) Holland, S.T., et al. 2007, GCN Circ. 6194
- Ioka et al. (2005) Ioka, K., Kobayashi, S., & Zhang, B. 2005, ApJ, 631, 429
- Ioka et al. (2006) Ioka, K., Toma, K., Yamazaki, R., & Nakamura, T. 2006, A&A, 458, 7
- Jelínek & Prouza (2007) Jelínek, M., & Prouza, M. 2007, GCN Circ. 6197
- Kalberla et al. (2005) Kalberla, P.M.W., Burton, W.B., Hartmann, D., et al. 2005, A&A, 440, 775
- Kann (2007) Kann, D.A. 2007, GCN Circ. 6209
- Kobayashi et al. (1997) Kobayashi, S., Piran, T., & Sari, R. 1997, ApJ, 490, 92
- Kumar & Panaitescu (2000) Kumar, P., & Panaitescu, A. 2000, ApJ, 541, L51
- Kumar & Panaitescu (2003) Kumar, P., & Panaitescu, A. 2003, MNRAS, 346, 905
- Landolt (1992) Landolt, A.U., 1992, AJ, 104, 340
- Lazzati & Perna (2007) Lazzati, D., & Perna, R. 2007, MNRAS, 375, 46L
- Liang et al. (2007) Liang, E-W., Zhang, B.B., & Zhang, B. 2007, ApJ, submitted (astro-ph/0705.1373)
- Malesani et al. (2007) Malesani, D., Covino, S., D’Avanzo, P., et al. 2007, A&A, in press (astro-ph/0706.1273)
- Mereghetti et al. (2007) Mereghetti, S., Paizis, A., Gotz, D., Kreykenbohm, I., Mowlavi, N., Beck, M., & Borkowski, J. 2007, GCN Circ. 6189
- Mészáros (2006) Mészáros, P. 2006, Rep. Prog. Phys. 2006, 69, 2259
- Mészáros et al. (1998) Mészáros, P., Rees, M.J., & Wijers, R.A.M.J. 1998, ApJ, 499, 301
- Molinari et al. (2007) Molinari, E., Vergani, S.D., Malesani, D. et al. 2007, A&A, 469, L13
- Monfardini et al. (2006) Monfardini, A., Kobayashi, S., Guidorzi, C., et al. 2006, ApJ, 648, 1125
- Morrison & McCammon (1983) Morrison, R., & McCammon, D. 1983, ApJ, 270, 119
- Norris et al. (1996) Norris, J.P., Nemiroff, R.J., Bonnell, J.T. 1996, ApJ, 459, 393
- Nousek et al. (2006) Nousek, J.A., Koveliotou, C., Grupe, D., et al. 2006, ApJ, 642, 389
- O’Brien et al. (2006) O’Brien, P.T., Willingale, R., Osborne, J., et al. 2006, ApJ, 647, 1213
- Panaitescu (2006) Panaitescu, A. 2006, MNRAS, in press (astro-ph/0612170)
- Panaitescu (2007) Panaitescu, A. 2007, MNRAS, in press (astro-ph/0705.1015)
- Panaitescu & Kumar (2007) Panaitescu, A., & Kumar, P. 2007, MNRAS, 376, 1065
- Pei (1992) Pei, Y.C. 1992, ApJ, 395, 130
- Piro et al. (1998) Piro, L., Amati, L., Antonelli, L.A., et al. 1998, A&A, 331, L41
- Ramirez-Ruiz & Granot (2006) Ramirez-Ruiz, E., & Granot, J. 2006, ApJ, submitted (astro-ph/0608379)
- Rees & Mészáros (1992) Rees, M.J., & Mészáros, P. 1992, MNRAS, 258, 41P
- Rees & Mészáros (1994) Rees, M.J., & Mészáros, P. 1994, ApJ, 430, L93
- Rees & Mészáros (1998) Rees, M.J., & Mészáros, P. 1998, ApJ, 496, L1
- Romano et al. (2006) Romano, P., Moretti, A., Banat, P.L. et al. 2006, A&A, 450, 59
- Sari & Piran (1997) Sari, R., & Piran, T. 1997, MNRAS, 287, 110
- Sazonov et al. (2007) Sazonov, S.,Molkov, S., Sunyaev, R. 2007, Ast. Lett., in press
- Schlegel et al. (1998) Schlegel, D. J., Finkbeiner, D. P., & Davis, M. 1998, ApJ, 500, 525
- Shaviv & Dar (1995) Shaviv, N.J., & Dar, A. 1995, MNRAS, 277, 287
- Stanek et al. (2007) Stanek, K.Z., Dai, X., Prieto, J.L., et al. 2007, ApJ, 654, L21
- Tagliaferri et al. (2005) Tagliaferri, G., Goad, M., Chincarini, G. et al. 2005, Nature, 436, 985
- Vestrand et al. (2006) Vestrand, W.T., Wren, J.A., Woźniak, P.R., et al. 2006, Nature, 442, 172
- Watson et al. (2006) Watson, D., Reeves, J. N., Hjorth, J. et al. 2006, ApJ, 637, L69
- Willingale et al. (2007) Willingale, R., O’Brien, P.T., Osborne, J., et al. 2007, ApJ, 662, 1093
- Woźniak et al. (2006) Woźniak, P.R., Vestrand, W.T., Wren, J.A., et al. 2006, ApJ, 642, L99
- Wren et al. (2007) Wren, J., Vestrand, W.T, Woźniak, P.R., White, R., & Pergande, J. 2007, GCN Circ. 6198
- Zhang (2007) Zhang, B. 2007, Chinese J. Astron. Astrophys., 7, 1
- Zhang & Mészáros (2001) Zhang, B., & Mészáros, P. 2001, ApJ, 552, L35
- Zhang et al. (2006) Zhang, B., Fan, Y.Z., Dyks, J., et al. 2006, ApJ, 642, 354
- Zhang et al. (2007) Zhang, B.B., Liang, E-W., & Zhang, B. 2007, ApJ, in press (astro-ph/0612246)
- Zerbi et al. (2001) Zerbi, F.M., Chincarini, G., Ghisellini, G., et al. 2001, Astron. Nach., 322, 275