Backward-angle photoproduction of mesons on the proton at 1.5–2.4 GeV
Abstract
Differential cross sections and photon beam asymmetries for photoproduction have been measured at = 1.5–2.4 GeV and at the scattering angles, –1 cos –0.6. The energy-dependent slope of differential cross sections for -channel production has been determined. An enhancement at backward angles is found above = 2.0 GeV. This is inferred to be due to the -channel contribution and/or resonances. Photon beam asymmetries have been obtained for the first time at backward angles. A strong angular dependence has been found at 2.0 GeV, which may be due to the unknown high-mass resonances.
keywords:
PACS:
13.60.Le , 14.40.Aq , 25.20.Lj, , , , , , , , , , , , , , , , , , , , , , , , , , , , , , , , , , , , , , , , , , , , , , , ,
Pion photoproduction has been well studied both experimentally and theoretically in the spectroscopy of N* and * resonances. Many baryon resonances were found and their characteristics were determined at the total energy, 1.7 GeV [1]. However there are many higher-mass resonances (one or two-star resonances) which are not well established and are called missing resonances [1, 2]. Constituent quark models predict more baryon resonances than those observed experimentally [2]. Identification of these missing resonances is important to understand the quark-gluon structure of a nucleon.
There is a possibility to obtain new information on baryon resonances in pion photoproduction by measuring polarization observables at high energies. Some weakly excited resonances are obscured due to other strong resonances which have large decay widths, making it difficult to demonstrate their existance only from the cross section data. Polarization observables are good means to extract the missing resonances [3]. In fact, a strong angular dependence was found in the induced polarization measured using circularly polarized photons for photoproduction at JLab, suggesting the possibility of a relatively high spin resonance [4].
Photo- and electro-production of mesons have been studied at JLab, ELSA, GRAAL, and SPring-8/LEPS via the measurements of not only cross sections but also polarization data at multi-GeV energies. Theoretical models of these meson production processes can be applied to higher energies to investigate the production mechanism and higher mass resonances. A partial wave analysis SAID gives a good fit to the experimental data up to = 2.15 GeV, and the characteristics of baryon resonances are determined [5]. A unitary isobar model, MAID, has been improved and extended up to = 2.0 GeV by including 13 four-star resonances up to (1950) [6]. Dynamical coupled-channel analyses have been performed by combining the data of different reaction modes [7, 8, 9]. The presence of higher mass resonances is shown in the analysis by combining the photoproduction data on N, N and Y channels [8, 9]. However, there are still model uncertainties, especially for relatively higher-mass resonances. The model uncertainties come in part from fewer data points at higher energies. It is important to measure more precise differential cross sections and polarization data around = 2.0 GeV in a full angular coverage.
The LEPS photon energy, = 1.5–2.4 GeV, sits in a transition region from nucleon-meson degrees of freedom to quark-gluon degrees of freedom. The cross sections are known to approximately follow the constituent counting rules above the resonance region and at large scattering angles [10]. The scaling behavior of the differential cross sections has been observed for many photoproduction measurements [11, 12]. Although the LEPS photon energy is slightly lower than the energy where the scaling behavior appears (the onset of scaling), the LEPS data provide information on the early onset of scaling and quark-hadron duality in the transition region [4, 13].
At very backward angles, the production mechanism is expected to be affected mainly by the -channel contribution where a proton or nucleon resonance is the exchanged baryon. The differential cross section data of meson photoproduction show the behavior of the nucleon Regge pole at high energies 3 GeV [14, 15]. The LEPS data provide information on the -channel mechanism at 1.5–2.4 GeV and at the -channel kinematics where there is no experimental data of photoproduction.
The experiment was carried out at the Laser-Electron-Photon beam line of the Super Photon ring 8-GeV facility (SPring-8/LEPS) [16]. A multi-GeV photon beam was produced by backward-Compton scattering (BCS) from the head-on collision between Ar-ion laser photons with a 351-nm wave length and the circulating 8-GeV electrons in the storage ring. The linearly polarized photon beam was obtained from the BCS process with linearly-polarized laser photons. The polarization of the photon beam was about 95% at the maximum energy, 2.4 GeV and about 55% at the lowest energy, 1.5 GeV. The photon beam energy was determined by measuring the energy of the recoil electron from Compton scattering with a tagging counter which consisted of 2 layers of a combination of a hodoscope and a silicon strip detector. The photon energy resolution was 15 MeV (RMS). The typical photon intensity, integrated from 1.5 GeV to 2.4 GeV, was 5/s. Half of the data were taken with vertically polarized photons and the other half with horizontally polarized photons. The polarization was switched about every 6 hours to reduce systematic errors in measuring of the photon beam asymmetries. A liquid hydrogen target with a thickness of 5.6 cm was used. The data were accumulated with 2.1 photons at the target in total.
Produced protons were detected by the LEPS spectrometer covering forward angles. A plastic-scintillation charge-veto counter was located before the target to eliminate charged particles produced by the exit windows and the residual gas in the vacuum pipe for the photon beam. The spectrometer consisted of a plastic-scintillation start counter (SC), a silica-aerogel Čerenkov counter (AC), a silicon vertex detector (SVTX), a dipole magnet, three multi-wire drift chambers (DC1, DC2 and DC3), and a time-of-flight (TOF) wall. The field strength of the dipole magnet was 0.7 T at its center. The angular coverage of the spectrometer was about rad and rad in the horizontal and vertical directions, respectively. Charged particles produced at the target were detected by the SC located behind the target and it determined the trigger timing for the data acquisition system. The AC with a refractive index of 1.03 was used to reject events, which were the main background in the measurement of photon induced hadronic reactions, at the trigger level. The event trigger was made by signals from the tagging hodoscopes, the SC and the TOF wall. Signals from the charge-veto counter and the AC were used as vetos. The typical trigger rate was 20 Hz. The dead time of the data acquisition system was about 3%.
Charged particles were momentum analyzed by using information from the silicon vertex detector and the three drift chambers. Tracks fitted within a 98% confidence level were accepted for further analysis. The stop signal for the time-of-flight measurement was provided from signals of 40 plastic scintillators in the TOF wall. The start signal was provided by the RF signal from the 8-GeV electron storage ring where electrons were bunched at a minimum of 2 ns intervals with a width of 12 ps (RMS). The time-of-flight resolution was 180 ps for a typical flight path length of 4.2 m. The particle mass was determined using the momentum, the path length and the time-of-flight.
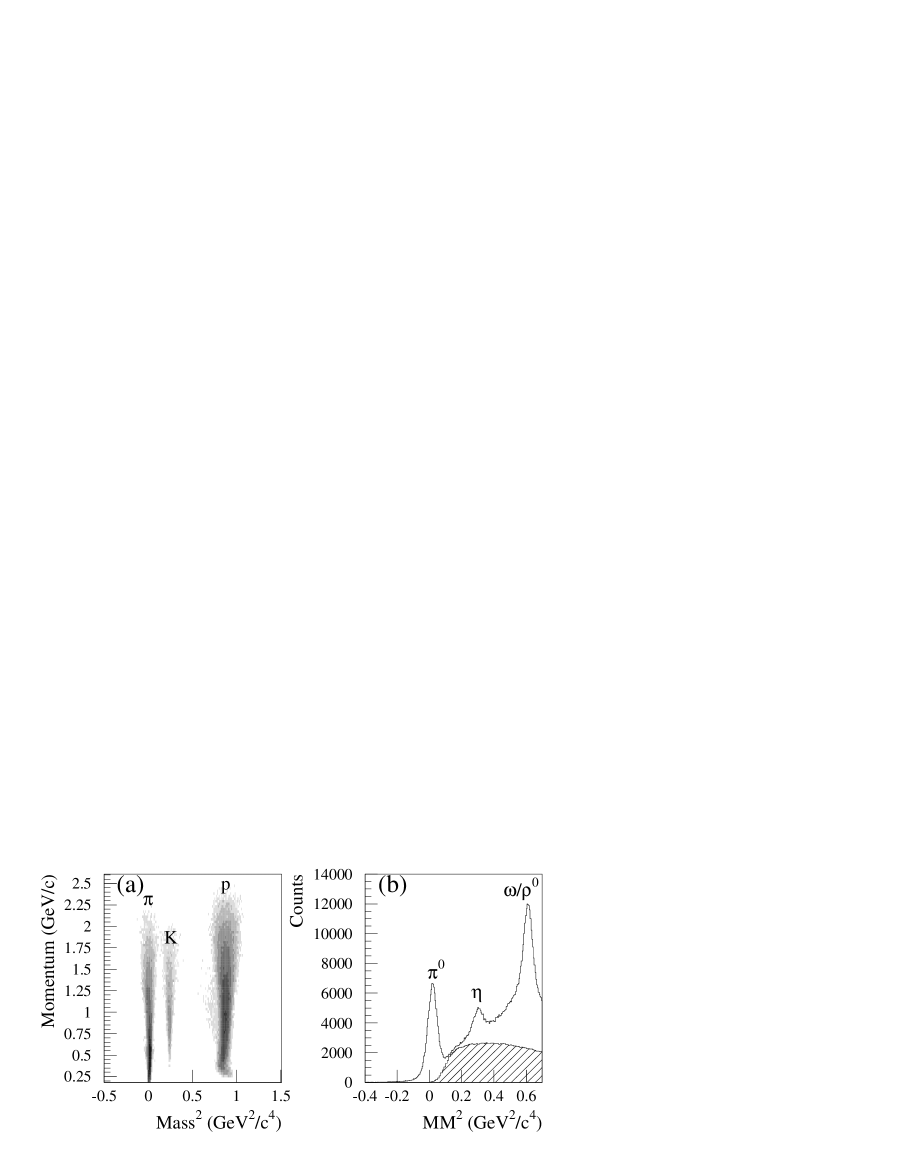
Fig. 1(a) shows the scatter plot of the measured events as a function of the momentum versus the square of mass (Mass2). The mass resolution depends on the momentum. The proton mass resolution was 46 MeV/c2 at 2 GeV/c momentum. Proton events were selected within 5 of the momentum dependent mass resolution. The pion and kaon contaminations were less than 0.1%.
Events produced at the liquid hydrogen target (LH2) were selected by their closest points between a track and the beam axis. Some contamination events stemmed from the SC behind the target. The contamination rate was large as the proton scattering angle was small, because the vertex resolution deteriorated at smaller angles. The contamination rate was estimated as a function of the proton scattering angle. The contamination rate was less than 1% at cos, 3% at cos, and 12% at cos in the scattering angle.
The photon energy was determined by a hit position of a recoil electron from Compton scattering in the tagging counter. The missing mass (MM2) of the reaction was shown in Fig. 1(b). Peaks due to , and photoproduction were observed.
There are background events from the reaction in the peak region. The background shape of the reaction was estimated along with a 3-body phase space using a Monte Carlo simulation for each bin of the photon energies and the scattering angles. Overall factors for the background spectra were determined to minimize the reduced with a template fit for the experimental data. The systematic uncertainty of the background subtraction for yields is 5%.
The spectrometer acceptance, including the efficiency for detectors and track reconstruction, was estimated using a Monte Carlo simulation based on the GEANT3 package. The acceptance, which depended on the photon energy and the scattering angle, was calculated. The systematic uncertainties of the target thickness, due to fluctuations of the temperature and pressure of the liquid hydrogen, was estimated to be 1.0%. The systematic error of the photon number normalization was 3.0%. The systematic uncertainty of the aerogel Čerenkov counter (AC) due to accidental vetoes and -rays was measured to be lower than 1.6%.
Fig. 2 shows differential cross sections as a function of the scattering angle.

Only statistical errors are plotted in the figures and most of them are smaller than the size of symbols plotted. The LEPS data mostly agree with previously published data and have been measured with better statistics than the previous data [17, 18, 19].
The angular distribution of the differential cross section changes around 1.8 GeV. The data show a backward peaking at cos –0.85 above 1.8 GeV, where the -channel contribution is expected to become large, while the data do not show the backward peaking below 1.8 GeV. The backward peaking suggests that the -channel contribution is not negligibly small. The -channel nucleon exchange process could produce the enhancement observed at backward angles and at high energies.
The SAID (solid curves) and the MAID2005 (dotted curves) are plotted up to 2 GeV and = 1.65 GeV, respectively. The LEPS data mostly agree with the SAID results. A small enhancement structure appears around cos –0.7 at 1.85–1.95 GeV in the LEPS data which have not been clearly observed in the previous data due to the poor statistics. The enhancement is well reproduced by the SAID analysis. However, the SAID calculations do not reproduce the backward peaking at 1.9–2.0 GeV. The MAID2005 overestimates the data at cos –0.9 and underestimates the data at the most backward angles. The discrepancy becomes larger as the photon energy goes higher. These disagreements with the LEPS data are due to the lack of the precise data at backward angles. The partial wave analyses will be improved at higher energies and backward angles by including the current data, and can determine the property of higher-mass resonances more precisely.
Fig. 3 shows differential cross sections as a function of the total energy, at eight bins of . The maximum value, , occurs when the proton goes forward at 0∘ from the photon beam direction. The energy-dependent slope for production has been determined for the first time in this energy region. The curves are the fitting results of for the data from 1.93 GeV (the lowest energy) to 2.1 GeV. The slope values obtained from the fitting are indicated in each plot. The fitting was performed with the data in the range of = 1.93–2.07=GeV and 1.93–2.20 GeV. The fluctuation of the results of the slope is 0.5.

The slope becomes smaller at the larger . If the scaling starts in this photon energy region, the data should follow the counting rule, . The quantity is the total number of interacting photon and quarks. The value is 9 for photoproduction. The data becomes closer to the scaling behavior, , at the larger where the momentum transfer is large.
The differential cross sections sharply decrease as goes higher, below 2.1 GeV. However, above 2.1 GeV, the cross sections do not follow the slope determined by the data at lower energies. At 0.3 (top plots in Fig. 3), the cross sections are nearly flat and a small enhancement is seen at 2.1 GeV. At 0.3 (bottom plots in Fig. 3), the differential cross sections at high energies are smaller than the lines. The behavior of the energy distribution above 2.1 GeV is different from those at lower energies. In order to explain the current data in the channel kinematics, new mechanism is needed at high energies.
The photon beam asymmetry is sensitive to an interference of different diagrams. The presence of resonances can be studied by the photon beam asymmetry combining with cross section data. The photon beam asymmetry has been measured in the same kinematical region as the cross section measurement. By using vertically and horizontally polarized photons, the photon beam asymmetry is given as follows:
| (1) |
where () is the photoproduction yield with vertically (horizontally) polarized photons, is the photon polarization, is the photon beam asymmetry, and is the azimuthal production angle which is defined using the reaction plane and the horizontal plane. is the normalization factor for , determined by using the numbers of horizontally polarized photons, , and vertically polarized photons, , at the target as . The value of is in the present experimental data. The dependence of the ratio was fitted with a function cos and the amplitude was obtained. After was calculated using the photon energy for Compton scattering and the laser polarization, the photon beam asymmetry was obtained [20].
The correction for the background contamination from the start counter (SC) has been performed by using the contamination rate () and photon beam asymmetries of the SC events (). The measured photon beam asymmetry is written as . The photon beam asymmetry of the pure events, , was obtained by determining the contamination rate () and the photon beam asymmetry of the events from the SC (). The maximum correction was at = 1.65 GeV and cos.
In this analysis, a tight missing mass cut of –0.1 MM2 0.05 was applied for the selection in order to reduce the contamination from two-pion photoproduction. The background events due to the reaction were corrected for in the same way as the SC correction. The maximum contamination rate was 6.5%. The correction effect was quite small and within the statistical error.

Fig. 4 shows the photon beam asymmetries. The photon asymmetries measured in this analysis are positive and indicate a bump structure around cos at 1.8 GeV. Two bumps are observed around cos = 0 and 0.75 in the data from other facilities. A similar angular distribution of the photon asymmetries has been obtained at 1.5 GeV by the GRAAL collaboration [17]. The MAID2005 including 13 resonances reproduces these bump structures although it slightly overestimates the LEPS data. The SAID agrees with the photon beam asymmetry data, and reproduces the bump structure up to 1.8 GeV, even though the LEPS data are not used for a fit in the analysis. Therefore, below 1.8 GeV, the LEPS data are explained by the well-established partial wave analyses with well-known resonances.
The angular distribution changes at 1.8 GeV as well as the differential cross sections. A strong angular dependence appears at 2.0 GeV. The photon asymmetries show a dip structure around cos = –0.8. The data drop to a negative sign, and then rise up to a positive sign. The discrepancy between the LEPS data and the SAID results is large at 1.8–1.9 GeV. Here, the LEPS data will help to give a constrain for future partial wave analyses. The SL model with the Born terms only shows a positive sign and does not reproduce the dip structure. To explain this strong angular dependence, new mechanism or new resonances are required. There are some candidates of the resonances above 2.0 GeV and the -channel contribution is still large at cos = –0.8.
A new mechanism is needed to explain both the backward enhancement in the cross sections and the strong angular dependence in the photon asymmetries observed in the LEPS data. The backward enhancement in the cross sections is likely produced by the -channel diagrams. A new resonance is needed to make a strong angular dependence of the photon beam asymmetries. By combining both the cross section and photon asymmetry data, photoproduction can now be studied at backward angles and above 2 GeV. Recently, the applicability of SAID was extended to 3 GeV, and the proprieties of resonances were re-fitted by including precise data mainly covering the middle angles from the CLAS collaboration [25]. The LEPS data will be useful to improve the analysis at backward angles.
In summary, the reaction has been studied by using linearly polarized photons at the SPring-8/LEPS facility with 1.5–2.4 GeV. The differential cross sections have been obtained with better statistics than the previous data. The data at very backward angles, –1 cos –0.9, and at 2.0 GeV show a backward peaking. It is suggested that the -channel contribution is important in the backward region. In addition, photon beam asymmetries have been obtained. Above 1.8 GeV, a dip structure is found around cos = –0.8 and cannot be reproduced by using the existing models. In order to explain this structure, the presence of new high-mass resonances combined with the -channel diagrams is required.
We thank the staff at SPring-8 for providing excellent experimental conditions during the long experiment. This research was supported in part by the Ministry of Education, Science, Sports and Culture of Japan, by the National Science Council of the Republic of China (Taiwan), and by the National Science Foundation (USA).
References
- [1] Particle Data Group, http://pdg.lbl.gov.
-
[2]
S. Capstick and W. Roberts, Phys. Rev. D 49 (1994) 4570;
S. Capstick and W. Roberts, Phys. Rev. D 58 (1998) 074011. - [3] D. Dutta, H. Gao, T.-S. H. Lee, Phys. Rev. C 65 (2002) 044619.
- [4] K. Wijesooriya, et al., Phys. Rev. C 66 (2002) 034614.
-
[5]
R. Arndt, W. J. Briscoe, I. I. Strakovsky, R. L. Workman,
Phys. Rev. C 66 (2002) 055213;
http://gwdac.phys.gwu.edu/. -
[6]
L. Tiator, S. Kamalov, nucl-th/0603012;
D. Drechsel, O. Hanstein, S.S. Kamalov, L. Tiator, Nucl. Phys. A 645 (1999) 145;
http://www.kph.uni-mainz.de/MAID/. -
[7]
T. Sato, T.-S. H. Lee, Phys. Rev. C 54 (1996) 2660;
T. Sato, T.-S. H. Lee, Phys. Rev. C 63 (2001) 055201. - [8] A. Matsuyama, T. Sato, T.-S. H. Lee, Phys. Rep. 439 (2007) 193.
-
[9]
A. V. Anisovich, et al., Eur. Phys. J. A 25 (2005) 427;
A.V. Sarantsev, et al., Eur. Phys. J. A 25 (2005) 441. - [10] S.J. Brodsky, G.R. Farrar, Phys. Rev. Lett. 31 (1973) 1153.
-
[11]
L.Y. Zhu, et al., Phys. Rev. Lett. 91 (2003) 022003;
L.Y. Zhu, et al., Phys. Rev. C 71 (2005) 044603-1. -
[12]
P. Rossi, et al., Phys. Rev. Lett. 94 (2005) 012301;
E.C. Schulte, et al., Phys. Rev. Lett. 87 (2001) 102302;
C. Bochna, et al., Phys. Rev. Lett. 81 (1998) 4576;
J.E. Belz, et al., Phys. Rev. Lett. 74 (1995) 646;
S.J. Freedman, et al., Phys. Rev. C 48 (1993) 1864;
J. Napolitano, et al., Phys. Rev. Lett. 61 (1988) 2530;
R.L. Anderson, et al., Phys. Rev. D 14 (1976) 679. - [13] Q. Zhao, F.E. Close, Phys. Rev. Lett. 91 (2003) 022004.
- [14] R.W. Clifft, et al., Phys. Lett. B 72 (1977) 144.
- [15] M. Guidal, M. Laget, M. Vanderhaeghen, Nucl. Phys. A 627 (1997) 645.
- [16] T. Nakano, Nucl. Phys. A 721 (2003) 112c.
- [17] O. Bartalini, et al., Eur. Phys. J. A 26 (2005) 399.
- [18] O. Bartholomy, et al., Phys. Rev. Lett. 94 (2005) 012503.
- [19] K.H. Althoff, et.al., Z. Phys. C. 1 (1979) 327.
-
[20]
R.G.T. Zegers, M. Sumihama, et al., Phys. Rev. Lett. 91 (2003)
092001;
M. Sumihama, et al., Phys. Rev. C 73 (2006) 035214. - [21] L.O. Abrahamian, et al., Phys. Lett. B 48 (1974) 463.
- [22] P.J. Bussey, el al., Nucl. Phys. B 154 (1979) 492.
- [23] P.J. Bussey, el al., Nucl. Phys. B 104 (1976) 253.
- [24] J. Alspector, el al., Phys. Rev. Lett. 28 (1972) 1403.
- [25] M. Dugger, et al., hep-ex/0705.0816v2.