Ca ii and Na i absorption signatures from the circumgalactic gas of the Milky Way
Spiral galaxies are surrounded by large gaseous halos that represent the interface between the condensed galactic discs and the surrounding circumgalactic medium. A powerful method for studying the properties and nature of these circumgalactic gaseous structures is the analysis of absorption-line systems in the spectra of distant quasars (e.g., Richter et al. 2001, Richter et al. 2005). We here concentrate on the study of metal-line absorption systems in the halo of our own galaxy and link them with the distribution of neutral gaseous structures in the Milky Way as seen in H i 21 cm emission.
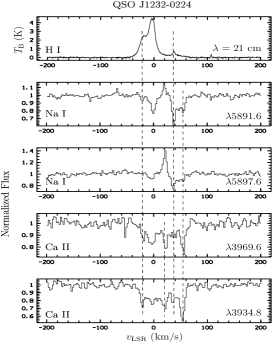
Our sample contains in total 106 sight lines towards quasars observed in the optical with VLT/UVES. Along 43 of them we detect halo Ca ii and/or Na i absorption lines at intermediate or high velocities. For these we have additional H i emission spectra obtained with the 100-m telescope at Effelsberg. The absorption profiles of Ca ii and Na i for one of the sight lines are plotted in the left panel of Fig. 1 on an LSR velocity scale together with the corresponding 21-cm emission spectrum. In many cases the Ca ii/Na i absorption is connected with H i gas at column densities in the range of a few times to . Our H i column density detection limit is about for the warm neutral medium. In a few cases the detected H i signals are below the detection limit of large H i surveys (e.g. LAB survey, Kalberla et al. 2005). The measured H i line widths imply that for most of the sight lines the gas is relatively cold with temperatures below K. The directions and velocities of several of the clouds suggest a possible association with known HVC or IVC complexes. Most Ca ii/Na i absorbers show multiple intermediate- and high-velocity components, indicating the presence of filamentary or clumpy structures.
The right panel of Fig. 1 shows the logarithm of the number of sight lines observed with UVES versus . The distribution of the column density follows a power law with slope . The vertical dashed-dotted line indicates the UVES detection limit of . Therefore, the lower column density cut-off is only a selection effect determined by the detection limit of the instrument. As a consequence we are not able to make conclusions about a typical column density of the Ca ii absorbers.
The fact that among 106 random lines of sight through the halo we observe 43 absorption systems with at least one intermediate- or high-velocity component suggests that the Milky Way halo is filled with low column density gas clouds. Their investigation with synthesis telescopes will allow us to determine their metallicities and, thus, to learn more about their origin. Studying the clouds will also allow us to draw conclusions about the absorption line systems commonly observed in the halos of other galaxies (e.g., Bouché et al. 2006) and the physical state of this gas.

References
- (1) N. Bouché, M.T. Murphy, C. Péroux et al: MNRAS 371, 495 (2006)
- (2) P.M.W. Kalberla, W.B. Burton, D. Hartmann et al: A&A, 440, 775 (2005)
- (3) P. Richter, K.R. Sembach, B.P. Wakker et al: ApJ 562, L181 (2001)
- (4) P. Richter, T. Westmeier, C. Brüns: A&A 442, L49 (2005)