Who is the best connected EC researcher? Centrality analysis of the complex network of authors in evolutionary computation
Abstract
Co-authorship graphs (that is, the graph of authors linked by co-authorship of papers) are complex networks, which expresses the dynamics of a complex system. Only recently its study has started to draw interest from the EC community, the first paper dealing with it having been published two years ago. In this paper we will study the co-authorship network of EC at a microscopic level. Our objective is ascertaining which are the most relevant nodes (i.e. authors) in it. For this purpose, we examine several metrics defined in the complex-network literature, and analyze them both in isolation and combined within a Pareto-dominance approach. The result of our analysis indicates that there are some well-known researchers that appear systematically in top rankings. This also provides some hints on the social behavior of our community.
Keywords: Social networks, co-authorship networks, scientometrics, sociology of science, evolutionary computation, eigenvalues, Pareto front
1 Introduction
Academy, as any other human endeavor, is a complex adaptive system (CAS), and looking at some of its aspects reflect that fact. Since one of the outstanding (and measurable) aspects of academy is publishing, it is interesting to study it to find out how general CAS mechanisms apply to it, and create general models of the system.
One of the possible ways to study this publishing activity is to look at co-authorship graphs, where nodes (or actors) correspond to authors, joined by an edge if they have been coauthors in a paper. This is a non-directed graph, which does not take into account the authorship order, and, besides, considers that all signing authors are actually authors: following Yoshikane et al. [24], we consider that, in general, this assumption is true. Co-authorship graphs have been studied for a long time, starting with Kretschmer [16], but they started to be recognized as complex networks with the work of Newman [19, 20] and Barabási [1], showing they followed power-laws [15] (which might correspond to a preferential attachment growth) and also behaved as a small world [15].
Even as the general framework has been already laid out, there are still a few open issues. Measurements for a particular field, such as evolutionary computation [7], have to be made, and the evolution of its graph followed [8]. This evolution reflects the differential authoring mechanisms in particular fields, and these mechanisms can be modelled. Besides, within every field, finding out sociometric stars reflect the knowledge flow within it and its fertility. Synchronic networking (co-authorship relations) are also related to diachronic networking (citing or co-citing relations), and, thus, it is also interesting for knowledge discovery within a particular field.
Another open issue is exactly what to measure in that network. Looking at a single measure will yield a partial view of the network. While there is a high correlation among some measures (such as betweenness and closeness; definitions will follow later), they reflect different aspects of the network and, thus, they will have to be taken into account globally when making a ranking of the sociometric stars of the graph. In this paper, each actor will be assigned a vector of quantities, and the ranking will be done according to the concept of Pareto front [14], that is, the set of non-dominated authors. Identifying the key actors in our field not only provides some objective metric with which our subjective perception can be contrasted, but it can be also helpful in order to understand some of the patterns of social behavior at work in our community.
2 State of the art
Coauthorship studies have generally focused in macroscopic measures of particular scientific communities: computer support of cooperative work [13], psychology and philosophy [9], chemistry [10], SIGMOD authors [18] and sociology [17], but some other authors [5] have analyzed the topological properties of these networks in general, looking at a particular preprints database (cond-mat). They have found that betweenness and degree follow a long-tailed degree distribution, which is usually to be expected, but it is interesting to prove that it actually happens for a representative sample.
Although all coauthors are considered indistinctly, insome cases the roles of different authors [24] is taken into account, although their focus is on visualization of relations among authors, not on a differential analysis of the different positions, or on the study of the internal structure of the cliques formed via co-authorship.
Another approach to the study of scientific communities is to understand the role of different actors by measuring certain microscopic (node-based) quantities; centrality (see [4]) is one of them, although its definition is not trivial. For example: is an actor more central when it is more visible, or more influential, or more powerful? Furthermore, how can visibility, influence, and power be defined in an objective sense? It should be taken into account that intuition can be misleading here. As an example, consider that one of the first (intuitive) principles that were proposed is that centrality grows monotonically with the number of ties, and that adding ties (edges) should increase one node’s centrality [22]. While these ideas look attractive and intuitive, they do not provide a satisfactory definition of centrality, since the importance of a certain node can however be diminished when other node gets more ties. Freeman [12] gave an answer to this issue, reviewing a number of published measures, and identified three basic concepts for defining centrality: degree, closeness, and betweenness. In this canonical formulation, these three measures have maximum values when the network is star-shaped, hence providing a proper characterization of centrality. Borgatti [3] has also elaborated on this issue, considering the dynamic flow all over the network, and how often traffic flows through a certain node, or how long does it take to get to a certain node.
The amount of papers on this area indicates that there is a lot of work to be done, be it for a particular area or discipline, or on the visualization and methods front. In this paper, we try to use a new method -based on Pareto dominance- to examine the sociometric ranking in a particular field taking into account several centrality features at the same time.
3 Resources and methodology
The bibliographical data used for the construction of the scientific-collaboration network in EC has been gathered from the DBLP –Digital Bibliography & Library Project– bibliography server, maintained by Michael Ley at the University of Trier. This database provides bibliographic information on major computer science journals and proceedings, comprising more than 830,000 articles and several thousand computer scientists (by the end of 2006). We have defined a collection of terms that include the acronyms of EC-specific conferences –such as GECCO, PPSN or EuroGP– or keywords –such as “Evolutionary Computation”, “Genetic Programming”, etc.– that are sought in the title or in the publication forum of papers. Using an initial sample of authors (those that have published at least one paper in the last five years in any of the following large EC conferences: GECCO, PPSN, EuroGP, EvoCOP, and EvoWorkshops), their list of publications is checked for relevance, and the corresponding co-authors are recursively examined. Just as an indication of the breadth of the search, the number of authors used as seed is 3,773 whereas the final number of authors in the network is 7,712, that is, more than twice as many.
The macroscopic measures of the network obtained through this procedure are shown in 1, comparing them with measures taken from a CS repository (NCSTRL, data taken from [21], and historical data on what is basically the same network, taken from [6, 7].
| EC05 | EC06 | NCSTRL | |
| total papers | 6199 | 8501 | 13169 |
| total authors | 5492 | 7712 | 11994 |
| mean papers per author | 2.9 | 2.87 | 2.6 |
| mean authors per paper | 2.56 | 2.60 | 2.22 |
| collaborators per author | 4.2 | 4.02 | 3.6 |
| size of the giant component | 3686 | 4804 | 6396 |
| as a percentage | 67.1% | 62.3% | 57.2% |
| 2nd largest component | 36 | 106 | 42 |
| clustering coefficient | 0.798 | 0.811 | 0.496 |
| mean distance | 6.1 | 10.9 | 9.7 |
| diameter | 18 | 21 | 31 |
The first and obvious observation is that there has been a progression from 2005 to 2006: more than two thousand new authors, but it is also interesting to see that many of these authors have gone to the main component. This increase in the number of authors probably account for the increase in the diameter, that goes from 18 to 21, a small increase which shows again the small world characteristic of this network. Metrics such as the clustering coefficient, the average number of collaborators per author or authors per paper are quite close, with a very small variation, which indicates that collaboration patterns continue in the same way. We will analyze in next section the microscopic features of the network, and in particular who the most prominent nodes are.
4 Sociometric stars
Centrality can be measured in multiple ways. We are going to focus firstly on metrics based on geodesics, i.e., the shortest paths between actors in the network. These geodesics constitute a very interesting source of information: the shortest path between two actors defines a “referral chain” of intermediate scientists through whom contact may be established – cf. [21]. It also provides a sequence of research topics (recall that common interests exist between adjacent links of this chain, as defined by the co-authored papers) that may suggest future joint works or lines of research.
The first geodesic-based centrality measure we are going to analyze is betweenness [11], i.e., the relative number of geodesics between any two actors () passing through a certain (), summed for all :
| (1) |
This measure is based on the information flow between actors: when a joint paper is written, the authors exchange lots of information (such as knowledge of certain techniques, research ideas, potential development lines, or unpublished results) which can in turn be transmitted (at least to some extent) to their colleagues in other papers, and so on. Hence, actors with high betweenness are in some sense “hubs” that control this information flow; they are recipients –and emitters– of huge amounts of cutting-edge knowledge; furthermore, their removal from the network results in the increase of geodesic distances among a large number of actors [23].
| Name | betweenness | |||
|---|---|---|---|---|
| 1 | D.E. Goldberg | 2194962 | ||
| 2 | K. Deb | 1861389 | ||
| 3 | M. Schoenauer | 1479185 | ||
| 4 | H. de Garis | 1246007 | ||
| 5 | Z. Michalewicz | 1144581 | ||
| 6 | X. Yao | 1060389 | ||
| 7 | R.E. Smith | 928108 | ||
| 8 | M. Tomassini | 921023 | ||
| 9 | T. Bäck | 818897 | ||
| 10 | K.A. De Jong | 772788 |
Table 2 shows the top ten actors according to this centrality measure. Notice how the betweenness values decrease abruptly from one actor to the next. There is clearly a power law at work (actually, a power law with exponential cutoff), as is shown in Figure 1.

This scaling is consistent with the presence of a hierarchy of hubs in the network. Whenever a shortest path is sought between two nodes, the nearest common ancestor in the hierarchy is used. Top actors in this ranking are thus those located in the center of gravity of the network, connecting distant regions of the latter.
The second centrality measure we are going to consider is precisely based on this geodesic distance. Intuitively, the length of a shortest path indicates the number of steps that research ideas (and in general, all kind of memes) require to jump from one actor to another. Hence, scientists whose average distance to other scientists is small are likely to be the first to learn new information, and information originating with them will reach others quicker than information originating with other sources. Average distance (i.e., closeness) is thus a measure of centrality of an actor in terms of their access to information.
| Name | closeness | |||
|---|---|---|---|---|
| 1 | K. Deb | 4.1886571e-005 | ||
| 2 | Z. Michalewicz | 4.1091387e-005 | ||
| 3 | D.E. Goldberg | 4.0731538e-005 | ||
| 4 | M. Schoenauer | 4.0731538e-005 | ||
| 5 | B. Paechter | 3.9521005e-005 | ||
| 6 | A.E. Eiben | 3.9502271e-005 | ||
| 7 | D.B. Fogel | 3.8568343e-005 | ||
| 8 | H.-G. Beyer | 3.8433452e-005 | ||
| 9 | H.A. Abbass | 3.8358266e-005 | ||
| 10 | M. Tomassini | 3.8165026e-005 |
Table 2 shows the top ten actors according to this centrality measure, expressed here as the reciprocal of farness, that is, the sum of the lengths of geodesic paths () from a node to every other one:
| (2) |
Notice that the differences in closeness values are not so marked as for betweenness, i.e. there is no power law acting here. The fact that our network is a small world contributes to this. Notice also that the names appearing in this ranking are very similar, although not identical, to the ranking yielded by betweenness; there are actually five well-known researchers (K. Deb, D.E. Goldberg, Z. Michalewicz, M. Schoenauer, and M. Tomassini) showing up in both rankings, in slightly different places.
In addition to the centrality measures based on geodesics, there exist an interesting group of metrics based on degree, that is on the number of ties each actor has. One of them is Bonacich’s index, also called power [2, 4]. In social networks, this power is related to the possibility of going (originally negotiating) from one to another actor in the network using all possible paths. Lots of paths imply lots of options, which, in turn, imply many different ways of negotiating with or influencing another actor in the network. Notice that this index can be also interpreted in the following way: one’s power is higher is one has many connections, and even more if these connections have high power too. Actually, one of the methods for determining this index is finding the fixed point of a linear combination of one’s degree and one’s neighbors’ power. The coefficients of this linear combination have to be chosen so that the procedure converges (this can be ensured by picking a value lower than the dominant eigenvalue of the adjacency matrix [4]), and the resulting values are adequately normalized (in our case, the average squared power is 1.0):
| (3) |
where is the adjacency matrix. Results for this measure, presented for the first time for the EC network in this paper, are shown in table 4.
| Name | power | |||
|---|---|---|---|---|
| 1 | D.E. Goldberg | 1.43818 | ||
| 2 | M. Schoenauer | 1.29379 | ||
| 3 | K. Deb | 1.18711 | ||
| 4 | D. Keymeulen | 1.05472 | ||
| 5 | X. Yao | 1.04514 | ||
| 6 | L.D. Whitley | 1.04259 | ||
| 7 | T. Bäck | 0.93871 | ||
| 8 | T. Higuchi | 0.93698 | ||
| 9 | H. de Garis | 0.91823 | ||
| 10 | L. Kang | 0.89615 |
There are many names in common with the other rankings, but the interesting part is precisely those that are not in common, specially D. Keymeulen. D. Keymeulen works in evolvable hardware, and is a coauthor with T. Higuchi, who is also a new name in this ranking; in turn, Dr. Higuchi is coauthor with H. de Garis and X. Yao, which accounts for the high values of this measure for them. H. de Garis has also coauthored with L. Kang, explaining out the rest of the ranking (it must be added that L. Kang is coauthor of Z. Michalewicz, who is the 11th in the ranking). Besides, L. Kang and T. Higuchi are doors to huge national communities (Chinese and Japanese), over which they have power. It is not surprising to find the actors in this ranking separated by just a few handshakes, or edges. In fact, there are several high-ranking kernels, with each sociometric figure being a door or center to a few of them.
A related approach to the previous one follows when . In that case, an actor’s power is simply
| (4) |
that is, the vector of centrality values is an eigenvector of the adjacency matrix, and must be the reciprocal of an eigenvalue. It is customary to pick the centrality vector associated with the largest eigenvalue. In this case, the resulting ranking is shown in Table 5.
| Name | score | |||
|---|---|---|---|---|
| 1 | D. Keymeulen | 0.358 | ||
| 2 | T. Higuchi | 0.312 | ||
| 3 | M. Iwata | 0.255 | ||
| 4 | I. Kajitani | 0.249 | ||
| 5 | N. Kajihara | 0.221 | ||
| 6 | M. Murakawa | 0.205 | ||
| 7 | E. Takahashi | 0.169 | ||
| 8 | H. Sakanashi | 0.166 | ||
| 9 | N. Otsu | 0.154 | ||
| 10 | M. Salami | 0.153 |
As it can be seen, the dominant eigenvector gravitates around D. Keymeulen, who is the actor with 6th-highest degree (50 coauthors). His role is enhanced by his collaboration con T. Higuchi (and vice versa). The remaining actors in the top ten happen to be coauthors of these two researchers, and hence their presence can be partly attributed to “hitchhiking”.
It is evident from the inspection of the above tables that each of the measures tells a different part of the story. Although there is some correlation among them, this correlation is not perfect, and hence the rankings differ. It makes then sense to think about possible ways of combining this information. This is a standard issue in multi-objective optimization, and we can think in the notion of Pareto-dominance as a means to achieve a global perspective on the centrality status of the different actors. This is what we do next.
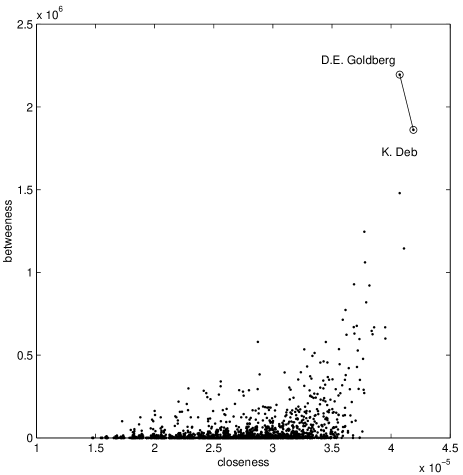
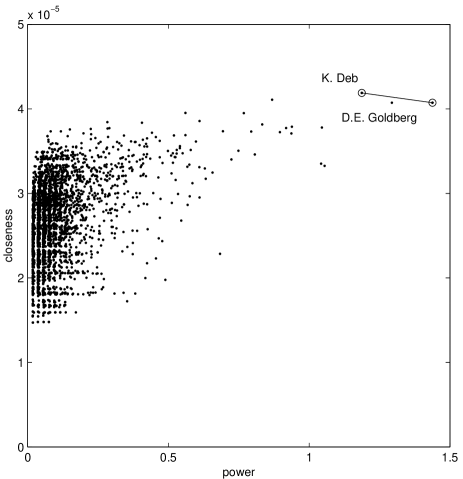
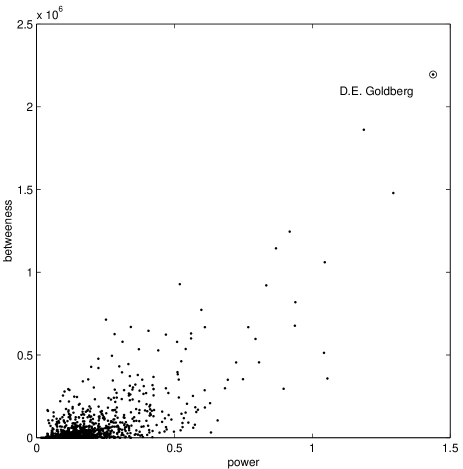
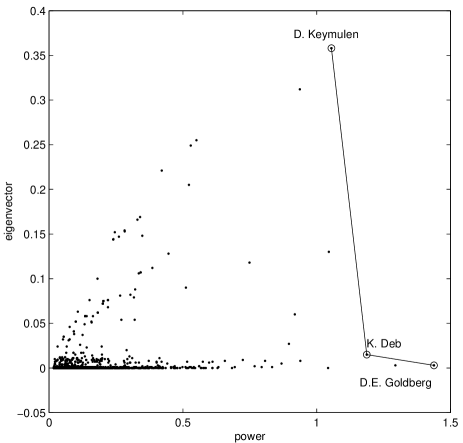
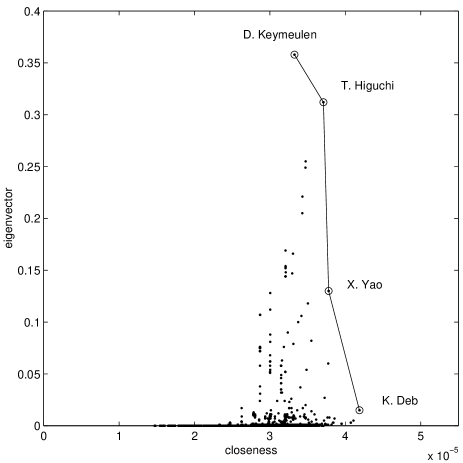
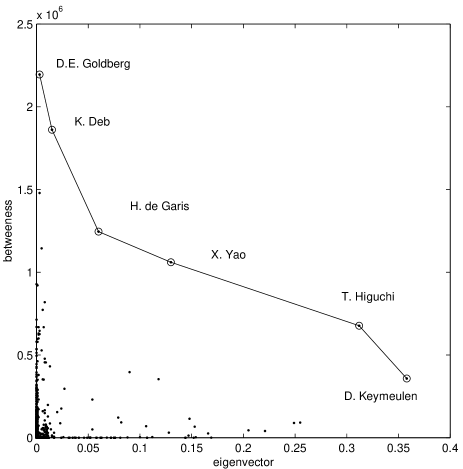
First of all, we have performed pairwise combinations of the previous centrality measures, to determine the extent to which they can be said to be correlated. Figures 2, 3, and 4 show scatter plots of all six possible combinations, and indicate the corresponding non-dominated front (notice that centrality values are always maximized). Notice firstly in Figure 2 and Figure 3 (left) that Bonacich power, closeness, and betweenness are fairly well correlated. The tail of the rankings is rather wide, but a clear correlation is observed for top actors. Indeed, there are just two actors appearing in the non-dominated fronts: D.E. Goldberg (thrice) and K. Deb (twice). The former is actually the global dominating actor for power vs. betweenness. When eigenvector centrality is introduced, the situation is different: centrality gravitates for this measure around a different set of actors, and this is specifically clear in Figure 3 (right) and Figure 4. The correlation is now much more questionable, and as a consequence the non-dominated fronts tend to be wider.
Next, we consider the non-dominated front arising from the simultaneous optimization of all four centrality measures. In this case, the resulting actors are K. Deb, H. de Garis, D.E. Goldberg, T. Higuchi, D. Keymeulen, and X. Yao. If we go to the second non-dominated front (i.e., the front that would result from the removal of actors in the previous front), we get T. Bäck, C. Coello Coello, D.B. Fogel, T. Hoshino, H. Iba, M. Iwata, L. Kang, J. Li, Y. Liu, Z. Michalewicz, M. Schoenauer, and R. Salem. We can easily identify highly recognized researchers in this list, as well as some actors raised to a prominent status due to eigenvector hitchhiking. To see the impact of this fourth centrality measure, we have also recomputed the global fronts considering just closeness, betweenness, and power. The result is the following:
-
•
Front #1: K. Deb, D.E. Goldberg
-
•
Front #2: Z. Michalewicz, M. Schoenauer
-
•
Front #3: T. Bäck, A.E. Eiben, H. de Garis, D. Key-meulen, B. Paechter, M. Tomassini, X. Yao
-
•
Front #4: D.B. Fogel, J.J. Merelo, T. Higuchi, K.A. De Jong, L. Kang, E. Lutton, R.E. Smith, L.D. Whitley
-
•
Front #5: H.A. Abbass, H.-G. Beyer, J. Branke, M. Dorigo, T.C. Fogarty, H. Iba, M. Keijzer, E.G. Talbi, M.D. Vose
Several things must be noted. Firstly, the top two actors for eigenvector centrality also have prominent places in these fronts, showing that the fact that they were spotted by the former centrality measure is not a spurious effect, but a solid indicator of their relevance in the network structure. Secondly, all researchers appearing in these fronts are very well-known in the field for their research excellence. Their appearance in one front or another does not represent therefore a scientific ranking, but a measure of their connectedness under three different measures.
5 Conclusions
Centrality analysis is fundamental in order to grasp the microscopic structure of a network, and understand the mechanisms governing its temporal evolution. Consider that our111Please note that the two authors are part of this community current network is the result of the incremental addition of ties through the years. In this sense, two reflections can be made: the first one is that central nodes owe their prominence to the fact that they are strategically located within the network structure, and this indicates that the growth of the network somehow gravitates around them. Secondly, and related to the previous fact, centrality is a dynamic property that changes with time. An asymmetric growth of the network may displace one actor from a relatively central position, or a highly active actor may become with time one of the most relevant hubs of the network. The analysis presented in this work must thus be interpreted as a snapshot of the situation.
There are two aspects to be highlighted in this work. The first one refers to the methodology used. To the best of our knowledge, this is the first time that a multi-objective approach has been used to characterize centrality using different measures. We believe this is the natural approach that should be followed in this kind of studies, since each measure provides a different (despite some obvious correlation) perspective on the relevance of each actor. The second aspect is the actual results obtained. We have identified a group of researchers (most prominently K. Deb and D.E. Goldberg, but many others can be cited too), that systematically appear both in the top rankings under different measures and in the corresponding non-dominated fronts. This gives an objective picture of who the best connected EC scientists were and are (recall that there is an inherent historical component in centrality). This also gives hints on the current “hot” points of activity, and indirectly (via an examination of the corresponding research subareas) on the current “hot” topics. Related with these previous issues, and in particular with the historical aspect of centrality, we have studied elsewhere [8] the temporal evolution of the macroscopic properties of the collaboration network. It would be very interesting, and it actually constitutes one of our priorities, to conduct a temporal analysis of centrality, identifying the trajectories of the most relevant actors, and -if the trends are clear enough- even forecasting future sociometric stars.
6 Acknowledgments
This paper has been funded in part by the Spanish MICYT projects NADEWeb: Nuevos Algoritmos Distribuidos Evolutivos en la web, code TIC2003-09481-C04, NOHNES, TIN2007-68083-C02-01, and P06-TIC-02025, awarded by the regional government.
References
- [1] A.-L. Barabási, H. Jeong, R. Ravasz, Z. Neda, T. Vicsek, and A. Schubert. Evolution of the social network of scientific collaborations. Physica A, 311:590–614, 2002.
- [2] P. Bonacich. Power and centrality: a family of measures. American Journal of Sociology, 92:1170–1182, 1987.
- [3] S. Borgatti. Centrality and network flow. Social Networks, 27(1):55–71, 2005.
- [4] S. Borgatti and M. Everett. A graph-theoretic perspective on centrality. Social Networks, 28(4):466–484, 2006.
- [5] A. Cardillo, S. Scellato, and V. Latora. A topological analysis of scientific coauthorship networks. Physica A, 372:333–339, 2006.
- [6] C. Cotta and J. J. Merelo. The complex network of evolutionary computation authors: An initial study. Preprint available at http://arxiv.org/abs/physics/0507196, 2005.
- [7] C. Cotta and J. J. Merelo. The complex network of EC authors. SIGEvolution, 1(2):2–9, 2006.
- [8] C. Cotta and J. J. Merelo. Where is evolutionary computation going? a temporal analysis of the EC community. Genetic Programming and Evolvable Machines, 2007. In press.
- [9] B. Cronin, D. Shaw, and K. L. Barre. A cast of thousands: coauthorship and subauthorship collaboration in the 20th century as manifested in the scholarly journal literature of psychology and philosophy. J. Am. Soc. Inf. Sci. Technol., 54(9):855–871, 2003.
- [10] B. Cronin, D. Shaw, and K. L. Barre. Visible, less visible, and invisible work: patterns of collaboration in 20th century chemistry. J. Am. Soc. Inf. Sci. Technol., 55(2):160–168, 2004.
- [11] L. Freeman. A set of measures of centrality based upon betweenness. Sociometry, 40:35–41, 1977.
- [12] L. Freeman. Centrality in networks: I conceptual clarification. Social Networks, 1:215–239, 1979.
- [13] D. B. Horn, T. A. Finholt, J. P. Birnholtz, D. Motwani, and S. Jayaraman. Six degrees of Jonathan Grudin: a social network analysis of the evolution and impact of CSCW research. In CSCW ’04: Proceedings of the 2004 ACM conference on Computer supported cooperative work, pages 582–591, New York, NY, USA, 2004. ACM Press.
- [14] J. Horn, N. Nafpliotis, and D. E. Goldberg. A niched pareto algorithm for multiobjective optimization. In Proc. of the First IEEE Conf. on Evolutionary Computation, volume 1, pages 82–87, Piscataway, NJ, 1994. IEEE Service Center.
- [15] H. Jeong, Z. Neda, and A. L. Barabási. Measuring preferential attachment in evolving networks. Europhys. Lett., 61(4):567–572, 2003.
- [16] H. Kretschmer. Coauthorship networks of invisible collees and institutional communities. Scientometrics, 31(1):363–369, 1994.
- [17] J. Moody. The structure of a social science collaboration network: Disciplinary cohesion from 1963 to 1999. American Sociological Review, 69(2):213–238, April 2004.
- [18] M. A. Nascimento, J. Sander, and J. Pound. Analysis of SIGMOD’s co-authorship graph. SIGMOD Rec., 32(3):8–10, 2003.
- [19] M. Newman. Scientific collaboration networks. I. Network construction and fundamental results. Physical Review E, 64(1):016131, 2001.
- [20] M. Newman. Scientific collaboration networks.II. shortest paths, weighted networks, and centrality. Physical Review E, 64(1):016132, 2001.
- [21] M. Newman. Who is the best connected scientist? A study of scientific coauthorship networks. In E. Ben-Naim, H. Frauenfelder, and Z. Toroczkai, editors, Complex Networks, pages 337–370. Springer-Verlag, Berlin, 2004.
- [22] G. Sabidussi. The centrality index of a graph. Psychometrika, 31:581–603, 1966.
- [23] S. Wasserman and K. Faust. Social Network Analysis. Cambridge University Press, Cambridge, 1994.
- [24] F. Yoshikane, T. Nozawa, and K. Tsuji. Comparative analysis of co-authorship networks considering authors’ roles in collaboration: differences between the theoretical and application areas. Scientometrics, 68(3):643–655, 2006.